TCSAfter very long time TCS has broken out from the triangle. Some good upside is visible on the chart but do it keep SL & position size in check
TCS

TCS--@Resistance Zone?? This stock has encountered persistent resistance within the 3460 range on multiple occasions. On the flip side, the price has consistently found support along a trendline, leading to upward movements.
It's advisable to maintain a bullish perspective as long as the price remains above this trendline. However, exercise caution, as there's a possibility of a false breakdown below the trendline, which could mislead traders and necessitate a prudent approach before considering short positions.

TCS AnalysisAfter a strong gapdown... price is in a range
a drop base drop is going to observe in this stock...
look for sell up to 3340-3330 levels...

TCS - A Crucial LevelTCS remains at a crucial resistance level. While a move to 3580 could trigger a bullish scenario, price below the level has a bearish touch.
This is only an idea. Any trade/Investment should be made with proper risk management only.

TCS Long opportunityDouble Confirmation
Target 3700
CMP: 3421
XABCD Pattern & ABCD pattern both are giving same target. Rest info mentioned on chart

TCS Parabolic Trend BrokenInterest rates are already turning over and should increase mortgage applications which should prove to be bullish for this stock. Tiny homes and container homes will gain in popularity during this time and I believe TCS will benefit greatly from the new trend.
Weekly RSI has bullish divergence going all the way back to Dec 2016 + the last year is showing huge divergence. This one should not take long to develop

TCS--Will break 3400 ??observations::
facing resistance multiple times from this zone...3400 range...
if this range is broken will see a strong momentum towards upside is possible...
we have a trendline support as well...now price is at important level...
if price takes the help of trendline will be on buyside...keep track this levels...
3200 and 3400.

TCS turned bullish long term analysistcs showing bullish reversal. Best for long term investment .target 8k.

Tcs buy @cmp target target 3359, 3459, 3437 ascending triangle Tcs buy @cmp target target 3359, 3459, 3437
ascending triangle breakout
risk reward 1.2
sl @ 3162

Tcs is being in a channel from past few days Tcs is being in a channel from past few days If tommorow market open flat and breaks the channel pattern either side we can take a trade

TCS Low Risk High Reward IdeaAs per my analysis NSE:TCS is now ready to move upside for big levels. My buy level is 3189-3195 with stop loss of 3155 (-44 Points Risk). My expected upside target would be 3234 (+45), 3275 (+85) & 3435 (+246). This could be very low risk and high reward opportunity.
Note: This is my personal analysis, only to learn stock market behavior. Thanks.

TCS--3400 or 3200??Observations::
Before going to rise again, price wants to test the demand at 3200 range.
Previously strong fall is observed from this zone @3400 range,
now its showing again bearishness...if this continue to fall happens up to 3225-3200 range..
look for buy in this zone...
we have a strong demand zone previously in this level, may again push the price above 3400 range.

TCS: Bullish Bat Spring Backtest with Hidden Bullish DivergenceThe Container Store on the weekly timeframe is potentially Backtesting the Spring of a Range and is showing what looks to be Hidden Bullish Divergence on the MACD at the PCZ of what would be a Bullish Bat.

tcs idea for long at retracementslong when the latest retracement is completed. levels mentioned in the charts.

Tata Consultancy has done a Trend Breakout as expected. Tata Consultancy Services (TCS) has recently experienced a breakout from its previous trend and is expected to retest a lower level at the highlighted support. The bearish momentum observed in the past few days has confirmed the anticipated bearish breakout. It is important to observe the price reaction at the highlighted zone following the retest from the support level.

TCS - POSSIBLE BEARISH MOMENTUM ON THE KEY LEVEL FORMED
For more updates, please follow my TradingView page, and if you find the content useful, kindly hit the "thumbs up" button to show your support. If you have any queries regarding trading, please feel free to send me a direct message on TradingView. Additionally, please share this content with your friends who may find it beneficial.
Please note that any trading updates provided here are for educational purposes only, and it is always advisable to conduct your own research before making any investment decisions. It is important to ensure that all conditions are met before following any trade plan suggested in this update.

FINNIFTY EXPIRY 23RD MAYNifty fin had formed a 100 points range from 19400 to 19300.
The sustained breakout on the either side can give a 100 to 150 points momentum.
But as market is in bullish zone, we will try to go 100% on the buying side and 25-30% on the selling side.
market has created a very narrow range inside the blue trendlines.
breakout is expected on the upside.
Have a big green day!!!! tomm
#finnifty #longside #breakout

TCS w pattern break outThere is bullish pattern break out in TCS.
We can expect 5 to 6% movement in coming days..

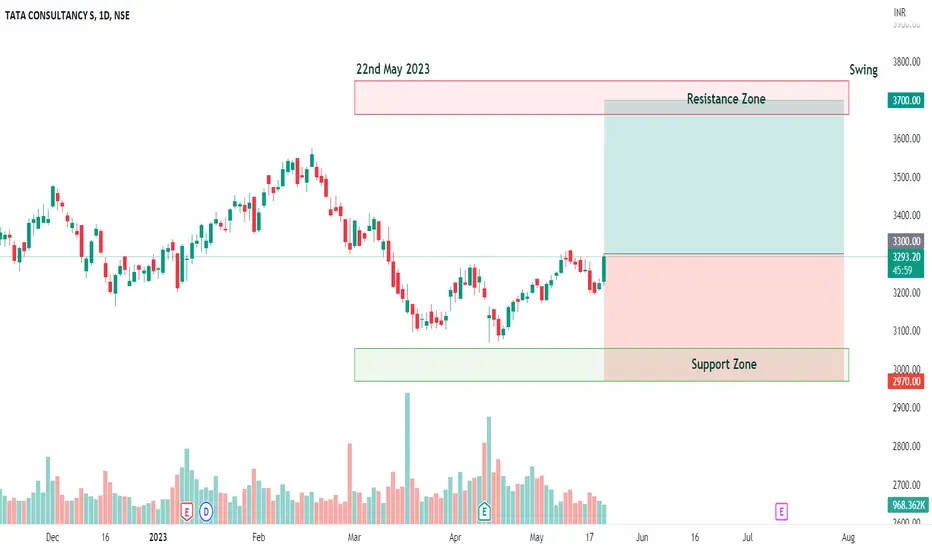
TCS - Bullish Swing ReversalNSE: TCS is closing with a bullish swing reversal candle supported with volumes.
Today's volumes and candlestick formation indicates strong demand and stock should move to previous swing highs in the coming days.
The stock has been moving along the horizontal support for the past few days which is indicating demand.
One can look for a 8% to 12% gain on deployed capital in this swing trade.
The view is to be discarded in the event of the stock breaking previous swing low.
#NSEindia #Trading #StockMarketindia #Tradingview #SwingTrade
Disclaimer:
This is for educational purposes only.
HDFC- Long Since hdfc closed above the previous high
And also retested above the previous high
Possibility for filling the gap is very high
And OI data indicates strong resistance at only 2800
Till 2800, there will be a strong rally.
Fib 0.6 coincides with the IO data
Closed above Fib 0.3 and retested

#PERSISTENT... looking good 17.05.23#PERSISTENT.. ✅▶️
Intraday as well as swing trade
All levels given in charts ...
IF good potential seen then we work in options also
if activate then possible a huge movement Keep eye on this ...
We take trade only when it activates...
Possible to give good target
TRADING FACTS

HDFC - Inverted Flag BreakoutHDFC - Inverted Flag Breakout
It can break on either sides.
Both the sides, there will be a sharp rally

BSOFT Looking good 16.05.23#BSOFT... ✅▶️
Intraday as well as swing trade
All levels given in charts ...
IF good potential seen then we work in options also
if activate then possible a huge movement Keep eye on this ...
We take trade only when it activates...
Possible to give good target
TRADING FACTS
