TCS Hourly Trend AnalysisAs per technical study and price patterns and timing methods, I expect TCS to take a strong bull move towards the resistance of 3273. Increasing volume supports this bull trend till November 17, 2025.
There may be a possibility of profit booking post Nov 17.
This is my personal view based on my analysis. Traders are suggested to conduct own technical studies for entries and exits with proper risk management.
Tcstrend

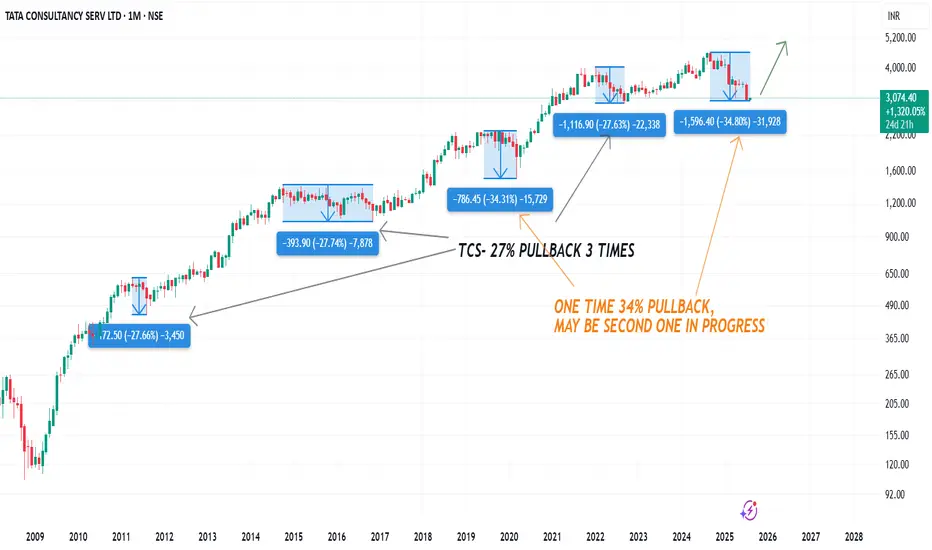
TCS Chart Analysis: Key Trends and Predictions for August 2025**TCS Historical Pullbacks Analysis and Outlook**
Tata Consultancy Services (TCS) has exhibited a remarkable long-term uptrend, punctuated by a series of significant corrections. Your chart annotation highlights a compelling technical pattern: TCS has experienced three major pullbacks of approximately **27%** each over the past decade. These deep corrections have historically been followed by periods of robust recovery and new highs.
Interestingly, your chart also marks two exceptional occasions where the stock witnessed even deeper corrections, around **34%**, the most recent of which may still be in progress. The ability of TCS to consistently bounce back after such steep declines testifies to its underlying strength, market leadership, and the confidence of long-term investors.
**Key Insights From the Chart:**
- **Three 27% Pullbacks:** Marked by distinct blue boxes, each of these corrections provided attractive accumulation opportunities, and each was followed by renewed bullish momentum.
- **Rare 34% Corrections:** These are far less frequent, indicating abnormal market stress or broader corrections, but also highlight zones of potential capitulation and renewed accumulation.
- **Current Status:** The latest price action suggests another 34% pullback may be underway or nearing completion, as marked in orange annotation.
**Strategic Takeaway:**
Given TCS’s proven track record of recovery after such corrections, investors may view these deep pullbacks as strategic buying opportunities for the long term. Patience and discipline are critical, as the stock often rewards those who accumulate during periods of pessimism.
**Conclusion:**
TCS remains a robust large-cap IT pick. Historical patterns suggest that major corrections—while unnerving—tend to precede strong rallies. Investors should watch for signs of stabilization and reversal to position themselves for the next phase of growth, always aligning choices with personal risk tolerance.
TCS POSITIONAL LONG TRADE
Here is the valid Source and its Destination which has violated its opposite Supply;
This is the Demand & Supply Equilibrium Curve according to the Fresh Demand and Supply available.
We have further sub-divided the Curve into 5 areas; considering we as traders are supposed to buy low and sell high where is high and how low can it get; these areas give us an understanding about the Price position as per the Curve.
Price has come into the Demand making Lower Lows and then after reacting to the Weekly Demand Price has violated a previous High; which shows a possibility of Buyers upping their game vs the available sellers.
Finally we have a Demand formed in 45 mins which is the first Demand formed after Price has reacted to the Weekly Demand and we have a Buying momentum confirmation hence this is a Buy Trade favourable reward to risk ratio

TCS gives brake out from Cup Handle Pattern NSE:TCS
TCS GIVES Brake out ON Daily Chart from Cup Handle Pattern.
I Am buying Tcs Stock on my buy level near 4150
and i Will follow sl of 3600
for geting target of 5200
Risk Reward 1:2
Return On Capital 25%
Time Duration 3-6 months

TCS Next Target is Channel Bottom. Now in 0.6 FibonacciNow TCS Reached 0.6 Fibonacci Retracement Target, after Breakout the Rising Wedge Pattern. And TCS Next Target is the Channel Bottom.
I want to help people to Make Profit all over the World.

TCS--@Breakout or Breakdown ??I am sharing the important levels of Support and Resistance. These levels plays a crucial role in trading decisions, as they act as reliable markers of price movements.
------>>Support levels are price points where an asset tends to find buying interest, preventing it from falling further.
---->Resistance levels, on the other hand, are points where selling pressure typically prevents the asset from rising higher.
Take a look at these levels and trade accordingly. Recognizing and respecting these support and resistance levels can help traders make informed decisions and manage risk effectively. They serve as key reference points for technical analysis and are vital tools in successful trading strategies.
Trade safe...Thank you guys for your support

TCS Daily timeframe analysis for long term
NSE:TCS is strong bullish after it has taken splendid bounce from golden zone and has reached first target since buying level 3534.
Next Buy Level is 3679 - 3534. We can see long term move above 3680 if it give pullback buy more near 3679 to 3534 range.
Major targets levels are highlighted in blue lines.

TCS --Trading in a channelThis stock is trading in a bullish channel...
wait until price breaks this channel and gives us retest to sell...If price comes back again to top side will look for sell...keep looking for short..

TCS--3200 Or 3500I am sharing the important levels of Support and Resistance. These levels play a crucial role in trading decisions, as they act as reliable markers of price movements.
------>>Support levels are price points where an asset tends to find buying interest, preventing it from falling further.
---->Resistance levels, on the other hand, are points where selling pressure typically prevents the asset from rising higher.
They serve as key reference points for technical analysis
Look for buy side from 3200 to 3500.

TCS --Near its Demand Zones??I am sharing the important levels of Support and Resistance. These levels play a crucial role in trading decisions, as they act as reliable markers of price movements.
------>>Support levels are price points where an asset tends to find buying interest, preventing it from falling further.
---->Resistance levels, on the other hand, are points where selling pressure typically prevents the asset from rising higher.
If price breaks the resistance, we have a chance of filling the bearish gap, soo keep in buyside until it touches the zone of resistance and bearish gap.
Take a look at these levels and trade accordingly. Recognizing and respecting these support and resistance levels can help traders make informed decisions and manage risk effectively. They serve as key reference points for technical analysis and are vital tools in successful trading strategies.
Trade safe...Thank you guys for your support

TCS--@Resistance Zone?? This stock has encountered persistent resistance within the 3460 range on multiple occasions. On the flip side, the price has consistently found support along a trendline, leading to upward movements.
It's advisable to maintain a bullish perspective as long as the price remains above this trendline. However, exercise caution, as there's a possibility of a false breakdown below the trendline, which could mislead traders and necessitate a prudent approach before considering short positions.

TCS AnalysisAfter a strong gapdown... price is in a range
a drop base drop is going to observe in this stock...
look for sell up to 3340-3330 levels...


TCS--Will break 3400 ??observations::
facing resistance multiple times from this zone...3400 range...
if this range is broken will see a strong momentum towards upside is possible...
we have a trendline support as well...now price is at important level...
if price takes the help of trendline will be on buyside...keep track this levels...
3200 and 3400.

TCS Don't buy and get stuck and loose ur money buy when these level sustains and give bearish or bullish signal.

TCS Low Risk High Reward IdeaAs per my analysis NSE:TCS is now ready to move upside for big levels. My buy level is 3189-3195 with stop loss of 3155 (-44 Points Risk). My expected upside target would be 3234 (+45), 3275 (+85) & 3435 (+246). This could be very low risk and high reward opportunity.
Note: This is my personal analysis, only to learn stock market behavior. Thanks.

TCS--3400 or 3200??Observations::
Before going to rise again, price wants to test the demand at 3200 range.
Previously strong fall is observed from this zone @3400 range,
now its showing again bearishness...if this continue to fall happens up to 3225-3200 range..
look for buy in this zone...
we have a strong demand zone previously in this level, may again push the price above 3400 range.

TCS w pattern break outThere is bullish pattern break out in TCS.
We can expect 5 to 6% movement in coming days..

TCS bullish breakout of w pattern.There is bullish Breakout in TCS.
On daily chart their is technical price action break out of W pattern.
One should hold TCS for short term gain.

TCS: 11th April: Hit or Miss ?TCS looks promising on charts before results.
Take the range marked seriously and identify your Risk Reward accordingly.
My version of TCS --> Take Charts Seriously :D
Luck!

TCS Cup And Handle Pattern.TCS Cup And Handle Pattern.
TCS stok already support level ...
breakout expect......
Disclaimer: Investment in securities market are subject to market risks, read all the related documents carefully before investing.
not buy or sell Recommendations

TCS - Great short at 3430 It will give slight breakout of trendline and fall from the previous supply zone
Goes ex dividend at same time
Follows Trendline
Overbought on RSI
Slowing volumes on uptick
Matches Global Weak outlook
SL 3449 (-19)
Tgt 3200 (+230)
Caution : FNO can cause heavy losses on bad position sizing. Do your own research before taking trades. Not a registered analyst.

HnS in TCSTCS and all other IT Stocks looking weak, keep TCS on radar for selling, sell after breaking the neckline.
