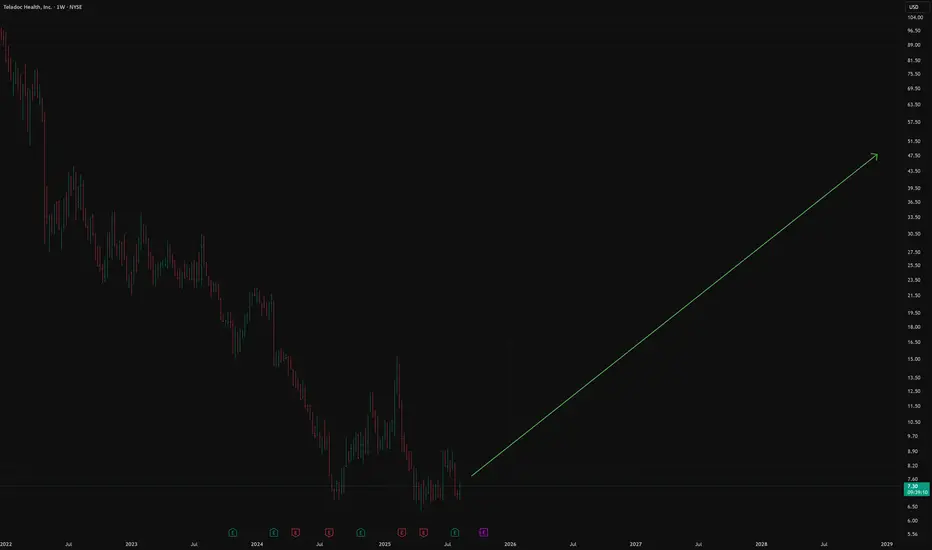
$TDOC looking Juicy in higher timeframe!- NYSE:TDOC weekly and monthly looks like its ready for the take off.
- AI should make the company leaner and more effective.
- AI in healthcare is secular trend.
TDOC

$TDOC Breakout Play- NYSE:TDOC is in process of breaking out of multi-year downward trendline.
- There are so many tailwinds which should propel the stock higher including AI in healthcare.
- Aging population in US would need access to doctors and there are shortages of doctor. Telemedicine would be faster, easier way to diagnore/triage patients.
- Improvement in mult-modal LLMs should lead to efficiencies in the business. NYSE:TDOC should be able to go leaner by cutting down cost by laying off manual work and utilizing AI.

Teladoc Mid-Long term ideaTeladoc Health is a company specializing in telemedicine and virtual healthcare.
The company gained wide popularity during the covid-19 pandemic.
The company has historically expanded its operations through M&A:
In 2013 and 2014, the acquisition of Consult A Doctor, AmeriDoc allowed Teladoc to become one of the largest telemedicine companies in the United States.
Today, the company is valued by the market as value, although a few years ago the valuation was growth. Why did this happen?
As part of its strategy, the company's previous CEO had aggressive M&A deals on credit.
In 2021, TDOC's revenue growth began to slow rapidly. And in Growth companies, growth rates determine, if not everything, then a lot, including market valuation.
Price/Sales 2020 at its peak was over 30, which is very expensive. Before the company's triumph in 2020, the valuation was around 10. Today, P/S is only 0.5
It is necessary to separately touch upon such a parameter as the company's balance sheet and valuation through the prism of the P/B multiplier. The balance sheet grew rapidly in 2020, but it was done through the growth of goodwill, and not through the growth of fixed assets. In general, the growth of goodwill in the balance sheet is an extremely interesting thing and we will discuss this in the following posts. Starting in 2022, the company's balance sheet began to decline sharply, but the write-offs were NON-CASH, and there was a revision of that same goodwill.
On average, the company's P/B was around 4-5 and at its peak it reached 15. Today, the market values companies at 0.9, and this is despite the fact that the main write-offs have already occurred. The company has a debt of 0.99 B$
Cash and cash equivalents 0.67 B$
Which gives us a net debt of 314 M$
The company's revenue has been stagnating since 2023 and is 2.54 B$ TTM
The good thing is that starting from the same 2023, EBITDA began to grow from 0.066 B$ to 0.160 B$
OCF is positive
2022 193.99 M$
OCF today 303 M$ TTM
FCF is positive
2022 16 M$
2025 151 M$ TTM
The company today has a stable financial position with a net debt of 314 M$ and FCF 150 M$
In June 2024, Chuck Divita was appointed as the new CEO of the company, who is trying to put TDOC back on the rails of revenue growth and restart revenue growth while maintaining current margins. The first steps in this direction have already been taken and in February 2025 Teladoc acquired Catapult Health for 70 M$ in order to launch a sales funnel.
Also, in the near future, the Fed will begin to lower rates and since TDOC belongs to the small caps category, this will help in the revaluation of both the sector and Teladoc itself.
Conservative targets can be called 45-55$ , closing the very gap when the company made a large write-off of goodwill in the report.
In general, we make the target 80-100$
TDOC Teladoc Health Options Ahead of EarningsAnalyzing the options chain and the chart patterns of TDOC Teladoc prior to the earnings report this week,
I would consider purchasing the 20usd strike price Calls with
an expiration date of 2026-1-16,
for a premium of approximately $1.04.
If these options prove to be profitable prior to the earnings release, I would sell at least half of them.

Teladoc Health | TDOC | Long at $9.91Teladoc Health NYSE:TDOC - Initial position started at $9.91 with the potential for the price gap in the $7's to be closed in the near future (likely another entry there unless fundamentals change)
Pros:
User base of over 90 million and growing
Revenue grew from $555 million in 2019 to $2.6 billion through Q3 of 2024
Positive free cash flow since 2021
Low debt (debt to equity ratio around 1x)
AI integration and partnership with Amazon and Brightline
Historical simply moving average is approaching price, which often leads to a jump or change in downward momentum in the longer-term
Cons:
Currently unprofitable and not forecast to become profitable over the next 3 years
Lots of insider selling and exercising of options
No dividend
Daily price gap in the $7 dollar range which may close prior to move up
Targets through 2027 :
$14.20
$20.00
$27.00
$35.00
$55.00 (long-term, positive outlook)

$TDOC sling shot to $35-50 | 400-500% return- Fundamentals are improving, people shorted it because they thought pandemic boosts virtual care but there will always be demand for virtual care & reference when it comes to getting medicine.
- There's huge shortage of doctors and wait times at hospital is awful.
- This stock is getting accumulated by whales. I believe longer the base, higher in space.
PT 1: 35
PT 2: 50

TDOC: $33.0 | Bid at Sub $20 to $5.0 some big player is shorting this issue in accordance to earnings and forward cashflows..
this Covid Sweetheart is getting a reset..
re org change CEO and board then re pack for the next 4 years

Teladoc partners with Brightline to expand into paediatricTeladoc Health Inc., a leader in the US telemedicine market, has announced a strategic partnership with Brightline, a digital platform specialising in mental health care for children, adolescents, and their families. This partnership marks Teladoc's entry into a new and promising healthcare market segment, focusing on paediatric mental health – a critical area of growing need.
Through this collaboration, Teladoc Health will integrate Brightline's expertise in paediatric psychology and psychiatry into its telemedicine service, offering access to specialised care for a sensitive and complex patient group. This move expands Teladoc's service range and positions it at the forefront of addressing the rising mental health challenges among younger populations.
Technical analysis of Teladoc Health Inc. (NYSE: TDOC)
Let us explore the potential trading opportunities based on the current technical setup of Teladoc's stock:
Timeframe : Daily (D1)
Current trend : the stock is showing signs of the beginning of an uptrend
Resistance level : 10.15 USD
Support level : 9.25 USD
Potential downtrend target : if the stock enters a downtrend, the downside target could be around 8.70 USD
Short-term target : if the uptrend continues and the stock breaches the resistance at 10.15 USD, a short-term target could be set at 11.85 USD
Medium-term target : with sustained positive momentum, the stock price might rise to 13.40 USD
Investors should closely monitor Teladoc Health's performance, particularly in light of this new partnership with Brightline. Integrating specialised paediatric mental health services could significantly enhance Teladoc's market position and potentially increase stock value as the company taps into this underserved sector.
—
Ideas and other content presented on this page should not be considered as guidance for trading or an investment advice. RoboMarkets bears no responsibility for trading results based on trading opinions described in these analytical reviews.
The material presented and the information contained herein is for information purposes only and in no way should be considered as the provision of investment advice for the purposes of Investment Firms Law L. 87(I)/2017 of the Republic of Cyprus or any other form of personal advice or recommendation, which relates to certain types of transactions with certain types of financial instruments.
Risk Warning: CFDs are complex instruments and come with a high risk of losing money rapidly due to leverage. 65.68% of retail investor accounts lose money when trading CFDs with this provider. You should consider whether you understand how CFDs work and whether you can afford to take the high risk of losing your money.

Teladoc's Bumpy Ride: From Telemedicine Champion to Flop
Teladoc Health Inc. (NYSE: NYSE:TDOC ) once stood as a beacon of hope in the realm of healthcare innovation, poised to revolutionize the way people access medical services through telemedicine. However, what was once a soaring success story has now become a cautionary tale of overambition and strategic missteps, as evidenced by the company's staggering decline in stock price and ongoing struggles to meet investor expectations.
The Rise and Fall:
In the midst of the COVID-19 pandemic, Teladoc's ( NYSE:TDOC ) stock skyrocketed to unprecedented heights, reaching a peak of $308.28 per share. Yet, this euphoria was short-lived, as the company's value plummeted to less than $20, marking one of the most dramatic collapses witnessed in recent years. The catalyst for this downfall? A series of strategic blunders, most notably, the ill-fated $18 billion acquisition of Livongo Health.
The Livongo Debacle:
Teladoc's ( NYSE:TDOC ) acquisition of Livongo Health was meant to be a game-changer, a strategic move that would cement its position as a dominant force in the healthcare industry. However, what ensued was a costly mistake that sent shockwaves through the market. The deal, which initially seemed promising, quickly soured, resulting in a staggering $13 billion noncash impairment charge and a significant erosion of shareholder value.
Financial Turbulence:
The repercussions of Teladoc's ( NYSE:TDOC ) missteps were felt acutely in its financial performance. Despite once being hailed as a growth story, the company's revenue growth has stagnated, with fourth-quarter revenues rising by a meager 4% year-over-year to $661 million, falling short of analyst estimates. Additionally, Teladoc's ( NYSE:TDOC ) guidance for future revenue growth has been tepid at best, with projections suggesting a paltry 2.5% increase.
Challenges Ahead:
Teladoc's ( NYSE:TDOC ) woes extend beyond its financial struggles. The company faces mounting challenges in a post-pandemic landscape, with the allure of virtual healthcare waning as traditional clinics and hospitals reopen their doors. Moreover, attempts to capitalize on upselling opportunities have faltered, leaving Teladoc grappling with a shrinking market and dwindling investor confidence.
Market Outlook:
As Teladoc ( NYSE:TDOC ) braces for further turbulence, analysts predict a grim future for the once-promising stock. With expectations of downward revisions to earnings estimates looming on the horizon, the company's shares are poised to experience further declines, potentially plummeting to a low of $15 per share, representing a staggering 30% drop from recent levels.

TDOC health ... FALLEN angel long 18.75 set up , trying to form a base , against all technical rules im trying to catch a falling knife as some time being a contrarian pays off , solely concentrating on the risk / reward element , base building going on last few sessions , long 18.75 add 18 stoploss cls below 16 , adding more on break out above 20 and trailing stop with every move to save position

Long TDOC -Teledoc HealthThis chart is hilarious lol. Building a long here, 33% in- will add once I see more confluence. Company apparently is making money. Real product, real people. Down horrendously, 95% +. 1-3 month trade. Not advise. Good luck.

TDOC - Update after a Bullish WeekIve been eyeing TDOC for some time, finally posting a chart on it talking about TA developments that may indicate a potential bottom area earlier this week (Check below for the link to that chart). I was also in the camp of TDOC going lower to the low $20 or high Teens ($18-19).
This weeks move of 30%, closing the weekly candle at 20% gains was a wonderful surprise.
Its important to NOTE, however that the move is NOT SET IN STONE yet -> For WEEKLY Timeframe
We are hitting a MAJOR confluence of RESISTANCES. Though we are ever so peaking our head out atm, next 1-2 weeks will show more evidence with confirmation.
FOr example: Next week CLOSE being a bullish single candle or next couple weeks printing a bullish candlestick pattern sequence.
The other side is that It could very well be a fake out/ SELL OFF and we do come back down to make a final lower low before we really become bullish. But in my opinion, the probability of a fake out maybe less.
We've moved above the 21 week EMA as well, we would need to confirm support above it in the coming weeks but being above 21 EMA indicates bullish activity.
NOTICE the Bollinger bands. Notice how it has narrowed, this could indicate volitility to pick up and we need to see price stay above median line and be near the upper band. We must Observe what happens in the coming weeks.
The Bollinger median line and 21 EMA are converging and can act as strong support zone. If we do come back down in price.
On the DAILY timeframe, we acted as SUPPORT on both the PURPLE major RESISTANCE line from all time highs and RESISTANCE line from July 2022. Just note however i would need more confirmation in the coming days by staying above as support, to be confident we stay at these levels. If we do, next weeks candle stays above and no fakeout occurs.
RSI is breaking out of the Horizontal resistance line that kept RSI range bound since OCT 2021. (indicated by black line)
This tells me, the BULLISH DIVERGENCE is at play. We would want RSI to continue UP, or follow the Green arrowed path drawn. We absolutely do NOT want the Red arrow. Which is a possibility but less probable in my opinion.
STOCH RSI, a momentum indicator shows that we have a bullish momentum cross, showing that there is still gas left in the tank for us to move. Expect it to go above the 80 level.
Conclusion + trade setups:
For stocks that are 80+% off there tops, averaging in always is a nice strategy.
I think under $30 is cheap for TDOC, especially with all these TA challenges being slowly conquered. There is no denying that it is highly probable we go up eventually, as we've reached critical historical support, and have been consolidating around here for awhile. Alot of indicators and other signs are leaning towards a bottom being formed or already formed.
*CHECK OUT A more detailed TDOC chart from earlier this week BELOW*
A swing trade idea could be taking positions using the Daily timeframe, putting stop loss below the PURPLE line. Making sure you manage your risk properly.
I would rely more on the WEEKLY timeframe and a confirmation that we've made it above the resistance, plus weekly candles are more macro and powerful. This would also be for holding/ longer term investing.
THANK YOU! Hope this update helped. If you like the content, please boost and follow. Please do comment with your opinions! Would love a discussion.
DISCLAIMER: I am not a Financial advisor. This is NOT financial advise. This is my opinion and for educational purposes.

TDOC Teladoc Health Options Ahead of EarningsIf you haven`t sold TDOC here:
Then analyzing the options chain and chart patterns of TDOC Teladoc prior to the earnings report this week,
I would consider purchasing the 20usd in the money strike price Calls with
an expiration date of 2024-1-19,
for a premium of approximately $5.90.
If these options prove to be profitable prior to the earnings release, I would sell at least half of them.
Looking forward to read your opinion about it.

TDOC - Teladoc bottom fishingHello. This chart is strictly a Technical Analysis of Teladoc (TDOC).
I think currently we are in a point in TDOC's price action where we've reached a fundamental SUPPORT area if you look back to 2016. This could potentially be opportune BUY ZONE.
TA is all about probability. The probability we go down is always there, just in this scenario i believe the probability of downside is less compared to the upside.
Though i want some short term downside for TDOC, as i believe that would be the necessary catalyst to help shift trend to upside. Price will eventually rally up, especially if we are in a bull market currently. Which i believe we are in. Ill go into details on why i want it and believe this.
NOTE: This is on the WEEKLY timeframe, so we are looking into a more macro scenario than if we were to look at DAILY timeframe.
LAST WEEk -> We printed a candle that has a large upper wick, indicating SELLING pressure.
We are also resting right on top of a major support level at around $23, indicated by green horizontal like.
It wouldnt be bad for price to drop below and touch the lower 2 green lines, the sloping one and horizontal one. This would be a catalyst due to price action then, starting to confirm what is known as a BULLISH DIVERGENCE.
Which is a pattern or concept where PRICE ACTION forms LOWER LOWS, as INDICATORS create HIGHER LOWERS -> Seen by the white sloping line drawn in the RSI and MACD. And the green sloping line in PRICE ACTION indicates the lower lows.
*Many trades ive recently taken have followed similar patterns, ill link 1 chart to compare this to BELOW* Its for stock LMND. Heres also a SNAP SHOT.
NOTICE the horizontal white line on RSI -> this is what helps me guage at when this move and UPSIDE can start or hit. If RSI breaks out above this line, we can start to see BULLISH DIVERGENCE playout. Easily i can see TDOC hitting around the $40.00 level.
Going back to CURRENT price action. I believe we go down and test the lower green lines, because of all this RESISTANCE that we are facing.
NOTICE:
#PURPLE SLOPING RESISTANCE LINE -> This is MAJOR MAJOR resistance, created since Feb 2021. We just tested it for the 3rd time, last week. (Note: atleast 3 touches are required to weaken lines, more price touches lines -> the weaker they get.)
# We also got some short term WHITE SLOPING RESISTANCE LINES. Helping to push price down
# We also got the 21 EMA (YELLOW Moving average)
******Note, all these are meeting together to act as RESISTANCE. When theres so many converging, like this -> It gets a little hard or takes time to break through to upside.
***ALso i think the PURPLE line is MOST IMPORTANT. This would help reverse trend in a major macro way.
SO KEEP OBSERVING.
Lastly, note the ADX & DI -> This is a momentum indicator. When RED line is over Green line, it indicates BEARISH Price action, as you can see by the downtrend. Currently there is some green overlapping occuring. We have to keep observing to see how this progresses. But ideally, we'd like to see Green shoot up to above 20 level, just like the red line did in white box.
CONCLUSION: I believe in the short term, we could have some downside price action coming. But sometimes, downside action could have positive ramifications. In this case, further strengthening the BULLISH DIVERGENCE forming in the charts. Indicators and current support area, indicate seller exhausting. Probabilities in my opinion point to price moving up than down. Hitting either one of the lower green support lines, could be areas where positions can be taken with stop losses set below.
DISCLAIMER: This is by NO MEANS, Financial advice. I am not a financial advisor, im just a TA nerd and post these for educational purpose. Always follow your own due diligence when trading/investing. Always focus most of your energy on risk management strategies.
If you like this content, please do BOOST, FOLLOW and do COMMENT, i would like others opinions on what your seeing, whether TA or FA. Thank you.

Long TDOCBeen nibbling at this one for a while, finally had time to check monthly MACD ......we have a geen cross. Very hard to ignore. Adding to longs here. triple bottom on Daily also

Triple Bottom On TDOC, LongTriple Bottom on TDOC, have no clue what these people do but I know when macro changes this dogshit will pump more then the rest. At home doctor narrative coming back of course. Market makers just keeping it from going to zero now with classic patterns, I will start dipping my toe for long term cap gains swing positions on this move.

$TDOC - OverboughtTeladoc Overbought. SPY reaching $420, unsustainable rally, the entire market is overbought.

TDOC is about to make a Breakout but which way will it go?What we are looking at here is TDOC on the Daily TF.
Draw your attention to down sloping trendline (Yellow). You will notice that the yellow trend line is acting as resistance and the price action has hit this line a couple of different times.
The price action from today (1/9/2023) helped solidify the downward sloping trendline and showed us that the resistance is strong along that line.
Now look at the downward sloping trendline (Green). It used the price action on Friday (1/6/2023) to help solidify that downward sloping trendline, which is acting as support.
The yellow resistance line and the green support line are creating a wedge pattern for TDOC to make a move.
If the Yellow resistance line gets tagged a couple more times, you can expect further upside and a breakout.
However, if you tag the support (Green line) too many times more, you will see price breakdown and the price of TDOC could go lower.
This is a situation where you just sit and wait for the price action and the charts to tell you what to do next.
TDOC will continue to be monitored as this stock has a lot of potential for a breakout.
What do you think will happen next with TDOC? Do you think Breakout or Breakdown?
Let me know in the comments.
Cheers.

TDOC $40c for Sept30Looking at these as may be a good risk reward. Sizing right is a must. I've been wrong about TDOC in the past, but if this plays out the calls are just about 0.60 or $60 per contract. Selling the $45c can limit risk by 50%.

$TDOC $70c for Oct or Dec. I've been following these waves in $TDOC, and I think it is primed for a pump. Kathy has been buying for the ARK funds recently and accumulating with small sizes yet consistently to put a floor on $TDOC. Using the Fib retracement from the recent top at $77.94 the stock had a nice closing last week slightly above the 23.6% fib, which perhaps could mean that the momentum can continue towards $45, and then maybe lateral from $50 to $70 by October-December. I think December calls are a safer bet. Strikes I'm looking are the $70s and $90s.

$TDOC -75% DISCOUNT (52-WK) -90% (ATH)!Teladoc is a good stock if you are thinking about adding a HealthCare stock to your watchlist/portfolio. It is currently showing a possible sign of basing, but I think it has a way to go down! The original Heavy buying positions from IPO '15 to May '17 is the $29.20 area! Which is good entry to swing to the $308 ATH, but the $7.50 entry area is a SNIPER! anything in between those two are good entries for long-term.

Teladoc Health TDOC options ahead of earningsLooking at the Teladoc Health TDOC options chain today, i would buy the $35 puts with
2022-8-19 expiration date for about
$1.49 premium.
Looking forward to read your opinion about it.

TDOC Swing TradeOversold! Horizontal & 1000 Month EMA support held.
Active position @$30
SL: $28.2
Projected Exit: $60 - Easy 100%
