Teledoc: Time to Collect$TDOC, Cathie Wood's 3rd largest position (ARK Investing) has dropped more than 31% from its ATH retracing down to its 200SMA on the daily chart. This is is a great company with great future potentials. The price may drop further due to an overall sell-off in the entire market, which gives us a better opportunity to collect more. Not financial advice, DYODD!
TDOC

TDOC - cup and handleTake notes! Cup and handle upon confirmation of break above top. Chance to run to new highs. Solid risk reward here. Place entry for calls above top, set stop loss under. Let the trade come to you!
Like/Follow if you like this idea! Thank you!.

TDOCStrong price action from one of the market leaders
Watch for a price above the trendline
Possible bounce back from 10EMA IMO
NYSE:TDOC

$TDOC Cup and Handle patternThis is not financial advice, this is my opinion and should not be used as a reason to trade $TDOC. A super clear Cup and Handle pattern and going off the handles highest level and the lowest point of the "cup" my price target for $TDOC is ~$340. Please let me know what you think and if you have any other info or suggestions. Thanks.

TDOC - LongTeledoc Health (TDOC) is trading inside of a rising wedge that we believe will break to the upside. The green upward trend-line is the target. Our two highly probable scenarios are outlined on the chart. A rise in volume should push the stock above the cyan resistance line. A backtest after the breakout would be a great time to accumulate. - HH


TDOC bullishA close above the orange line could push TDOC to $400.
*Just free advice, not financial advice. We love to share what we do. - HH

TDOC Breakout Trade, with Trigger and StopAfter the acquisition of LVGO, TDOC has traded sideways, creating a 6 month base. During that time TDOC has increased its institutional holders to 44 funds. Technically, the chart is showing an inverted head and shoulders base beakout, a trendline break, and consolidating below supply between 225-240. Above 240, TDOC can break upward to 300 with an upward target of 500. The chart is similar to ROKU's pre-breakout, which I also posted. (see related ideas). The stop would be a break below the downtrend, at 215.

TDOC to rise and test the long term resistanceTDOC presents us with a good risk vs reward opportunity when taking into consideration both the fundamental and technical analysis. Fundamentally, Teledoc is a giant in the tele health sector and with the future moving towards online, It would not be surprising to see Teledoc trade at much higher prices in the near future. - HH
* This is not financial advice, just an opportunity we want to share.

This trade was sickTDOC has gone from a range reversal trade to a potential breakout. I am very happy holding for now but I am watching how price reacts to the top end of the range. As long as price can hold above 220 the trend is still positive even if there is a little profit taking to come.


TDOC -- looking for long entryReached the fist price target of $125 and pushed higher into the $130s which was great to tag some fib extension levels.
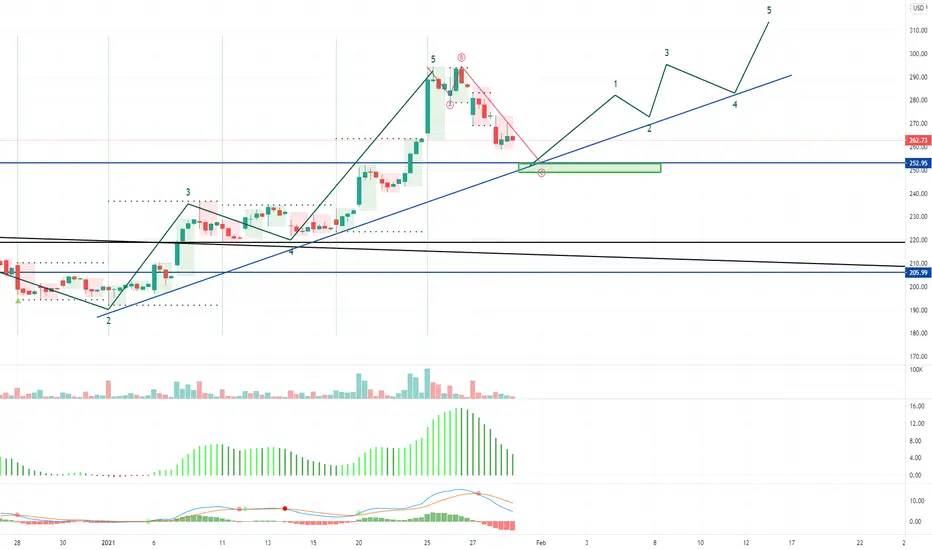
I have two alternate counts on this one because, with EW, it's never an exact science and the best thing to do for yourself is just try to prepare so there are not any surprises and adjust as you go.
Primary Count (White numbers in circles):
- reaching the 1.618 extension for wave 3, looks like we are in a wave 4 retrace.
- Watching my little blue line sitting at the $219 price point: BELOW this I think we can tag $214 area right around the white uptrend line.
- Watching the green dash line I have: above this (specifically, as long as price closes above this) I'll maintain my bullish leaning
Alt Count (Pink numbers in circles):
- would potentially show a complete 5 wave count up, indicating this retrace is wave 2 down. What makes sense with this one is it would go back and backtest the downtrend break out from earlier.
- Watching what happens around the $219 price and the white trend line; if we go below $219 and the white trend fails, then I will watch for price to go down between $213 and $207, indicating a full wave 2 retrace for the pink count
Gameplan:
- watching for entry: if blue line at $219 holds, could indicate start of white count wave 5 up
- if price goes below $219, will look for entry long at the support white trend line
Ultimate price target up is still around the $250 area! I think TDOC has a decent set up here to push upwards and I'll be looking to enter long positions. Premiums, as of right now, are relatively low for options. Plan is to grab some calls or call debit spreads about 45+ days out!


TDOC potential long playGoing to watch this and see what unfolds. If I can get it, I'm hoping for a very slight pull back and for it to hold in the grey support/demand box. If it holds there, I think it has odds in its favor to try and make a pretty nice run up.
If able to find a good entry, my first target up will be around $225. My second target upwards will be the $250 price area.
TDOC options premiums aren't too bad, so hoping volatility stays or drops a bit more. I'll look to enter a call debit spread on this play going about 45 days out to give it some time. If we can get above $213 and find support above the downtrend line it is currently under, I think that could be viewed as very bullish and hopefully trigger more buyers to jump on board.

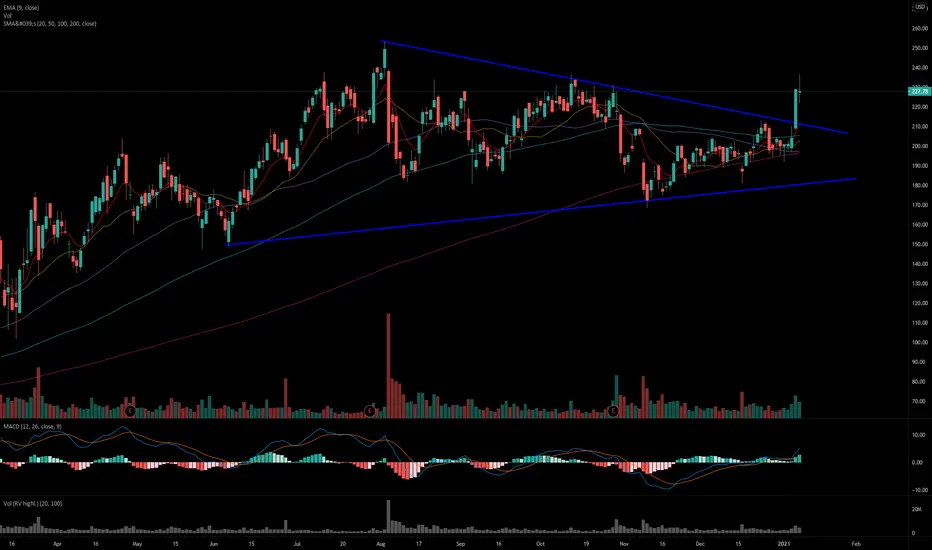
TDOC: LONG SET UP FORMING, BE PREPAREDTDOC is setting up nicely for a break of the wedge/pennant.
A long position could be taken if we break and stay above 209 for a day.
Immediate targets are on the chart.
Trade safe.

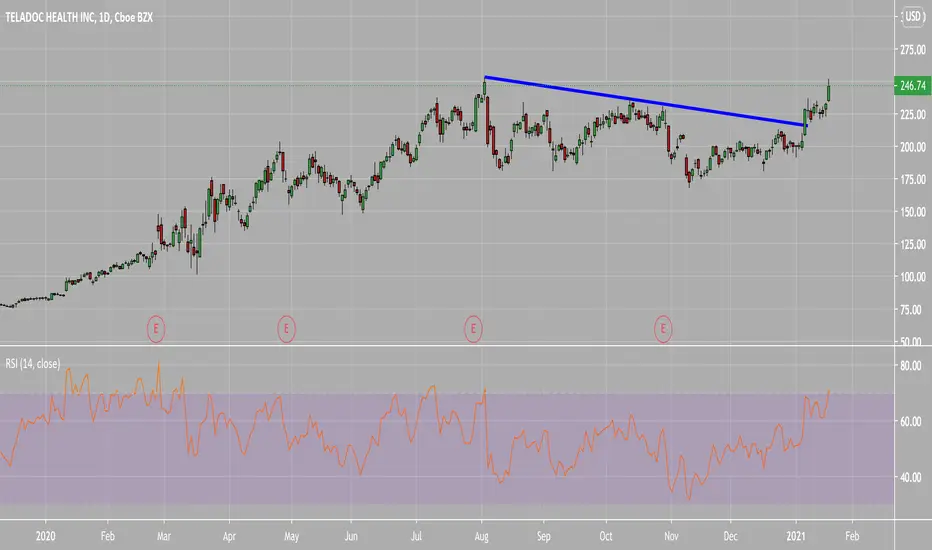
TDOC Fib levels and possible breakoutAfter a prolonged multimonth consolidation TDOC is set up for a breakout. I'm looking for volume and price action above the trendline.
Best of luck!
-iZen

CloudMD (DOC) about to break out.I checked the fib retracements and @tsx_trader is bang on. Its forming a falling wedge and consolidating right into the zone and the momentum is turning around. It could bounce/consolidate around 2.38 and head back down to the 2 support level and make another run. That would be an optional place to scale in additional funds. with a SL at 1.90 the risk/reward is quite attractive.
The reasons why i think it won't bounce off 2.38 is because of the tailwind it has from the stay at home stocks. As the numbers climb they're coming back into favour and this is the canadian version. Expect it to break through 2.38 on the first attempt and the falling wedge and fib retracement levels (2.38, 2.59, 2.75, 2.91, 3.13, 3.41) will become support if it pulls back at all.
Any retracement back to any of those levels confirms the pattern on the first bounce off and that can serve as a place to scale in a final time.
Of course it could rip pretty quick at the same time with no real bounces to load up but one of the above scenarios is very likely. I'm 75% confident on this one, but that confidence would increase to 85% if it bounces off $2 one more time to fill up the wedge.
*edit*One final thing, the 13/30 (hourly) just crossed over today so this is one more thing playing in its favor to plow through that wedge. So my confirmation bias is at an all time high.

Buy Signal: 187.07 #stocksIngenuity Trading Model
Geometric Markov Model : In probability theory, a Markov model is a stochastic model used to predict randomly changing systems. Markov Models are used in all aspects of life from Google search to daily weather forecast. The randomly changing systems we focus on are the equity, futures, and forex markets. The geometric element of the model is the fractal wave structure you can find on any chart you look at across any market and across all time dimensions.
Our model focuses on the current wave formation (current state)- geometric price formation along with its volume and volatility over a given time period and using that information to predict the future state- future price movement.

Tdoc Breaish Wait for Tdic retest trendline around 195- 197 and entry Short ( stop loss if Break above 198.5 )
Target 180 - 165 - 163 .

DOCU pitchfork pattern analysisThe price will likely go up towards the point where 2 pitchfork lines intersect (see the blue arrow--there are two possibilities).
"Like it" if you like it! Add your comments, questions or concerns if you have any.
DISCLAIMER: Security trading involves substantial risk of loss. My analysis is not trading advice. Do your own research first and/or consult a financial advisor. I'm not responsible for any losses you may incur following my analysis.
