What the Market Is Actually Doing Right NowBitcoin continues to trade inside a clearly defined horizontal range, and the latest 1H price action reinforces that this market is still in distribution–accumulation rotation rather than trend continuation.
Price is currently reacting just below the $90,000–$90,500 resistance zone, an area that has repeatedly capped upside attempts over the past sessions. Every impulsive move into this zone has been met with immediate rejection, indicating that sell-side liquidity remains heavy and that larger players are using this level to offload positions rather than chase breakout momentum. Importantly, these rejections are occurring without follow-through volume, confirming the absence of strong bullish commitment.
On the downside , Bitcoin continues to respect the $86,500–$86,000 support zone , with a deeper strong support area around $85,200–$85,500 . Each rotation lower into these zones has attracted responsive buying, but notably buyers are not pushing price to new highs, only back toward range highs. This behavior confirms a mean-reversion environment , where price oscillates between liquidity pools instead of forming a directional trend.
Structurally, Bitcoin is printing lower highs within the range, while lows remain defended. This creates internal compression and signals that the market is waiting for a catalyst. Until either side of the range breaks decisively, both bullish and bearish narratives remain incomplete. A clean hourly and daily close above $90,500 would invalidate the range and open the path toward higher continuation targets. Conversely, a break and acceptance below $85,200 would expose downside expansion toward lower demand zones.
From a macro perspective, this consolidation aligns with the broader market context. Risk assets are currently lacking fresh drivers as Federal Reserve rate-cut expectations remain uncertain , and liquidity conditions are stable but not accelerating. Without a strong shift in macro liquidity or a surge in institutional inflows, Bitcoin is behaving exactly as expected rotating, absorbing orders, and building a larger move.
In summary, Bitcoin remains neutral and range-bound , not weak, but not ready for sustained upside yet. Traders should respect the range, remain patient, and avoid chasing moves in the middle. The real opportunity will come only after a confirmed breakout , not before.
Technical_analysis

Gold Isn’t Topping — This Is a PauseGOLD (XAUUSD) – H1
Technical Structure + Macro Context
1. Price Action & Structure
Gold just delivered a strong impulsive breakout, accelerating vertically from the 4,35xx base.
Current price action is consolidating just below the recent high, not rejecting.
This behavior = bullish continuation, not distribution.
Key observation:
➡️ Strong moves don’t reverse at the high — they pause, absorb liquidity, then expand.
2. Key Levels on Chart
Immediate Resistance / Pause Zone: ~4,485 – 4,500
Support Zone (Buyers’ Control): ~4,400 – 4,415
Trend Support: Rising impulse trendline remains intact
As long as price holds above 4,400, the bullish structure remains valid.
3. Market Psychology
Sellers failed to push price back below the support zone.
Pullbacks are shallow and corrective, showing weak selling pressure.
Liquidity is being absorbed above former resistance → acceptance at higher prices.
This is a textbook bullish flag / continuation pause.
4. Macro & Financial Drivers
USD Weakness:
Market expectations are shifting toward slower Fed tightening / future easing bias.
Real yields are stabilizing → USD momentum fades.
Safe-Haven & Inflation Hedge Demand:
Ongoing geopolitical uncertainty keeps risk premium priced into gold.
Central bank gold accumulation remains structurally supportive.
Inflation expectations remain sticky → gold retains long-term demand.
➡️ Macro environment continues to favor gold upside, not aggressive selling.
5. Forward Scenarios
Primary Scenario (High Probability):
Short-term pullback into 4,440–4,460
Continuation toward 4,520 → 4,550 zone
Invalidation:
Clean breakdown and acceptance below 4,400 would pause the bullish cycle.
🧠 Final Takeaway
Gold is not overextended it is repricing higher.

Gold’s $3,900 Base May Trigger Rally to Bullish TargetsFrom both a near-term and medium-term horizon, gold appears to have established a clear reversal base around the $3,900 level, indicating that the downside momentum has likely been exhausted and that the market is preparing to advance toward its bullish target levels.

BTC (daily)- The second half of September has shown stronger red candles compared to the green candles in early September, indicating increased downward momentum.
- Based on the descending channel pattern, the price appears to be approximately halfway through its downward movement.
- The price is likely to clear the liquidity zones in Zone 1 and Zone 2 before advancing toward an order block.
- My target is where the lower border of the descending price channel converges with the price zone of the order block.

Bulls and Bears zone for 08-26-2025It seems that traders were taking profit yesterday after Friday's huge move up.
Level to watch: 6452 --- 6454

SusdtS formed a W bottom pattern and broke out of the descending wedge. Now slowly moving towards the major trendline.
First targets 0.4 then 0.6

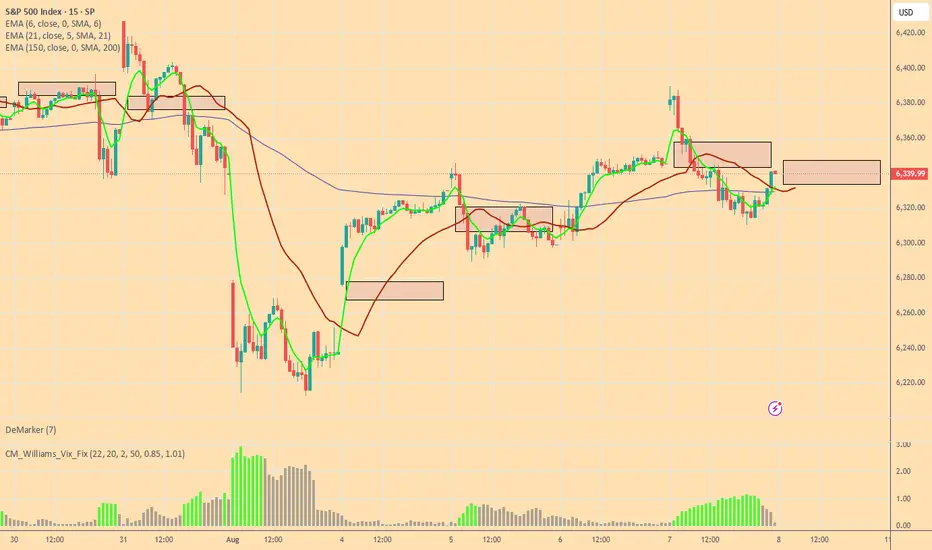
Bulls and Bears zone for 08-08-2025ETH session has rallied to 61.8 Fibonacci level of yesterday's RTH session. Any test of ETH session High could provide direction for the day.
Level to watch: 6384 --- 6386
Bulls and Bears zone for 07-28-2025Last week 4 out of 5 sessions S&P 500 made new ATH. However they were all trading within a tight range.
Level to watch: 6434---6436

Gold - DAILY- 21.07.2025Gold held steady near $3,350 an ounce as markets opened Monday, with traders assessing mixed signals from Federal Reserve officials on the inflation impact of Trump’s tariff plans. Some Fed governors, like Waller and Bowman, signaled openness to rate cuts, while others remain cautious due to inflation risks. Trump continues pressuring the Fed to lower rates, with speculation about replacing Chair Jerome Powell. Meanwhile, EU officials are preparing for potential trade fallout as Trump’s Aug. 1 tariff deadline approaches. Gold is up over 25% this year, driven by geopolitical tensions and demand for safe-haven assets.
From a technical point of view, the price of gold found sufficient support on the 38.2% of the weekly Fibonacci retracement level and is currently testing the resistance on the 50% around $3,355. The moving averages are confirming the overall bullish trend in the market, while at the same time, the Stochastic oscillator is near the extreme overbought level, hinting at a potential bearish correction move in the upcoming sessions. The Bollinger bands are quite expanded, showing that volatility is there to support any short-term move to either side, while the level around $3,380 is the first major technical resistance area consisting of the upper band of the Bollinger bands and the 61.% of the weekly Fibonacci retracement level.
Disclaimer: The opinions in this article are personal to the writer and do not reflect those of Exness

Crude Oil -DAILY- 21.07.2025Oil prices were steady after their first weekly decline this month, as attention shifted to U.S. trade negotiations and the European Union’s push to tighten restrictions on Russian energy exports. The EU is preparing new sanctions, including a lower price cap on Russian crude, limits on fuel refined from Russian oil, banking restrictions, and bans targeting an Indian refinery and Chinese firms. Despite western sanctions, Russian oil continues flowing to China and India. Meanwhile, diesel margins in Europe remain strong, signaling tight supply.
On the technical side, the price of crude oil has failed to break below the major technical support area, which consists of the 50-day simple moving average and the 50% of the weekly Fibonacci retracement level. The Stochastic oscillator has been in the neutral level since last week hinting that there is potential for the price to move to either direction in the near short term. On the other hand, the Bollinger bands have contracted rather massively showing that volatility has dried up therefore, the recent sideways movement might extend in the upcoming sessions.
Disclaimer: The opinions in this article are personal to the writer and do not reflect those of Exness

EURAUD – Bearish Flag Breakdown OpportunityThe EURAUD pair is showing signs of trend continuation via a classic bearish flag pattern formation. After a sharp decline, the market has entered into a tight consolidation channel, climbing steadily inside a sloped flag structure. Price is now testing a critical resistance area near 1.7830–1.7840 while hovering just below the 200 EMA.
This setup offers a high-probability sell opportunity — but only after confirmation.
1. Structure Overview
The initial sharp downtrend is followed by a consolidation channel — a textbook bearish flag.
Price is approaching major resistance (1.7830–1.7840) and 200 EMA, acting as a ceiling.
A breakdown from the rising support of the flag is expected to trigger a continuation toward the downside.
2. Trade Plan – Bearish Flag Breakdown
✅ Entry Plan:
Wait for a breakdown of the green support trendline (flag support).
Then, wait for a re-test of the broken support (now resistance).
Enter short only after a bearish candlestick confirmation (e.g., bearish engulfing or rejection wick) on the 15-min or 1-hour chart.
🛡️ Stop Loss:
Place the stop loss just above the major resistance zone, around 1.7835–1.7840.
🎯 Target Zones:
Target 1 (TG1): 1.7755
Target 2 (TG2): 1.7718
Final Target: 1.7632
Risk/Reward Ratio: 1:2, 1:4, 1:9.4+
3. Why This Trade Makes Sense
Bearish Flag is a reliable continuation pattern in strong downtrends.
Price is failing to break above key resistance and 200 EMA.
The flag offers a tight SL and large downside potential — ideal conditions for R:R setups.
Confluence of structure, pattern, and trend all align for short bias.
4. Trade Management Tips
Scale out partial profits at TG1 and TG2, and trail stop for final target.
If breakdown fails, avoid chasing price — re-evaluate bias if price breaks above 1.7840.
5. Final Thoughts
This EURAUD chart is a textbook case of pattern + price action + resistance confluence. The flag structure is well-defined, and the reward-to-risk ratio is significantly favorable if the breakdown confirms.
📌 Watch for:
Breakdown of rising support
Retest and bearish candle
Entry only on confirmation
High-probability setups don’t require prediction — they require preparation.
=================================================================
Disclosure: I am part of Trade Nation's Influencer program and receive a monthly fee for using their TradingView charts in my analysis.
=================================================================

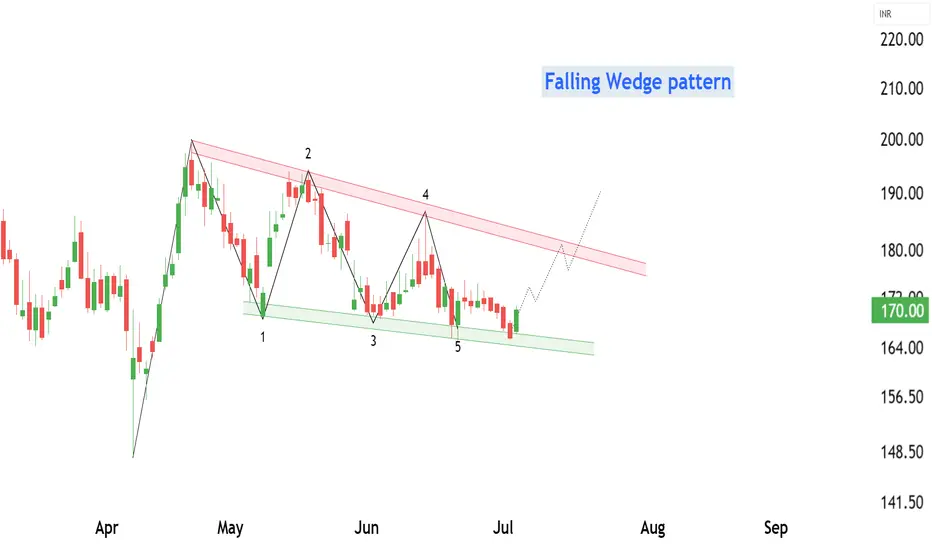
HINDUSTAN OIL EXPLORATION at Best Support !!This is daily chart of HINDUSTAN OIL EXPLORATION .
HINDOILEXP having a good Support zone at 162-165 level.
HINDOILEXP has formed a Falling Wedge Pattern with Support near at 165 level.
If this level is sustain , then we may see higher prices in HINDOILEXP .
Thank You !!
Bulls and Bears Zone for 07-02-2025S&P keeps going higher after new ATH high earlier this week. Markets could go higher for a while if we see any pullback.
Level to watch: 6232 ---6234

RAIN INDUSTRIES ' s Key Support Zone This is the one hour chart of RAIN INDUSTRIES.
Rain Industries is moving within an ascending parallel channel with support around 140 range and resistance around 160 range.
If this level is sustain , then we may see higher prices in the
Rain Industries
Thank You !!

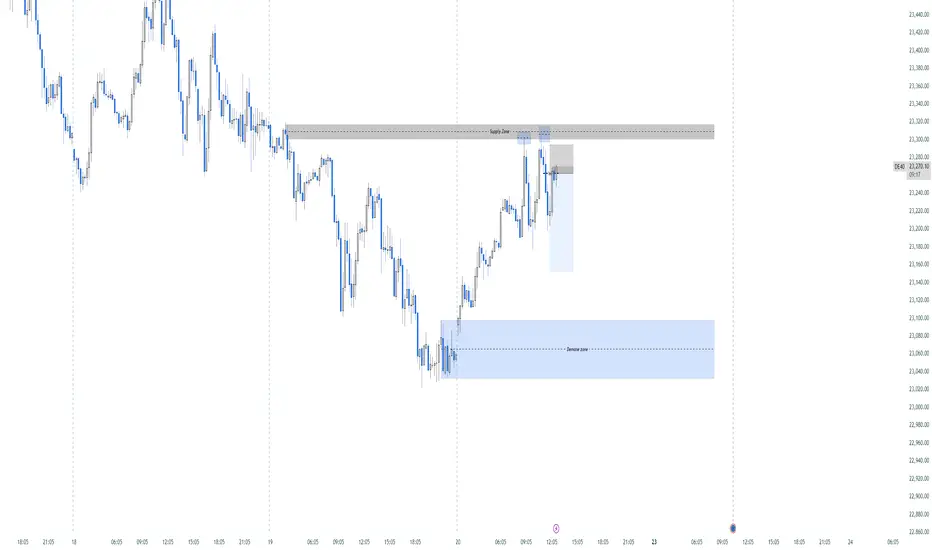
Possible Sell On Dax. Every thing taken into account, dax could shortly see a sell, given that a 1h Supply zone and 5 minute candles were rejected twice.
Bulls and Bears zone for 06-12-2025Overall market is continuing to rally in general.
However, market sold off during ETH session and it's trying to recover in the morning.
Level to watch : 6017----6019

Bulls and Bears zone for 06-03-2025SPX has been trading in a range since mid May. Perhaps a pullback might be in the cards.
Level to watch: 5946 --- 5948
News to Watch:
US Factory Orders 10:00am
US JOLTS 10:00am

Bitcoin is Showing a New Trend!!!Hey Traders, in today's trading session we are monitoring BTC/USDT for a selling opportunity around 95k, Bitcoin is trading in a downtrend and currently is in a correction phase in which it is approaching the trend at 95k support and resistance area.
Trade safe, Joe.

Bulls and Bears zone for 05-01-2025S&P 500 is going to have a gap up Open and finally closing gap from early last month.
Also traders could be taking profit after yesterday's big UP move.
Level to watch: 5643 ---5645
Reports to watch:
US : PMI Manufacturing Final 945am
US : ISM Manufacturing Index 1000am
US : Construction Spending 1000am

#WALUSDT continues its bearish momentum 📢 As long as the price stays under $0.6000 — short BYBIT:WALUSDT.P bias remains valid.
📢 Watch for further weakness!
📉 SHORT BYBIT:WALUSDT.P from $0.5794
🛡 Stop loss: $0.6000
🕒 Timeframe: 1H
✅ Overview:
➡️ The chart shows a clearly formed and broken Bearish Rectangle, confirming a short setup after price exited the range to the downside.
➡️ The $0.6090 support level has turned into strong resistance.
➡️ Entry at $0.5794 follows a textbook breakdown and retest structure.
➡️ Target area aligns with the volume-based support near POC $0.515, offering solid R:R.
🎯 TP Targets:
💎 TP 1: $0.5725
💎 TP 2: $0.5665
💎 TP 3: $0.5600
📢 Bearish structure confirmed with increased volume.
🚀 BYBIT:WALUSDT.P continues its bearish momentum — downside potential remains active!

Bulls and Bears zone for 04-16-2025Earlier this week S&P 500 has formed a Death Cross which could be significant or not only time will tell.
Any test of yesterday's Close could provide direction for the day.
Level to watch: 5354 --- 5356
Reports to watch:
U.S. Housing Market Index at 10:00AM EST
U.S. Jerome Powell Speaks at 1:30PM EST

Rising Wedge for #BTCUSDTWhat’s visible on the BYBIT:BTCUSDT.P chart:
📈 Rising Wedge:
➡️ This is a potentially bearish pattern for BYBIT:BTCUSDT.P , especially when it appears after a strong rally following a deep drop (which is exactly the case here).
➡️ The price has almost reached the upper boundary of the wedge and has already formed a second top (Top 2) — a signal of possible weakness.
🔵 Levels:
➡️ POC BYBIT:BTCUSDT.P — $82,490.8 has already been broken to the upside, indicating current market strength.
➡️ The price is approaching major resistance at $83,807.1 — momentum is already slowing down in this zone.
➡️ Support remains in the $80,449.7 – $78,412.7 area.
📊 Volume:
➡️ The rally was supported by high volume, but the most recent candles show declining volume as the price nears the top of the wedge.
➡️ This could indicate weakening buying pressure.
📉 Why it’s important to be cautious with long positions:
➡️ A rising wedge can act as a bull trap.
➡️ The price is near a critical resistance — even a small pullback could lead to a wedge breakdown.
➡️ After such a steep run (from 73K to almost 84K), the chance of profit-taking and a pullback is high.
➡️ Volume is declining — bullish momentum may be fading.
📢 Conclusion:
➡️ Opening a BYBIT:BTCUSDT.P long position right now is risky because:
- the wedge structure suggests a potential reversal to the downside;
- there’s no breakout above the previous high with confirmation;
- and volume does not support further upward movement.
❗️ It's better to watch how the price reacts to the wedge and BYBIT:BTCUSDT.P key levels — a long entry is only valid if the price breaks and holds above $83,800–84,000 with strong volume.
➡️ Until then, a neutral or cautiously bearish position is more appropriate.

WHY NZDUSD BULLISH ?? DETAILED TECHNICALS AND FUNDAMENTALSNZDUSD has just completed a clean technical retest at a key demand zone around the 0.5560–0.5600 region and is now showing signs of a strong bullish reversal. The recent structure formed a classic “V-shape” recovery, and price is holding firmly above the psychological level of 0.5700. The market has now reset its lower time frame structure and is preparing for a potential bullish continuation toward the 0.6100 target zone in the coming sessions.
Technically, the pair respected its support zone perfectly after a sharp corrective move from the March highs. The retest confirms previous support turned demand, with the 12H chart indicating a potential bullish breakout setup. With the rejection wicks and impulsive bullish engulfing candle seen in the latest session, the momentum has clearly shifted back in favor of the bulls. I'm eyeing a steady climb toward the 0.6000–0.6100 range, especially if we break above the 0.5800 resistance level decisively.
On the fundamental side, the US dollar is showing signs of exhaustion ahead of key inflation data. Market sentiment is slightly dovish on the Fed’s rate trajectory due to softening labor data and a cooling services sector, while New Zealand is holding a relatively steady economic outlook. Although RBNZ remains cautious, commodity demand and improving risk sentiment are currently supporting the Kiwi. Traders are pricing in reduced rate hike expectations from the Fed, which gives NZD a comparative edge in short to mid-term flows.
With positive technical confluence, shifting fundamentals, and improving global risk appetite, NZDUSD looks poised for a solid upside run. As long as the price stays above 0.5600, I remain bullish. A break above 0.5800 could act as the catalyst for acceleration toward 0.6100, providing a favorable risk-reward opportunity in the current market conditions.
