GOLD|When the market loses balance, dominance leaves a footprint🔍 Market Context
After establishing a short-term peak in the 4,385 – 4,372 USD range, gold has entered a phase of strong technical correction , with consecutive red candles breaking the short-term upward structure.
The sellers temporarily dominate, pushing the price through the H1 upward trendline. However, the support zone below (Liquidity Zone + Order Block Bullish) is beginning to show absorption force, indicating the possibility that buyers might return at discounted price levels.
💎 Technical Analysis
Previous Bullish BoS: confirms the main trend is still long-term bullish .
FVG Down Zone: 4,285 – 4,260 USD → an unfilled price balance area during the decline, potentially a place for price to retrace to “fill the gap” before choosing a direction.
Liquidity Zone $$$: 4,222 – 4,218 USD → a short-term support area where new buying liquidity appears.
Order Block Bullish: 4,203 – 4,185 USD → a confluence area between OB and Fibo 0.786, where large capital might return.
Deep Bullish OB: 4,142 – 4,128 USD → the final defense zone for the main upward trend.
Order Block Bearish: 4,372 – 4,385 USD → a critical resistance area, likely to react if the price retraces.
The current structure shows gold is in a retracement – liquidity rebalancing phase, lacking sufficient signals to reverse the trend.
📈 Trading Scenarios
1️⃣ Main Scenario – Buy reaction at Liquidity Zone 4,222 – 4,203 USD
Entry: 4,222 – 4,203
SL: 4,185
TP: 4,260 → 4,318 → 4,372
✅ Condition: Strong rejection candles (rejection / engulfing bullish) appear at the support zone or small reversal BoS.
➡️ This is a “buy the dip” setup following the main trend, leveraging the liquidity zone and confluence OB.
2️⃣ Secondary Scenario – Sell reaction at FVG Down 4,285 – 4,260 USD
Entry: 4,260 – 4,285
SL: 4,300
TP: 4,222 → 4,203
✅ Condition: Strong bearish candles or rejection signals appear at the FVG zone.
➡️ This setup is for scalping traders or short-term shorts in the unfilled price balance area.
⚠️ Risk Management
Do not FOMO buy when the price has not confirmed the 4,222 zone.
If the price breaks below 4,185 → wait for a re-test to continue selling towards the 4,128 zone.
Maintain moderate volume, as the market is in a rebalancing phase – liquidity is still noisy.
💬 Conclusion
Gold is in a transitional phase after a strong decline .
The 4,222 – 4,203 USD zone will be key to determining whether the medium-term upward trend continues.
If this zone holds, gold is likely to retest the 4,318 – 4,372 USD range.
👉 Reasonable Strategy:
Buy reaction at 4,222 – 4,203 USD when confirmed.
Sell technically at FVG 4,260 – 4,285 USD if clear rejection appears.
🔥 “When the market loses balance, the strongest side will leave a trace – and this time the trace lies around the 4,220 USD zone.”
Technicalindicators

The 3 KEYS to Trading SUCCESSToday we will discuss about the 3 Keys I believe are required for succeeding in trading.
When you enter into the trading field, you quickly understand that it’s not just about charts and setups — it’s about mastering yourself mentally.
There are 3 keys that separate those who last from those who don’t in Trading:
( 1 ) Psychology
( 2 ) Risk Management
( 3 ) Consistency
Every single one is equally important, but how you balance them determines your long-term outcome when trading.
1 ) Psychology — Master Your Mind Before You Master the Market
Trading, the mental game disguised as a financial one displaying 1s and 0s winners and losers. The market, the charts, the currency, they do not care who you are, what you think, or how badly you want to win.
It simply exposes your strengths and weaknesses in the world of psychology .
Most traders lose, this is not because they lack knowledge, but because they cannot control their emotions, feelings — fear of losing, fear of missing out, greed after a win, hesitation after a loss, anxiety, frustration, impatience.
Every emotional outburst leads to poor decision-making: closing early, revenge trading, over-leveraging, or ignoring your plan, right after you told yourself you were going to lock in and turn $100 into $1000000.
To master psychology:
( 1 ) Detach from the outcomes/end-result. Focus on executing well, not whether a trade wins or loses. Follow your plan.
( 2 ) Think of probability. Every setup, every trade must have an edge — not a guarantee.
( 3 ) Accept losses as part of the process. Losses are tuition fees in this business. Every loss is a win, because there is a lesson to be learned.
( 4 ) Stay grounded. Journaling, mindfulness, and post-trade reflection go a long way. Keep track of trades and review them during down time.
When your mindset stabilizes, when your thoughts are calm, your trading skills become consistent. The charts don’t change — you do.
In terms of training your mindset, see my previous post below which explains the difference between a Trader and Gambler. This is an excellent article for those who want to BECOME a trader.
2. Risk Management — Protect Before You Profit
If psychology keeps your calm, risk management keeps you alive.
This is the part most traders skip — until they learn the hard way and blow their own capital, or 10 fundeds in a row.
Your number one job as a trader is not to make money. It’s to protect capital so you can focus on staying in the game long enough for your strategy and edge to play out well.
Practical risk rules:
( 1 ) Never risk more than 1–2% of your capital on a single trade. (If you do, you increase the emotions of greed)
( 2 ) Always know your max loss before entering — no guessing, if you do not? Your loss, your fault.
( 3 ) Use stop-losses logically, not emotionally. Set them at resistances or supports. Key levels.
( 4 ) Avoid over-leveraging. Leverage magnifies both wins and mistakes. Higher the leverage, higher the risk.
( 5 ) Don’t chase. Missed trades are better than blown accounts. Record them down and log emotions.
Good risk management doesn’t make you rich overnight — but poor risk management will make you broke instantly .
You don’t need huge wins to grow; you just need small, controlled losses and consistent execution throughout your trading journey.
3. Consistency — Discipline Over Drama
Consistency is the glue that holds everything together, risk management to Psychology.
It’s easy to stick to your plan for a week; but it is hard to do it for months without deviation and drifts. But that’s exactly what separates traders who make it from those who burn out.
Consistency means:
( 1 ) Showing up daily, sticking to a fixed plan of study, back testing, assessing.
( 2 ) Following your trading plan with discipline.
( 3 ) Reviewing your trades honestly — both wins and losses. (Are YOU doing THIS?)
( 4 ) Avoiding impulsive changes just because of one bad day. Take a break if the loss affects you badly.
Progress in trading is slow and often invisible. You might not notice improvements week to week but look back after six months of focused consistency — and you’ll realize how far you have come. Remember, slow and steady wins the race. This is a game of Tortoise v Rabbit. Push fast and hard and you will make mistakes – be slow and steady and you will win the race.
Stepping back to view the bigger picture
Trading success isn’t luck — it’s the result of compound discipline, calculated trades and timing.
( 1 ) Psychology gives you control.
( 2 ) Risk management gives you longevity.
( 3 ) Consistency gives you results.
When you align all three, everything starts to click.
You don’t need to master the market — just master your mindset, your risk, and your routine . The profits follow naturally.
Thank you all so much for Reading. I hope this post becomes beneficial to you!

– Bullish Reversal Expected from Buy Zone Toward 1.1729 TargetEUR/USD Technical Analysis (15-Minute Timeframe)
Current Price: 1.1644
Market Structure:
The price is moving inside a descending channel, defined by two parallel trade lines (upper resistance and lower support).
A BUY ZONE is marked between 1.1635 – 1.1645, which aligns with a previous demand area.
The market is currently testing the lower boundary of this channel, suggesting potential buying interest.
🔍 Market Outlook
The recent downtrend appears to be a corrective phase following a previous bullish impulse.
The BUY ZONE represents a strong demand area, where buyers may step in.
A breakout above the upper trade line would likely confirm bullish momentum and a potential trend reversal.
🎯 Trade Setup Idea
Buy Entry Zone: 1.1635 – 1.1645
Confirmation: Bullish breakout and candle close above the descending trendline
Target: 1.1729 (as indicated on the chart)
Stop Loss: Below 1.1610 (below previous low and demand zone)
⚠️ Trading Notes
Wait for a clear breakout candle above the upper trade line to confirm buyer strength.
A close below 1.1630 would invalidate the short-term bullish setup.
Watch momentum and volume to confirm the breakout’s validity — weak momentum may lead to a false breakout. FX:GBPUSD FX:USDJPY OANDA:GBPJPY OANDA:AUDUSD OANDA:USDCAD OANDA:USDCHF OANDA:NZDUSD OANDA:EURGBP OANDA:GBPJPY OANDA:EURNZD

Gold Plan | Where will gold drop today?🔍 Market Context
Gold continues to maintain a short-term upward trend following a series of Break of Structure (BoS) , confirming active buying from lower zones.
Currently, the price is approaching the ATH GOLD zone and heading towards the Liquidity Sell Zone 4,281 USD – a densely liquid area where short-term sell reactions from major players may occur.
After a hot rise, technical correction risks are starting to increase. Lower zones like 4,186 – 4,152 – 4,130 USD will be potential “accumulation zones” for institutional buyers in the upcoming pullback.
💎 Technical Analysis
ATH GOLD: 4,275 – 4,280 USD
Liquidity Sell Zone: 4,281 – 4,285 USD → high liquidity resistance area, may trigger short-term reversal reactions.
Liquidity Zone $$$: 4,186 – 4,152 USD → crucial support area in the uptrend, where technical reactions are expected.
FVG – BoS Zone: 4,152 – 4,148 USD → “price balance” zone yet to be filled, likely to be retested.
OB Deep Zone: 4,130 – 4,120 USD → deep demand zone converging with Fibo 0.786 – ideal area for large capital to re-accumulate.
Overall structure remains bullish , but in the premium zone – an area where institutions typically distribute orders to gain liquidity before adjusting.
📈 Trading Scenarios
1️⃣ Main Scenario – Sell reaction at Liquidity Zone 4,281 USD
When the price hits the 4,275 – 4,281 USD zone and clear reversal signals appear (rejection candles, bearish engulfing, or minor structure break),
→ open short-term sell orders (scalp/intraday).
Target: 4,186 → 4,152 USD.
Stop Loss: above 4,285 USD.
➡️ This is a typical “liquidity sweep – technical reaction” scenario, capitalising on short-term sell-offs at high liquidity peaks.
2️⃣ Secondary Scenario – Buy back following the main trend after correction
When the price corrects to the 4,186 – 4,152 USD zone or deeper to OB Deep 4,130 USD ,
and clear upward confirmation signals appear (strong rejection or minor BoS increasing again),
→ open buy orders in line with the main trend.
Target: 4,230 → 4,275 USD.
Stop Loss: below 4,120 USD.
➡️ Trend-following scenario – waiting for price correction to discount zones to accumulate in line with the larger trend.
⚠️ Risk Management
Do not FOMO buy when the price is hitting the 4,275 – 4,281 USD zone.
Prioritise short-term sells with clear confirmations or buys at lower OB zones.
Keep light volume when trading against the main trend.
Observe reactions at the 4,186 zone – this is the key level of the day.
💬 Conclusion
Gold is at the peak of the current rise , short-term profit-taking pressure may appear around the 4,281 USD zone.
If strong reactions occur, a correction to the 4,186 – 4,152 USD zone is reasonable for market rebalancing.
The larger trend remains upward , so lower OB zones will be reasonable buy opportunities for the next wave.
👉 Reasonable Strategy:
Sell reaction at 4,281 USD when reversal signals appear.
Buy back at 4,186 – 4,152 – 4,130 USD when confirmation signals appear.

XAU/USD – Buyers Reclaim Structure, Targeting Liquidity Zone🔍 Market Context
After a strong Liquidity Sweep yesterday, gold has rebounded and formed consecutive Break of Structure (BoS) , confirming buyers are back in control.
The price has now filled the Fair Value Gap (FVG 4,191 – 4,202) and is heading towards the Sell Liquidity Zone 4,237 – 4,240 USD — where many sell orders and stop-losses from previous short positions are concentrated.
The current structure indicates strong upward momentum , however, the possibility of a pullback from this high liquidity area is noteworthy.
💎 Technical Analysis
Liquidity Sweep: Completed, clearing liquidity below 4,070.
FVG (Fair Value Gap): 4,191 – 4,202 → filled, confirming price balance.
Sell Liquidity Zone: 4,237 – 4,240 → potential resistance area, likely strong reaction.
OB Zone | Buy: 4,143 – 4,145 → nearby support, expected first reaction on price pullback.
OB Deep | Buy: 4,110 – 4,115 → deep demand zone, confluence with Premium Zone 4,156 – 4,118.
Overall Structure: The main trend remains bullish , with strong upward momentum but requires technical pullback for re-accumulation.
📈 Trading Scenarios
1️⃣ Main Scenario – Sell reaction at liquidity zone
When the price approaches the Sell Liquidity Zone 4,237 – 4,240 USD , observe candle reactions (rejection, bearish engulfing).
If confirmation signals appear, open short-term sell orders .
Target: OB Buy Zone 4,145 → 4,110 USD.
Stop Loss: above 4,245 USD.
➡️ This is a liquidity reaction setup, high probability when the market encounters resistance confluence with Fibonacci zone 0.786–1.0.
2️⃣ Alternative Scenario – Buy with trend from OB
If the price pulls back to the OB Zone 4,143 – 4,145 USD and shows clear reaction (strong rejection or minor structure break),
→ consider opening buy orders with the main trend .
Target: return to 4,200 → 4,235 USD.
Stop Loss: below 4,130 USD.
If the price drops further, the OB Deep Buy 4,110 – 4,115 USD will be the final “liquidity draw” zone for a new upward bounce.
⚠️ Risk Management
Avoid FOMO buying at 4,200+ as it is near the liquidity resistance zone.
Prioritize short-term selling at 4,237 if clear signals are present.
When price pulls back to OB, wait for reaction before buying, do not bottom-fish early.
💬 Conclusion
After completing the liquidity sweep, gold has confirmed a return to bullish structure with multiple consecutive BoS.
Currently, the price is nearing the liquidity zone 4,237 USD – a short-term pullback is highly likely.
The 4,145 – 4,110 USD area will be where buyers await reaction to accumulate orders and continue the medium-term uptrend.
👉 Reasonable Strategy:
Short sell at 4,237 USD if reversal signals appear.
Wait to buy at OB zone 4,145 – 4,110 USD when clear reaction occurs.

XAUUSD | m15 frame gold drops sharply by 50 points ? 🔍 Market Context
Gold prices have just set a historical peak (ATH GOLD) around the 4,180 USD region, following a steep upward trend over multiple sessions.
Immediately after, the market witnessed the first break of upward structure (BoS) – a sign indicating that bullish momentum is weakening .
Currently, prices are returning to fill the Fair Value Gap (FVG) at 4,125 – 4,145 USD , which is likely a liquidity rebalancing phase before prices choose the next direction.
💎 Technical Analysis
ATH GOLD: 4,180 – 4,185 USD
Fair Value Gap (FVG): 4,125 – 4,145 USD → an empty price area that needs to be filled.
Order Block Buy Zone 1: 4,050 – 4,060 USD → the nearest demand zone, potentially creating the first technical reaction.
Order Block Buy Zone 2: 3,980 – 3,985 USD → a deep demand zone with large liquidity confluence, likely to become the main "accumulation point."
Overall Structure: After breaking the upward channel, the market is in a retracement phase – the medium-term structure remains bullish .
📈 Trading Scenarios
1️⃣ Short-term Sell Scenario – filling FVG and technical adjustment
If prices continue to test the FVG 4,125 – 4,145 USD region without breaking through,
→ consider a short-term sell to catch the technical retracement phase.
Target: the first OB Buy Zone 4,050 USD .
Stop Loss: above 4,155 USD (to avoid being swept above the FVG peak).
➡️ This scenario is suitable for short-term traders following corrective waves – only enter when there is a clear reversal candle confirmation.
2️⃣ Trend-following Buy Scenario – catching the rebound from OB Zone
If prices adjust to the 4,050 – 4,060 USD region, observe reaction signals such as Bullish Engulfing or strong Rejection .
Upon confirmation, open a trend-following buy order .
Target: the 4,125 → 4,145 USD region or the old peak of 4,180 USD.
Stop Loss: below 4,030 USD.
If the first OB zone doesn't hold, the 3,980 – 3,985 USD area will be an ideal zone for long-term "accumulation."
⚠️ Risk Management
Avoid FOMO buying at high prices when the FVG is not yet filled.
Prioritize trading at clear reaction zones (OB, FVG edge).
Reduce volume when entering counter-trend orders to preserve capital.
💬 Conclusion
After a steep rise, gold is entering a value rebalancing phase .
The current market structure leans towards a short-term technical retracement before continuing the main upward trend.
If the 4,050 – 4,060 USD region reacts well, gold may soon rebound and aim for the 4,150 – 4,180 USD region.
👉 Reasonable Strategy:
Short-term sell when prices react at FVG.
Wait to buy at OB Buy Zone when there is a confirmed upward signal.

XAUUSD – Liquidity Sweep “Dip”XAUUSD – Liquidity Sweep “Dip”; prioritize trading around key zones 🟡
Gold just dropped nearly 90 points during the Asian session—a time usually lacking volume, causing a “flush” that wiped out many leveraged positions. The major trend remains upward, but short-term risks of a deep pullback appear before the European–American markets engage.
The accompanying image shows:
Price peaked and then broke the upper edge of the H1 rising channel → quickly fell to the middle of the channel.
Thick Volume Profile cluster near 4.07x, POC ~4,075; below is VAL ~4,025.
Sell retest zone marked around 4.14x; gray boxes are buy zones 4,075 and 4,056.
Key Levels
Resistance: 4,143–4,150, 4,122, 4,160.
Support: 4,075 (POC), 4,056 (buy scalping), 4,025 (VAL).
Scalping watch: 4,057 – 4,085 – 4,160 – 4,025.
Trading Scenarios
SELL retest (reaction, higher risk)
Entry: 4,143
SL: 4,150
TP: 4,122 → 4,105 → 4,078 → 4,050
Idea: only trigger when there is a clear rejection at 4.14x (long wick/engulfing H1).
BUY around POC
Entry: 4,075
SL: 4,067
TP: 4,089 → 4,100 → 4,122 → 4,155
BUY scalping (shallow pullback)
Entry: 4,056
SL: 4,049–4,050
TP: 4,075 → 4,089
Invalidation: short-term buy bias weakens if H1 closes below ~4,025 (VAL). If this area breaks, prioritize waiting for a failed retest to consider selling along the continued decline.
Practical Notes
The range is very wide; the European session will increase volume, making false breaks likely.
After TP1, move SL to entry to secure the position.
Sell orders are only reactive trades at 4.14x; prioritize buy-the-dip at 4,075/4,056 when confirmation signals appear.

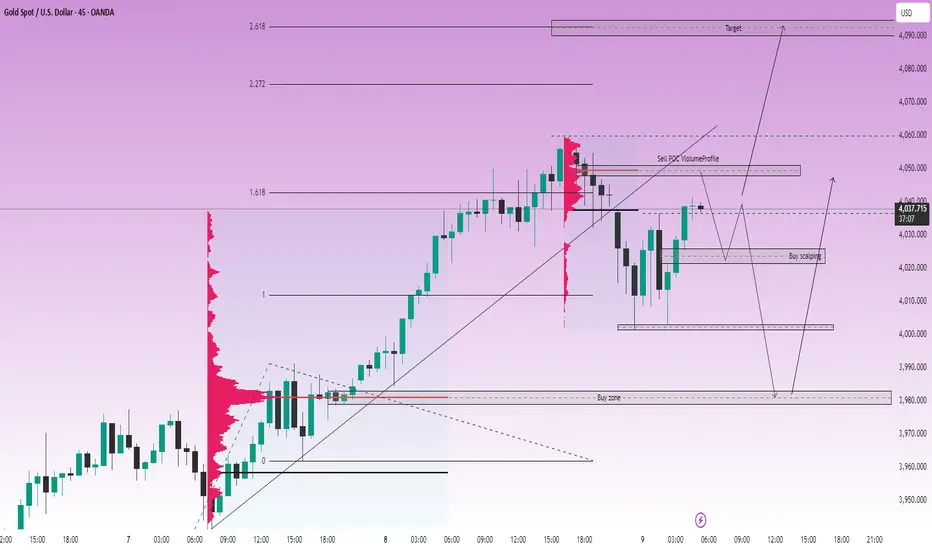
GOLD: The upward structure continues, target 4090 is approachingLiamTrading – GOLD: The upward structure continues, target 4090 is approaching
Hello everyone,
Gold and US stocks are setting new records, but don't forget — strong sell-offs often occur when everyone believes prices can only go up.
Currently, gold maintains a sustainable upward structure, with each subsequent low higher than the previous one, confirming a clear trend on the H1–H4 frames.
📊 Technical Analysis (Chart 45m – XAUUSD)
The price structure remains clearly Higher High – Higher Low, indicating that buyers still control the market.
Key liquidity zones are around:
🔹 4050–4060 (resistance – POC Volume Profile)
🔹 4020–4025 (temporary support zone – confluence Fibo 0.618)
🔹 3980 (technical bottom, strong previous liquidity zone)
The upward target according to Fibonacci Extension is currently in the 4090 zone, corresponding to the 2.618 extension level — likely to become a major profit-taking area for buyers.
🎯 Today's Trading Scenario
Short-term Sell (based on resistance reaction):
📍 4048–4050
🛑 SL: 4055
🎯 TP: 4030 – 4018 – 4005 – 3980
Buy scalping:
📍 4022–4024
🛑 SL: 4017
🎯 TP: 4030 – 4045 – 4060 – 4080
Buy swing (trend-following):
📍 3980–3982
🛑 SL: 3975
🎯 TP: 3995 – 4010 – 4025 – 4040 – 4060
🧭 Fundamental & Market Sentiment
According to the FOMC minutes from 16–17/9, most Fed officials believe that continuing to cut interest rates this year is appropriate.
This is the first time since 2020 that the Fed has officially reduced the interest rate by 0.25%, bringing the range down to 4.75% – 5.00%.
→ Cheap money + safe haven sentiment continues to be the main driver pushing gold higher.
However, with both gold and stocks reaching peaks, the risk of technical correction may occur when prices hit major liquidity zones.
📌 Conclusion
Gold is still in a stable upward trend, with a short-term target towards 4090 USD/oz.
However, watch for liquidity zones around 4050–4060 and 4000–4025 to optimize entry points, avoiding FOMO when prices are already high.
👉 I will continue to update details each trading session.
Follow me to not miss the earliest gold scenarios!
Gold FOMO Surge – 1000-Pip Buy Chance Ahead!GOLD PLAN FOR 06.10 | Captain Vincent
✳️ Hello to all traders,
Today, we are not only analyzing Gold (XAU/USD) from a purely technical perspective ⚙️, but also witnessing the perfect confluence between technicals and fundamental news. A price surge storm is forming, promising exciting trading opportunities.
📊 1. Technical Analysis: Sustainable Uptrend Structure
Technically, the uptrend of Gold on the H1 frame is indisputable.
🔹 Break of Structure (BoS):
Gold continuously breaks previous highs, indicating that buying pressure is completely overwhelming.
Each BoS point is a clear affirmation of the strength of the uptrend.
🔹 Potential Demand Zone:
After each surge, the price often takes a "rest" to accumulate.
Currently, the price may adjust to the $3,883,020 - $3,905,169 zone, where the confluence between the Fair Value Gap (FVG) and Bullish Order Block (Bullish OB) – creates an ideal launchpad for the next surge.
🏦 2. Fundamental Analysis: The Fire Has Been Ignited
If technicals show the way, then fundamental news is the fuel propelling the uptrend.
🔸 U.S. Government Shutdown:
This event creates political and economic instability, causing capital to flee from risky assets.
Gold – the number 1 safe haven – is directly benefiting as investors seek to preserve assets.
🔸 Fed Ready to Cut Interest Rates:
The market is almost certain that the Fed will cut interest rates by 0.25%.
This reduces the appeal of the USD, further strengthening Gold's advantage, which is a non-interest-bearing asset.
🔸 "Thirst" for Economic Data:
The government shutdown also disrupts the release of important economic data, leaving the market lacking information and increasing uncertainty.
In this environment, Gold continues to maintain its role as a safe haven.
🎯 3. Comprehensive Trading Plan
When technicals and fundamentals align, the reliability of the trading strategy is significantly enhanced.
Strategy:
Wait to buy (Long) when the price adjusts to the demand zone $3,883,020 - $3,905,169.
Entry signals:
Observe confirmation of a bullish reversal in this zone such as:
Pin bar candles, engulfing
Or BoS on the M15 frame
Targets:
Short-term: $3950 – $3990
Long-term: Target “+1000 pips”
Risk management:
Place Stop Loss below the Bullish OB zone to protect the account.
🧭 Conclusion
The current market sentiment is very favorable for the Buyers:
USD is under downward pressure
Defensive capital flows strongly into Gold
The FOMO effect may stimulate an extended rally
The combination of solid technical structure and strong fundamental support is creating an almost perfect bullish picture.
👉 Be patient, stick to the plan, and await this golden opportunity.
💼 Wishing you all an effective and victorious trading day!

JD 1D: Bulls taking the lead?On the daily chart, JD.com broke out of a falling wedge, moving above both MA50 and MA200. That’s a strong technical signal hinting at a potential mid-term trend reversal.
Upside targets are mapped at $39.8 and $46, with Fibonacci levels suggesting a possible extension toward $52 if momentum holds. Support remains around $33–35, and as long as the price stays above it, buyers are in control.
From a fundamental perspective, JD continues to reshape its business, expand online services, and benefit from China’s economic recovery. Competition with Pinduoduo and Alibaba is tough, but technically bulls seem to have the upper hand.
Tactical outlook: watch the MA200 - staying above it keeps the growth scenario intact.

XAU/USD – 01/10 | US Government Shutdown Confirmed | Gold awaits🔎 Context & News
US Politics : The US government officially shut down after the Senate failed to pass the federal funding bill. A major political risk catalyst, triggering safe-haven flows into Gold.
FED : Probability of a -25bps rate cut in October rises to 96.2% → almost certain.
Key Events Today (ET / UTC) :
• ADP Employment Change: 08:15 ET / 12:15 UTC
• ISM Manufacturing PMI: 10:00 ET / 14:00 UTC
→ Both will be crucial data points that may shake Dollar and Gold.
📌 Summary : US politics + FED easing = Gold remains supported, but ADP & ISM tonight could spark strong volatility in the US session.
📈 Technical Analysis (H1)
Main Trend : Bullish after multiple BoS.
EMA : EMA 34 > EMA 89 → bullish momentum intact.
Resistance :
3,897 – 3,907 (Sell scalp – Fibo 0.5–0.618).
3,920 – 3,921 (Liquidity / ATH test).
Support :
3,872 – 3,876 (old high retest).
3,833 – 3,841 (OB zone).
3,814 – 3,822 (deep Support Zone – losing this shifts bias).
🎯 Trade Plan
✅ Buy (trend priority)
Buy Zone 1 : 3,872 – 3,876
• SL: 3,869
• TP: 3,897 → 3,907 → 3,920
Buy Zone 2 (OB) : 3,833 – 3,841
• SL: 3,826
• TP: 3,872 → 3,897 → 3,907
Buy Zone 3 (Deep Support) : 3,814 – 3,822
• SL: 3,808
• TP: 3,841 → 3,872 → 3,897
⚡ Sell (short scalps only – lower RR)
Sell Zone 1 : 3,897 – 3,907
• SL: 3,912
• TP: 3,885 → 3,876 → 3,841
Sell Zone 2 (ATH sweep) : 3,920 – 3,921
• SL: 3,925
• TP: 3,907 → 3,885 → 3,876
📝 Conclusion
Gold remains strongly supported by the US government shutdown + FED rate cut expectations.
Strategy today: Prioritize Buy at support; Sell only for short scalps around 3,907 – 3,921.
⚠️ Watch out: ADP & ISM tonight may trigger unexpected volatility → manage risk carefully and move SL to BE after TP1.
📢 If you find this Captain’s Log useful, don’t forget to Follow Captain Vincent ⚓ for the latest updates.
💬 What do you think, crew? Will Gold break ATH 3,920 right after ADP & ISM tonight?

ANFIBO | XAUUSD - The week's last day, I'm bullish over $3800Hi guys, Anfibo's here!
OANDA:XAUUSD Analysis – Daily Trading Strategy
Overall Picture:
At present, gold (XAUUSD) continues to hold steadily within the H4 bullish channel, without any unusual volatility. The dominant uptrend remains intact, and the market structure still favors buyers. Personally, I remain optimistic that gold will soon head toward a new ATH above $3,800/oz in the medium term. However, in the short term, the market may continue to fluctuate around key support and resistance levels before confirming its next move.
Technical Outlook:
Short-term trend: Solidly bullish, though momentum is slowing; accumulation may form before the next breakout.
> SUPPORT KEY / BUY ZONES : 3740 - 3723 - 3713 - 3703
> RESISTANCE KEY / SELL ZONES : 3770 - 3777- 3788 - 3799 - 3836
Here's my Trading Plan today:
>>> SELL ZONE:
ENTRY: 3769 - 3775
SL: 3780
TP: 3740 - 3723
>>> BUY ZONE:
ENTRY: 3700 - 3705
SL: 3695
TP: 3760 - 3800 - 3836
Risk Management:
- Prioritize buy trades in line with the dominant trend, limit countertrend shorts.
- Maintain a R:R ratio of at least 1:2 on all setups.
- Manage capital strictly, avoid overtrading during sideways phases before breakout.
✅ Conclusion:
Gold is maintaining a stable uptrend on H4, with market structure still supporting buyers.
Main scenarios: Buy on dip around 3700 – 3705.
A clear move beyond 3780 would likely pave the way toward a new ATH above $3,800.
HAVE A NICE WEEKEND, GUYS!!!

LiamTrading – XAUUSD Fibo & Volume Profile AnalysisLiamTrading – XAUUSD Today's Scenario: Fibo & Volume Profile Analysis
Gold, after testing the 375x zone, has shown clear signs of weakening. On the H1 frame, the price structure is forming an adjustment phase as it aligns with key Fibonacci and Volume Profile levels. This is the time when the market begins to “filter” liquidity, creating opportunities for both short sell orders and buys at strong support zones.
Technical Analysis
Fibonacci indicates the 0.786 – 1.0 zone around 3756–3758 coincides with strong resistance and FVG, with a high potential for a reversal.
Volume Profile points out the POC zone around 3735–3740; if breached, it will pave the way for deeper downward pressure.
The confluence support zone 0.618 fibo + large volume around 3688–3691 is suitable for scalping buys.
Further, the 3648–3651 area is reinforced by VAL and the volume profile bottom, making it a strong long-term “Buy zone.”
Trading Plan Reference
Sell zone: 3756 – 3758, SL 3763, TP 3750 – 3748 – 3736 – 3710 – 3690 – 3655
Buy scalping: 3688 – 3691, SL 3685, TP 3701 – 3715 – 3728
Long-term Buy zone: 3648 – 3651, SL 3640, TP 3670 – 3688 – 3700 – 3718 – 3733 – 3755
In summary, gold is moving according to the technical structure with confirmation from Fibonacci and Volume Profile. Today's scenario prioritizes observing reactions around the sell zone 3756–3758 to find short opportunities, and waiting to buy at value zones 369x and 365x for the recovery wave.
This is my personal view on XAUUSD. If you want the fastest updates on the next gold scenarios, follow me and join the community to not miss out.

XAUUSD – Downtrend Continues to be FavoredDowntrend Continues to be Favored (Wolfe Waves Pattern H4)
Hello Trader,
Gold is following the Wolfe Waves structure on the H4 chart, after bouncing off the upper resistance zone and returning below the trendline. This indicates that the short-term upward momentum has weakened, and the scenario of a downward adjustment continues to be prioritized at this stage.
Technical Analysis
Wolfe Waves are clearly formed, wave 5 has hit resistance and a reversal signal has appeared.
The price failed to hold above the upper trendline, while the MACD shows weakening upward momentum.
The 3746 – 3748 zone is considered the main “sell zone” in the short term.
Nearby support zones: 3709 – 3711 and deeper at 3675 – 3678. Further out, the area around 3650 is an important “buy zone” in the medium term.
Trading Scenarios
1. Sell with the trend (priority)
Entry: 3746 – 3748
SL: 3754
TP: 3733 → 3720 → 3702 → 3690
2. Buy Short-term Scalping
Entry: 3709 – 3711
SL: 3705
TP: 3722 → 3730 → 3745
3. Buy Deep Support Scalping
Entry: 3675 – 3678
SL: 3670
TP: 3688 → 3696 → 3710 → 3725
4. Medium-term Buy Zone
Entry: around 3650
This is a large volume accumulation zone, coinciding with strong support on H4. This area is suitable for considering medium-term buy orders if the price adjusts deeply.
Conclusion
In the short term, the bearish scenario continues to be favored, especially when the price stays below the 3748 zone.
Buy strategies should only be considered in the form of scalping or at the important buy zone around 3650.
The current gold market is still in a distribution phase, so patience is needed to observe candle confirmations at entry zones to optimize the R:R ratio.
This is today's XAUUSD trading scenario according to Wolfe Waves on H4. You can refer to it and combine it with your personal strategy for the best risk management.
Follow me to receive the latest scenarios when the price structure changes.

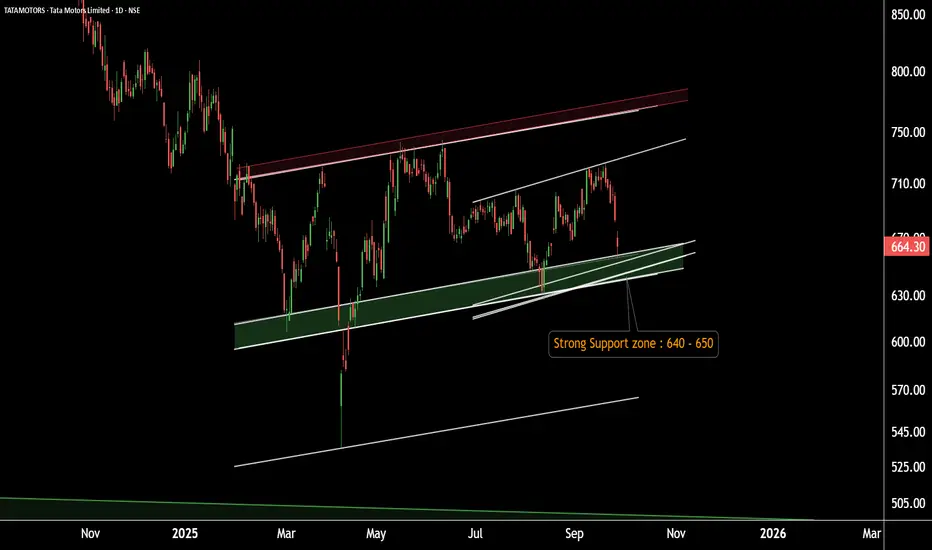
Tata Motors – Back at Key Support! Setting Up for the Next Bull.Tata Motors Daily Chart Update
Tata Motors is moving within a well-defined parallel channel, with a strong support zone around 630–650.
If this zone holds, the stock may see upward momentum.
Potential upside target: 730–740.
Thank you!
LiamTrading – XAUUSD IN-DEPTH ANALYSIS OF CURRENT TRENDSLiamTrading – XAUUSD Today's Scenario: Opportunities at Key Price Levels
Gold continues its strong upward momentum, currently oscillating around the 376x–377x range after a series of breakouts. The technical structure on the H1 chart indicates the market is forming clear resistance and support zones, suitable for short-term trading plans.
Technical Analysis
RSI is cooling off from high levels, indicating the potential for a short-term correction.
The upper price zone around 3818–3821 is a strong confluence of resistance, coinciding with wave peaks and Fibonacci extensions, making it prone to selling reactions.
Conversely, the support zones at 373x and 370x show dense liquidity, serving as potential buying points when prices correct.
The short-term Dow structure still leans towards an uptrend, but attention is needed at the sell confirmation zone if gold fails at the peak.
Trading Plan Reference
Sell Zone: 3818 – 3821, SL 3828, TP 3805 – 3785 – 3760 – 3732 – 3650
Buy Scalping: 3728 – 3731, SL 3723, TP 3750 – 3777 – 3790
Buy Zone: 3706 – 3709, SL 3700, TP 3725 – 3738 – 3750 – 3777 – 3790
In summary, the main trend still favors an uptrend, but with gold approaching strong resistance zones, the likelihood of a correction is high. Traders should patiently wait for reactions at the marked zones for optimal entry, while managing risk tightly.
This is my personal view on XAUUSD. If you're interested in gold scenarios, follow me for the fastest updates.

LiamTrading – XAUUSD H1LiamTrading – XAUUSD H1: Adjustment structure formed, awaiting confirmation below 3685
After a surge to 375x, gold is entering a correction phase, aligning with the structural pattern. On H1, the price is clinging to the upper edge of the rising wedge, with RSI cooling off from overbought territory, indicating a growing supply pressure. Today's plan focuses on the adjustment structure, prioritizing selling upon confirmation signals.
Key price zones (refer to the attached chart)
Sell strong resistance 3775–3785: confluence of channel peak + 2.618 extension. Look for weakening reactions to enter short/medium-term sell orders.
Buy zone volume 3726–3720: a thin support area providing momentum for a rebound. Holding this zone could push prices to retest 3750–3775; conversely, losing 3720 may lead to a deeper decline.
Resistance + FVG 3715–3698: as prices drop, this area turns into supply; a failed retest here is an early signal for further decline.
Confirm sell 3688–3685: closing H1 below this zone confirms a short-term downtrend, targeting a lower buy zone.
BuyZone 3652–3646: confluence of channel bottom + old liquidity, expecting a strong upward reaction if revisited.
Trading scenarios for reference (adhere to risk management)
Sell reaction at peak: 3778–3783, SL 3792, TP 3755 → 3738 → 3722.
Sell upon confirmation: wait for H1 to close below 3685, enter sell 3684–3682, SL 3696, TP 3673 → 3656 → 3648.
Buy scalp based on volume: 3726–3720, SL 3715, TP 3738 → 3750 (only short-term if the larger structure remains corrective).
Buy swing at strong zone: 3652–3646, SL 3639, TP 3673 → 3698 → 3712 → 3740.
Operational notes
Prioritize waiting for rejection/closing signals at the mentioned zones; avoid chasing orders in between.
Order volume should be allocated based on confirmation levels (confirmation zone < breakdown < failed retest).
Avoid excessive leverage; adjust SL according to structure when in profit.
This is a personal perspective, not investment advice. If you want the fastest updates on the next XAUUSD scenarios, follow me and join my community for discussions.

XAUUSD 09/24 – Scenario after the Fed's Key SpeechXAUUSD 09/24 – Scenario after the Fed's Key Speech
Hello everyone,
Gold continues its consecutive upward momentum in recent sessions. Yesterday, the price touched the 1.618 Fibonacci level on the H4 chart and then pulled back, indicating a slight rejection right after the PMI news.
Technical Perspective
The Wolfe Waves structure remains intact, not yet broken.
If the price returns inside the trendline, the signal confirming the Wolfe pattern will become clearer.
Current key resistance zone: 3790 – 3825, coinciding with the 361.8 Fibonacci.
Noteworthy short-term support zone: 3650 – 3647.
Fundamental Perspective
In yesterday's speech, Chairman Powell emphasized: “If monetary policy is loosened too quickly, efforts to curb inflation will fail.”
This indicates that the Fed continues to prioritize price stability over the market's expectations for rate cuts. This is a factor to consider when trading gold in the current phase.
Today's Trading Scenario
Sell Setup
Entry: 3825 – 3827
SL: 3833
TP: 3810 – 3790 – 3768 – 3755
Buy Setup
Entry: 3650 – 3647
SL: 3642
TP: 3672 – 3688 – 3695 – 3710 – 3750
Summary
In the short term, gold is in a correction phase after hitting resistance. Prioritize observing signals around 3790 – 3825 to find Sell opportunities, while the 3650 zone is a notable buying point for a recovery scenario.
This is today's XAUUSD trading scenario according to the Wolfe Waves pattern. You can refer and adjust according to your personal strategy.
Follow me for the latest analysis updates as the market changes.
Wishing you successful trading!

EURCAD: Swing Trading & Technical Analysis
The analysis of the EURCAD chart clearly shows us that the pair is finally about to tank due to the rising pressure from the sellers.
Disclosure: I am part of Trade Nation's Influencer program and receive a monthly fee for using their TradingView charts in my analysis.
❤️ Please, support our work with like & comment! ❤️

XAUUSD – Wolfe Waves Forming on H4 ChartHello Trader,
On the H4 chart, gold is forming a fairly classic Wolfe Waves pattern. The fifth wave has completed, and the price is entering the critical resistance zone of 3760 – 3770, which is also a potential Sell Zone. With the current structure, the preferred scenario is a short-term downward correction before the main trend resumes.
Technical Analysis
The price has touched the 2.618 Fibonacci Extension and reacted downward, indicating profit-taking pressure.
The MACD still shows strong previous buying momentum, but the histogram is starting to weaken, aligning with the potential for a corrective wave.
Area 3760 – 3770: a critical resistance zone, coinciding with the fifth wave of the Wolfe Waves.
Trading Scenario
Sell Order According to Wolfe Waves
Entry: 3760 – 3770
SL: 3782 (above resistance zone)
TP: 3710 -3660 -3610 – 3620 (key level Wolfe target)
Sell when price confirms below the trendline
Entry 3727-3730
sl 3735
tp 3715-3700-3686-3665
Short-term Buy Scalping
Entry: 3705 – 3708
SL: 3700
TP: 3720-3730 – 3745- 3766
Note: This is just a short-term retracement strategy, counter to the correction, so risk management is crucial.
Conclusion
Short-term: Prioritize observing reversal signals at 3760 – 3770 for a Sell.
Medium-term: Wait for Buy opportunities around 3564 – 3574 to align with the main trend.
The market is entering a distribution and correction phase, so patiently waiting for candle confirmations at key areas will be key to optimizing entry.
This is the Wolfe Waves scenario I propose for gold during this period. Feel free to refer and adjust according to your own strategy.
Follow me for the fastest updates when the price structure changes.

XAUUSD – Daily Trading Outlook
Good day Traders,
Gold opened the Asian session by holding its structure firmly. The 3708 level will act as the pivotal price marker for today:
A sustained break above this resistance would open the way towards 3750, with potential extension to 3780.
Conversely, failure to overcome 3708 and a rejection at this level could trigger a retracement, with 3650 – or even the 355x region – serving as key buying areas.
Fundamental Context
Last week’s corrective move was largely driven by comments from the Federal Reserve Chair regarding interest rate policy. The Fed is reluctant to implement multiple rate cuts, and this week’s PCE data will be critical in shaping expectations.
Trading Scenarios for Today
Buy Setup
Entry: 3650 – 3653
Stop-loss: 3645
Targets: 3662 – 3675 – 3690 – 3706 – 3725
Sell Setup 1
Entry: 3700 – 3703
Stop-loss: 3708
Targets: 3690 – 3675 – 3662 – 3650 – 3633
Sell Setup 2
Entry: 3738 – 3740
Stop-loss: 3746
Targets: 3725 – 3710 – 3700 – 3675 – 3650
Conclusion
For today, the preferred bias remains to buy on dips in line with the broader uptrend, while carefully monitoring reactions at the outlined key levels.
Follow me to receive timely updates as soon as price structure changes.

LiamTrading – A Long-Term Trend in XAUUSD is EmergingGold continues its strong upward momentum, currently trading around 3,680 – 3,685. Following a series of consecutive bullish candles, the price is showing signs of consolidation and slight correction, paving the way for an important scenario in the upcoming phase.
Technical Analysis
On the Daily chart, the RSI has surpassed the 70 mark, indicating an overbought condition. This is often an early warning sign for a potential correction.
The price structure suggests that the FVG zone of 3,630 – 3,600 will be the first observation point if a short-term correction occurs.
A stronger support zone lies at 3,510 – 3,475, coinciding with the Fibonacci 0.5 – 0.382 levels and also the previous resistance area that has been broken. This is considered a potential long-term 'Buy zone'.
If the correction phase completes, gold could fully resume its upward trend with a further target around 3,800 (Fibonacci extension levels 2.618 – 3.618).
Trading Scenarios
Short-term: Monitor the reaction at 3,630 – 3,600. If it holds, a short-term rebound may occur. Pay attention to the price area around 3552-3562 for reactions.
Medium-term: Wait for the price to test the 3,500 – 3,475 zone to find more sustainable buying opportunities.
Long-term: The major trend still leans towards an increase, with the expected target aiming for 3,800.
This is my personal view on XAUUSD, and you can use it as a reference to build your own plan. If you find it helpful, follow me for the latest updates on gold scenarios.

XAUUSD –Today’s Trading Outlook | Sell Fill Liquidity & Buy ZoneHello traders,
In recent sessions, gold has remained highly volatile around key liquidity areas and major support–resistance levels. The current market structure indicates that the bearish side continues to dominate in the short term, whilst buyers are only likely to re-emerge at deeper support zones.
Technical Outlook
Key Resistance: 3670 – 3680, overlapping with the FVG zone → prime area for Sell to Fill Liquidity.
Short-term Support: 3630 – 3627. A clear break here could trigger a deeper decline.
Buy Scalping Zones: 3613 – 3615 and 3595 – 3598, suited for short-term intraday longs.
Medium-term Buy Zone: 3600 – 3590, aligning with strong liquidity and major structural support.
MACD: showing a bearish bias, with a negative histogram reflecting continued selling pressure.
Trading Scenarios
Sell Setup (preferred)
Sell Liquidity Zone: 3670 – 3680
SL: 3685
TP: 3650 – 3635 – 3627 – 3615 – 3600
Buy Scalping
Zone 1: 3613 – 3615 | SL: 3608 | TP: 3625 – 3638 – 3645
Zone 2: 3595 – 3598 | SL: 3590 | TP: 3610 – 3625 – 3638 – 3645 – 3670
Medium-term Buy
Zone: 3600 – 3590
SL: 3584
Extended TP: 3633 – 3660 – 3675
Conclusion
In the short term, gold is likely to retest the upper liquidity zone before continuing its downward leg. Sellers still hold the advantage, but deeper support levels may present attractive opportunities for medium-term buyers.
Stay focused on these critical price zones and trade in line with your individual plan.
Follow for timely updates as market structure develops.
