EURUSD Massive Long! BUY!
My dear subscribers,
EURUSD looks like it will make a good move, and here are the details:
The market is trading on 1.1726 pivot level.
Bias - Bullish
My Stop Loss - 1.1713
Technical Indicators: Both Super Trend & Pivot HL indicate a highly probable Bullish continuation.
Target - 1.1747
About Used Indicators:
The average true range (ATR) plays an important role in 'Supertrend' as the indicator uses ATR to calculate its value. The ATR indicator signals the degree of price volatility.
Disclosure: I am part of Trade Nation's Influencer program and receive a monthly fee for using their TradingView charts in my analysis.
———————————
WISH YOU ALL LUCK
Technicaltrading

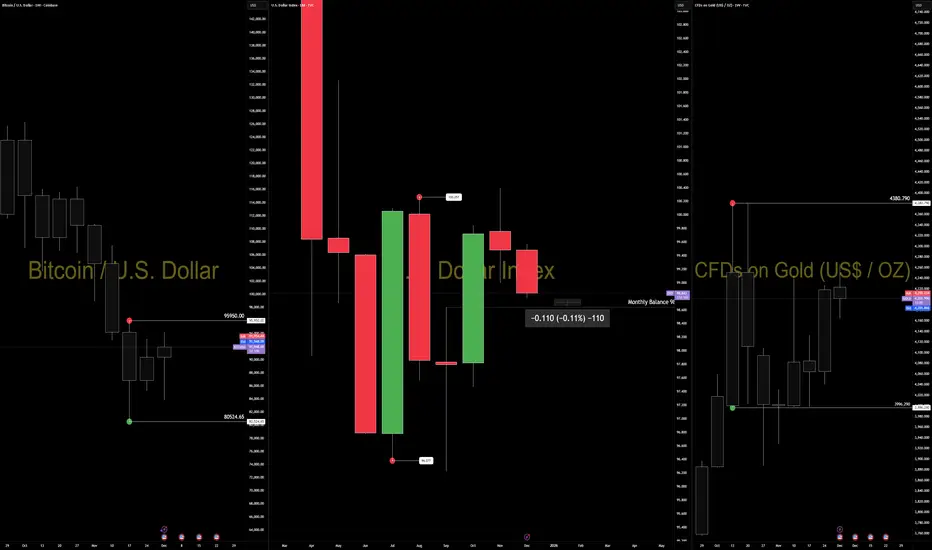
The Dollar Is Compressing Into 98.635 — Macro Pressure Meets StrThe dollar has been under steady macro pressure all week.
Rate cut expectations, softer yields, and liquidity repricing have weakened the USD across the board.
We’ve seen the same conditions lift EURUSD, gold, and BTC — not because those markets react to DXY levels, but because they respond to the same macro drivers.
That is the correct interpretation.
Now the structural question is simple:
DXY is sitting less than 0.11% above monthly balance and pressing into 98.635 — the level algorithms historically defend.
This is the inflection.
If 98.635 holds:
USD stabilizes, stretched rotations cool, and we likely see counterflow in EUR, gold, and BTC.
If 98.635 breaks:
Macro pressure accelerates, and the next leg of dollar weakness opens with far more momentum.
The key distinction:
FA explains the pressure.
TA defines the resolution.
Cross-asset strength today isn’t randomness.
It’s macro conditions expressed differently across instruments while USD approaches the structural point where the next phase becomes obvious.
Watch 98.635.
Structure will answer what fundamentals only set up.
— CORE5DAN
Institutional Logic. Modern Technology. Real Freedom.
Weekend structure: 101.4k reclaimed, next 104.5k?BTC showed clear accumulation this morning, taking out yesterday’s low at 101,422.74 and then rallying hard into Friday’s and Saturday’s highs.
Two targets above are still untouched — 104,191 and 104,550 — likely next in line if buyers stay in control.
Price is holding around 102,900, showing strength after that fakeout drop.
Watch how price reacts near 104k — if liquidity holds, we could see one more push before the next pullback.
Smart money moves first — absorption always comes before expansion.
Institutional Logic. Modern Technology. Real Freedom.

BTCUSD — NY Session🧭 Market Context
Bitcoin just hit 100,966, a key weekly volume level.
This is where big players make their move — either defend or break it.
Right now, patience matters more than prediction.
Let the level show its hand.
📈 Technical View
Structure’s still bearish, but price is testing a major area.
If we close under this weekly level, that shifts the short-term bias.
These volume zones act like algorithmic switches — one move and momentum flips fast.
We’ll see if price pulls back cleanly or just breaks straight through.
No rush — this is the spot to stay calm and read behavior.
🌍 Macro View
The Dollar stays strong because yields are high.
Crypto’s just reacting — not leading.
Money flow’s defensive, and traders are managing risk, not chasing pumps.
Until yields cool off, crypto’s range-bound.
🏛️ Coach’s Take
This level isn’t for guessing.
It’s where pros slow down, not speed up.
React after confirmation — not before it.
🎯 Operator Rule
“Let the level talk before you do.”
— CORE5DAN
Institutional Logic. Modern Technology. Real Freedom.

DXY — London Session🧭 Market Context
Dollar capped down overnight from 99.762 to 99.704 but still trades above the key bullish structure point at 99.525. The structure remains bullish overall, yet price keeps failing to break through 99.875 — the current cap. London session has filled yesterday’s balance range, leaving us in neutral territory.
We’re sitting on zero deviation — meaning equal chance to push higher or rotate lower.
Before taking any position, we need confirmation.
📈 Technical Frame DSM + VFA
Structure stays constructive but momentum is fading.
Volume shows thinning participation near 99.875 — professionals aren’t chasing.
If we see clear volume conviction through that level, we likely drive higher and fill the capped zone. If price slips below 99.525, expect a liquidity sweep into the lower volume pocket near 99.40. Right now, this is observation mode — not engagement mode.
🌍 Fundamental Frame (Macro Logic)
Overnight softness came from mild risk-on sentiment — Asia equities up, yields down.
Still, the Fed’s tone stays restrictive, and dollar demand remains under the surface.
This move looks more like positioning ahead of NFP than any real shift in trend.
🏛️ Coach’s Lens
When the market sits in balance, patience becomes the edge.
Professionals wait for clarity; amateurs act on hope.
Bias follows structure — not emotion.
🎯 Operator Rule
Confirmation defines conviction.
— CORE5DAN
Institutional Logic. Modern Technology. Real Freedom.

BTCUSD — NY SessionLondon session reversed yesterday’s bearish volume distribution, reclaiming short-term control above the naked point of control near 101,127 — the first lost bearish distribution now flipped higher.
That recovery showed buyers stepping back in to defend structure, with the NY open holding the move higher.
Technically, Bitcoin still trades inside a bearish market structure.
No daily highs have been broken, so the broader bias remains down.
Heavier selling pressure is expected near the unfilled distribution level at 103,819.
The full bearish range spans 104,803 (high) to 98,921 (low) — until that boundary breaks, this is a short-term trading environment, not a trending one.
🌍 Fundamental Frame (Macro Logic)
Bitcoin continues to follow the dollar’s tone, not lead it.
Dollar strength above 99.8, a cautious Fed, and an extended U.S. shutdown all keep liquidity tight.
ETF outflows and high leverage unwind are adding pressure across crypto.
This phase isn’t collapse — it’s the market reducing excess risk while capital looks for clarity.
🏛️ Authority Frame (Coach’s Lens)
Reversals inside structure don’t signal trend change — they test participation.
Professionals treat flips as information, not opportunity, until higher-timeframe control shifts.
Each bounce inside a bearish map measures response quality, not direction.
🎯 Operator Rule:
A recovered level tests strength — it doesn’t prove it.
— Institutional Logic. Modern Technology. Real Freedom.

DXY — London SessionThe Dollar reached its 99.8 target and closed the day above it, confirming short-term strength. Price now trades stretched on the daily chart, well above its normal rhythm. As long as daily lows keep printing higher, structure holds — but with both weekly and monthly charts in correction, momentum could fade quickly. This is a day-by-day market where clarity matters more than conviction.
On the technical side, DXY shows rhythm exhaustion — clear deviation from its average range. When price moves this far from balance, professionals stop chasing and wait for rhythm to reset. The key signal now is whether the next daily low holds or breaks; that decides who controls the tape.
Macro conditions still support the Dollar. The Fed’s tone stays cautious on further cuts, while the U.S. government shutdown keeps data flow limited. Investors prefer safety over yield, and capital continues to park in USD for clarity and liquidity. It’s not a growth story — it’s a stability story.
When a target hits, professionals re-map before acting again. The next decision comes from structure, not emotion.
Operator Rule: After targets hit, think — don’t chase.
- Institutional Logic. Modern Technology. Real Freedom.

BTCUSD Weekend Crypto Warriors MapBTCUSD
Weekend Crypto Warriors | October 31, 2025
Category: BTCUSD
🧭 Context
Mapping the Bitcoin liquidity sweep for the weekend.
If we get volatility today or tomorrow, there are high-probability BTCUSD targets in play. Friday’s price action never took out Thursday’s low at 106.281, and price was pushed back from the daily volume fractal at 106.463.
This week’s unfinished liquidity remains above Thursday’s and Friday’s price action, around 111.066 and 111.629. Price is therefore most likely to rotate toward that liquidity over the weekend.
📈 Technical Analysis POV
From a daily price action perspective, we can clearly see unfinished business on the chart, with liquidity targets positioned at 111.066 and 111.629.
🧭 Macro
U.S. Dollar Index (DXY) holds near 99.7, firm after the Fed’s 25 bp rate cut to 4.00–4.25%.
10-Year Treasury yield steady around 4.6% — still high enough to keep a bid under USD.
High yields + firm dollar = short-term resistance for risk assets like BTC.
Seasonal tailwind: historically, November delivers positive BTC returns — but follow-through depends on yield compression and macro risk appetite next week.
📊 Volume & Order Flow
Order flow activity has slowed notably since Thursday.
On October 30, 2025, BTCUSD recorded a daily trading volume of approximately $69.67 billion, marking a clear drop in participation compared to earlier in the week.
🎯 Plan
At this stage, price action is confirmed range-bound, so no directional bias is required.
We’ll stick to the proven BTC strategy — trade the range with tight micro stops, let positions cruise within structure, and take profits actively as momentum accelerates.
🧠 CORE5
Sweeps expose who’s reactive and who’s disciplined.
Your edge isn’t in predicting the move — it’s in reading the aftermath.
Patience turns chaos into clarity. Control turns clarity into profit.
- Institutional Logic. Modern Technology. Real Freedom.

DXY UpdateDXY — The Volume Cap: Where Momentum Meets Memory
Every market has memory — and in the Dollar Index, it’s sitting right at 97.4.
That’s the current Volume Cap — a zone where heavy participation once stopped price cold, leaving unfinished business behind.
Price loves to revisit these caps, testing whether the imbalance still holds or finally gives way.
⚙️ Context (4H | Friday Recap)
Friday delivered heavy volume and clean directional flow — a textbook session.
DXY continues to rotate within the 97.048–99.198 range, holding a short-term bullish tone inside a larger consolidation.
📊 Technical Map
• Structure: Long-term bearish range inside a broader consolidation phase.
• Momentum: Still bullish, but showing early fatigue.
• Volume Cap: The 97.4 level remains unfilled, acting like a magnet for potential retests — the true battleground between continuation and correction.
🌐 Fundamental Pulse
After a month of running hot, the dollar finally cooled.
Retail Sales and Industrial Production softened, yields eased, and traders started whispering “rate cuts” again.
The Fed’s cautious tone keeps volatility contained ahead of next week’s Core PCE inflation data.
🧭 Trade Plan (If/Then)
If DXY runs through 97.4, watch for a bearish Volume Cap flip — potential downside toward nearby support.
If Monday’s price action drives higher, expect bullish momentum rotation back toward the 97.0 retest region.

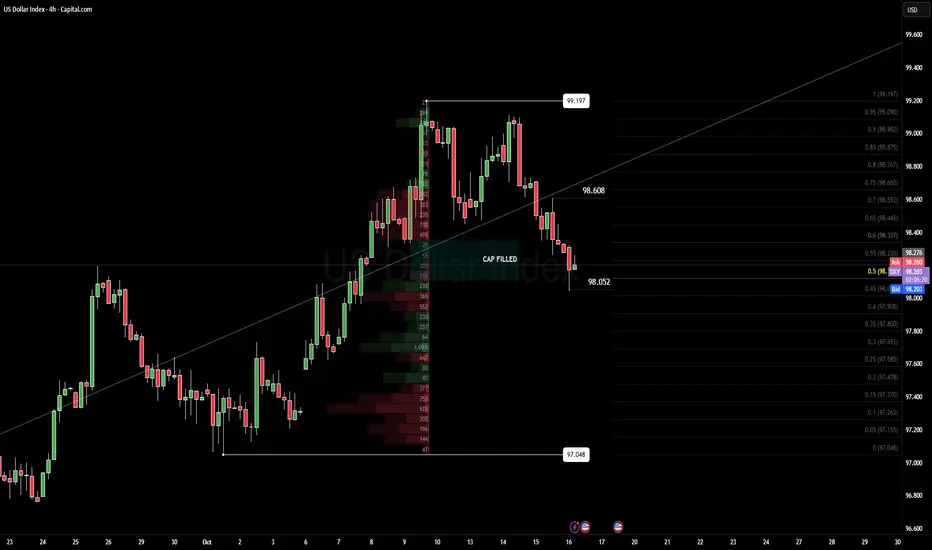
DXY — 4H Fibonacci Discount ZoneDXY — 4H Fibonacci Discount Zone: bounce or breakdown?
Context (4H | Pre-London | 16 Oct)
Dollar Index is testing a 50% Fibonacci discount zone after an overnight -2 deviation.
Volume remains light, but buyers stepped in near the 98.2 region, defending short-term structure.
Big picture still leans bearish
Technical Map
• Structure: Consolidation within broader bearish context — 4H recovery attempts forming.
• Key Level: 98.2 acting as short-term decision point; deviation off 50% Fib zone.
• Momentum: −2 deviation within 4H range — early shift toward mean reversion.
• Volume: Heavy order flow support beneath 98.0; thin liquidity overhead until 98.6.
Structure overall remains bearish, but short-term momentum favors a corrective bid from the Fibonacci discount zone.
Fundamental Pulse
The Fed minutes gave us a small dip in yields, but the Dollar didn’t flinch — it’s still holding firm.
Sticky inflation keeps the Fed cautious, reinforcing that “higher-for-longer” tone.
Now all eyes turn to today’s CPI at 15:30 EET — the real test for rate expectations.
For now, rates steady, risk tone calm, traders waiting for direction.
Plan (If/Then)
If DXY pushes above 98.6, expect momentum toward the 99.0 zone.
Break below 98.05 reopens path toward 97.6–97.4 support band.
R:R potential ≈ 1 : 3 — solid setup if volatility expands post-CPI.
Stay patient and scale small before the CPI lands.
Mindset Pulse
Observation beats anticipation.
Let price confirm your story, not the other way around.
Stay aligned with structure; one mouse click can cost a narrative.
BTC TECHNICAL UPDATE BTC TECHNICAL UPDATE
Price action still bearish in structure, hunting liquidity below. 107 ich
Now we’re trading around −1.5 deviation, with technical volume metrics confirming heavy, controlled selling.
Order flow remains high-volume bearish, but the intent looks mechanical:
liquidity grab → reset → build new base.
Current map
Targeting the 107ich zone — likely final liquidity pocket of this leg.
Below that, bids start stacking, hinting that large players already positioned.
If volume compresses and delta flips positive, expect shift back range.
Execution note:
Treat this as high-frequency setup, not a swing setup.
Keep size light, manage per-trade risk — structure says “controlled drive,” not “capitulation.”
—
Daniel Fadeley

US DOLLAR IS FILLING IN DISCOUNT
Traders are pricing in a possible Fed rate cut, while fresh U.S.–China trade tension adds uncertainty to global flows.
Technically, the dollar sits in its weekly mid-range, printing a 5th inside bar behind last Thursday’s move — the classic order-loading phase.
Price is rotating between a key bullish low weakness zone at 98.30 and a bearish order block near 99.00 — a compression range where liquidity builds before expansion.
Structure remains bearish-biased but currently in bull-back mode.
Buyers are pressing into bearish volume nodes, leaving no clean swing setups — just a 50/50 zone where patience pays.
Expect one side of this range to be cleared before the next directional leg.
Until then, we stay tactical — cross-market focused, scalping for bread and butter while the market sets up its next move.

EUR/USD — BEARISH FRACTAL TAKES SHAPEEUR/USD is developing a fresh bearish fractal, printing a high at 1.19187 after months of consolidation since June.
We’ve already broken last month’s low, and price now sits in alignment with the expanding dollar structure.
Momentum is building — a massive move may unfold next month, but for now confirmation is key.
If October closes bearish, this market confirms a full structural breakdown.
The June low near 1.1720 becomes Target 1, and I’ll be trading it heavy on a confirmed close.
Until then, the play is patience — hunting range discounts and watching orderflow rotations for clean continuation setups.
From a macro perspective, the dollar’s strength remains clear.
The U.S. Dollar Index (DXY) is pressing toward 99.197, an algorithmic expansion zone supported by volume analytics and internal order flow.
Rising U.S. yields and sustained capital inflows continue to pressure the euro, while Eurozone industrial output fell 4.3% month-on-month with Germany down 18.5%, underlining structural weakness.
From the CORE5 lens, structure leads, liquidity confirms, fundamentals justify.
As long as dollar momentum holds and EUR/USD fails to reclaim last month’s structure, the bias remains lower.

DOLLAR INDEX (DXY) — TECHNICALS FIRST, FUNDAMENTALS SECOND
Technically, the key level this week is 99.197. If DXY manages a bullish close above it, we should see a weekly structure shift higher. That opens the door for 99.8 → 101.5 as internal algorithmic targets. This isn’t wishful thinking — this is how systems behave when liquidity regimes flip.
Under that lens, any rejections beneath 99.197 or weak closes around it remain valid short setups — but only after structure gives the nod. Don’t force trades ahead of confirmation.
In the background, the dollar is reacting to trade-war rhetoric and political shifts. Trump’s 100 % tariffs on Chinese imports raised volatility, but he later softened his tone, suggesting more cooperation than conflict. Its complet currency war.
Meanwhile, some analysts argue a bullish case for the dollar remains due to relative U.S. productivity strength and higher real yields.
These narratives give motive, but do not override price structure.
So from CORE5’s frame: structure leads, news lags. Let clean price confirmation in the 99.197 zone tell you whether to lean into long bias or respect the risk of failure. Eyes locked.
BITCOIN — STRUCTURE SHIFT INSIDE BEARISH RANGEBitcoin has filled the 116.3 to 114.9 imbalance and is now trading inside a defined bearish range.
Lower-timeframe structure has shifted downward with significant volume left behind, which suggests this is not a place to buy into strength.
Price has completed the imbalance fill, and the next question is whether this area becomes a market-maker trap or a true continuation leg.
If smart money continues to build short positions, distribution could follow.
If liquidity dries up and buyers absorb, the trap scenario takes shape. Patience remains the correct position.
Focus on the 15-minute to 1-hour range for confirmation. A break of structure, a clean rejection, or a failed retest around 116.3 will define the next directional move.
Until that occurs, any trade inside this zone is a low-probability action.
On the macro side, the U.S. Dollar Index continues higher, signaling risk aversion and tighter global liquidity.
Bitcoin does not move in perfect correlation, but capital still follows the path of safety when the dollar strengthens.
In the current environment, the edge lies in observation and precision, not anticipation.
Let structure confirm before committing. Probabilities always favor the patient.

BITCOIN UpdateBitcoin x Dollar
Bitcoin delivered four clean trades last week — precise structure, high control.
Now we’re sitting right inside the buy zone, near the lower negative deviation of range volume.
Yesterday’s session was flat, typical Sunday noise.
Today, volume’s tightening — energy’s building.
The key structural area is 121 698.
That’s our bearish distribution ceiling — the level that’s kept price capped for weeks.
If Bitcoin holds below, we stay in distribution.
But if it breaks and confirms above, the market opens clean air for a strong leg higher.
Macro adds spice here:
The U.S. shutdown still delays core data, the dollar’s stretched, and liquidity’s thin.
If DXY breaks lower, Bitcoin could fly hard — fast.
But remember, volatility in these conditions ignores perfect TA.
I learned that lesson long ago — great setups fail when macro chaos takes the wheel.
Stay patient.
Watch 121 698 — that’s where the real story starts.

Dollar at Max Deviation — Watching 99.197 CloselyThe dollar had another wild week, closing around 99.197 — right on the edge of major structure.
Most traders see strength, but when you zoom out, this move looks stretched.
Yields have started to cool off, which takes pressure off the dollar’s safe-haven run.
We still got smaller data releases like PMIs and Fed talks, but the big stuff like CPI is on hold until the U.S. shutdown clears.
Even the IMF warned about growing liquidity risks in global FX — meaning sudden spikes or fake outs can happen fast when markets get thin.
Technically, we’re in a bearish zone on the higher timeframe.
The last three months of liquidity targets are already taken, and the market’s now trading inside maximum deviation — a point where algorithms usually reset before any new trend forms.
That’s why 99.197 matters: it’s the last shelf before structure confirms the drop.
If price breaks and holds below that level early next week, momentum likely shifts bearish.
If it holds above, expect more sideways chop before a correction.
For now, it’s all about patience and tracking structure — not emotions.

BITCOIN UpdateWeekly Wrap: The Dollar Holds the Key
BTC hit the highs, we shorted the trap, and rode it clean back to range low — 109,358.
That level? It’s the bearish validation line — the hinge between bull control and breakdown.
Now, price rejected 109 and bounced. As long as this weekly candle closes above 107,250, structure stays technically bullish. No weakness on tape, just normal liquidity rotation.
That’s why I’m closing the heavy shorts and keeping only micro runners. The market still reads algorithmically bullish unless that low gives way.
The wildcard, as always: the Dollar.
We’re sitting in a high-probability sell zone. If DXY rolls over, that fuels risk-on flow — BTC, Gold, and Euro all breathe again.
But if market makers squeeze it higher, that’s death to metals and crypto. Expect a sharp flush across the board.
📊 Bottom line:
→ BTC structure intact.
→ DXY in sell territory, but not confirmed.
→ Watch weekly close — 107,250 is everything.
Stay calm. This is the part where most traders misread rotation as reversal.

BTCUSD update
Bitcoin just smashed through another order block and slipped straight into the discount zone — the area where opportunity often hides.
Price has flushed thru last oredblock and is now sitting deep in liquidity pockets Structure remains bearish in the short term, but momentum hints at a possible rotation higher if we see dollar to reclaim lower levels, lets see what next week brings to us
This has been an incredible trading week — multiple clean plays across majors and BTC delivering textbook structure. Now comes the patience phase. Let price confirm before adding exposure.
#BTC #Bitcoin #Crypto #SmartMoney #CORE5TRADECRAFT #MarketStructure #OrderFlow #TradingView

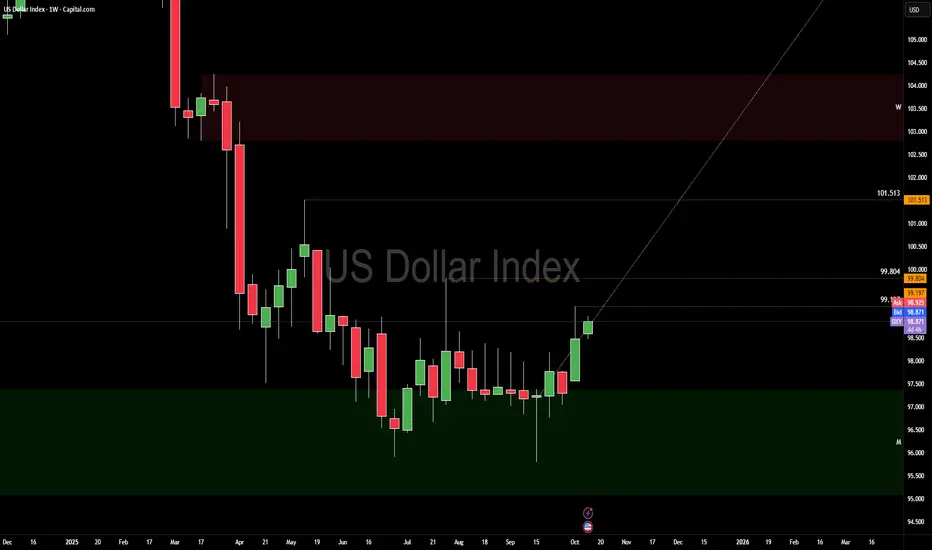
US Dollar RECAPDollar Index (DXY) — Range Heat Building
You’ve got a weekly bearish range, with a key high at 99.8 and price now trading into bearish distribution around 99.0.
The dollar’s been front and center this week — while Washington argues over funding, it’s been doing real damage across cross-asset charts.
Price has been printing higher lows all week, grinding inside this bearish range.
That’s your profit-taking zone, not an add-on zone.
Stay patient. Let the range speak.

BITCOIN IDEA
Bitcoin is still stuck in a sideways range.
KEY level bullish is at 122,300, and right now price isfilling orders near 121,183 daily cap.
That means we’re kind of in the middle — not super strong, not super weak.
The daily trend is still up, but price is pulling back a bit to fill orders.
If Bitcoin starts dropping, 118,543 is the next big level to watch.
If it holds and bounces, we might see another push higher.
If it breaks, we could fall deeper into that lower area.
The U.S. dollar is strong this week → makes it harder for BTC to move up.
Jack Dorsey (the Twitter guy) just dropped a new Bitcoin wallet — cool for long-term use.
So for now: stay patient, watch 121K and 118K zones, and don’t chase candles.

US DOLLAR TARGETS HITThe U.S. government is still shut down, so no fresh economic data is coming out. That means everyone’s trading half-blind right now—no jobs numbers, no inflation updates, just noise. But the chart still tells the truth. All the bullish dollar targets were hit exactly as planned, and now price is sitting right under that 99.8 key high. That’s the line that decides everything. If market makers push price higher than 99.8, the bullish phase stays alive a bit longer. If it fails there, we drop back into bearish discount territory, where value sits lower and sellers regain control.
Over the past four months, liquidity’s been building above those highs. Now we’re watching a classic stop run—price pushing up to take out weak hands before the real move begins. That’s why cross markets like stocks, gold, and crypto are slipping. The dollar’s acting as a safe spot while everything else bleeds. But the volume looks thin, which usually means manipulation, not genuine demand.
Without the usual USD data, it’s all a guessing game until the Fed minutes drop later today. For now, it’s simple: the 99.8 zone is the make-or-break level. Stay patient, read the structure, and let the chart talk. Price always moves to where orders are missing, and stops where they’re full. Follow that rule, and you’ll never feel lost in the noise.

EUR USD and DOLLAR UPDATE
The Dollar Index (DXY) is grinding through a daily order block and has just pierced 97.882.
Technical
If we close above 97.882, that confirms a break and opens continuation toward higher liquidity zones. With tomorrow’s heavy macro news, the setup has volume behind it for a potential massive move.
Macros
U.S. government shutdown is weighing on confidence and trimming growth forecasts (each week may shave 0.1–0.2pp off GDP).
The Fed remains cornered — markets price in rate cuts, but policy credibility is under scrutiny.
Safe-haven flows are mixed: gold at records, dollar stabilizing after Supreme Court support for Fed’s Cook.
Data releases are being delayed by the shutdown, which adds uncertainty and volatility.
EURUSD
We’re short and holding.
4-month rangebound structure remains
Be aware
Dollar strength is being fueled by technical break + macro volume. EURUSD is vulnerable if DXY confirms above 97.882.
But with policy risk and shutdown uncertainty, expect volatility spikes and liquidity hunts around tomorrow’s big data.
