GBPJPY: Long Trade with Entry/SL/TP
GBPJPY
- Classic bullish formation
- Our team expects pullback
SUGGESTED TRADE:
Swing Trade
Long GBPJPY
Entry - 202.77
Sl - 202.54
Tp - 203.28
Our Risk - 1%
Start protection of your profits from lower levels
Disclosure: I am part of Trade Nation's Influencer program and receive a monthly fee for using their TradingView charts in my analysis.
❤️ Please, support our work with like & comment! ❤️
Tecnicalanalysis

EURJPY Sellers In Panic! BUY!
My dear subscribers,
This is my opinion on the EURJPY next move:
The instrument tests an important psychological level 179.30
Bias - Bullish
Technical Indicators: Supper Trend gives a precise Bullish signal, while Pivot Point HL predicts price changes and potential reversals in the market.
Target - 179.52
My Stop Loss - 179.18
About Used Indicators:
On the subsequent day, trading above the pivot point is thought to indicate ongoing bullish sentiment, while trading below the pivot point indicates bearish sentiment.
Disclosure: I am part of Trade Nation's Influencer program and receive a monthly fee for using their TradingView charts in my analysis.
———————————
WISH YOU ALL LUCK

AUDNZD: Bulls Will Push
The analysis of the AUDNZD chart clearly shows us that the pair is finally about to go up due to the rising pressure from the buyers.
❤️ Please, support our work with like & comment! ❤️

AUDCAD: Bullish Continuation & Long Trade
AUDCAD
- Classic bullish pattern
- Our team expects retracement
SUGGESTED TRADE:
Swing Trade
Buy AUDCAD
Entry - 0.9155
Stop - 0.9145
Take -0.9173
Our Risk - 1%
Start protection of your profits from lower levels
Disclosure: I am part of Trade Nation's Influencer program and receive a monthly fee for using their TradingView charts in my analysis.
❤️ Please, support our work with like & comment! ❤️

LiamTrading –XAUUSD H1|Gold approaches trendline – ready to...LiamTrading –XAUUSD H1|Gold approaches trendline – ready to explode, waiting for a breakout to choose direction!
Gold is moving close to the lower trendline of the ascending channel, indicating an accumulation state – waiting to choose direction. The price has not broken the 4210 resistance zone, but neither has it breached the trendline, so today's fluctuation will revolve around this structure.
If the buying force is strong enough and closes the H1 candle above 4210, the upward trend will be reactivated with a broader target. Conversely, if the price breaks below the trendline, gold may fall to the POC area according to Volume Profile/Fibonacci around 4126–4130, where it will prioritize finding buy signals according to the main trend.
🔍 Technical Analysis (Volume Profile • Trendline • S/R • Fibonacci)
H1 Ascending Channel: Price is testing the trendline for the second time → a pullback bounce is likely if the selling force is weak.
Strong Resistance:
4210: hard resistance – needs to break to confirm an increase.
4230: extended area, coinciding with the channel peak – likely to have strong reactions.
Important Support:
4174: intermediate support; breaking this level will trigger a short-term decline.
4126–4130: POC + large liquidity according to Volume Profile – the best buying area if a deep correction occurs.
Market Signal: Weak candles in the 4180–4190 area indicate gold is waiting for USD information before making a move.
📈 Daily Trading Scenarios
Scenario 1 – Buy according to trend (priority)
Entry: 4126–4128 (POC + Volume Profile support)
SL: 4120
TP: 4140 → 4156 → 4180 → 4198
Suggestion: Wait for a rejection candle or reversal pattern at 412x.
Scenario 2 – Sell when breaking trendline (counter-trend)
Condition: H1 breaks below trendline + retest fails
Entry: 4174–4176
SL: 4182
TP: 4150 → 4135 → 4110
Note: Only sell when there is a confirmation candle; this is a short-term scalping order.
Scenario 3 – Buy when breaking and holding above 4210 (Break & Retest)
Entry: 4212–4216
SL: 4202
TP: 4230 → 4260 → 4285
🌍 Macro Analysis – USD under pressure from new tariff plans
President Trump is preparing to cut tariffs on goods from many Latin American countries (beef, bananas, coffee...).
Objective: reduce domestic food prices, lower import costs.
This could weaken the USD when officially announced → gold benefits in the medium term.
⚠️ Invalid Conditions
H1 closes below 4120 → loses upward structure, may slide to 4090–4100.
H1 closes above 4230 → cancel all sell orders, prioritize buying on breakout.
Which price area are you observing?
Please comment below & hit Follow on LiamTrading channel to receive the earliest analysis every day!

GOLD Massive Long! BUY!
My dear friends,
Please, find my technical outlook for GOLD below:
The price is coiling around a solid key level - 4172.5
Bias - Bullish
Technical Indicators: Pivot Points Low anticipates a potential price reversal.
Super trend shows a clear buy, giving a perfect indicators' convergence.
Goal - 4195.5
Safe Stop Loss - 4159.1
About Used Indicators:
The pivot point itself is simply the average of the high, low and closing prices from the previous trading day.
Disclosure: I am part of Trade Nation's Influencer program and receive a monthly fee for using their TradingView charts in my analysis.
———————————
WISH YOU ALL LUCK

XAUUSD – H1: PRIORITIZE BUYING WITH PRICE CHANNEL, WATCH FOR...💛 XAUUSD – H1: PRIORITIZE BUYING WITH PRICE CHANNEL, WATCH FOR ADJUSTMENTS 🎯
🌤 Overview
Gold is maintaining its upward channel on H1 → main strategy: hold Buy longer than Sell.
The Asian–European sessions show multiple liquidity clusters suitable for scalping and optimizing entry points.
Fundamentals: DXY retreats around 99.15, market reduces expectations of Fed rate cuts in December; Fed Collins hints rates may remain unchanged longer → gold's range may experience short-term fluctuations.
💹 Technical (ICT view)
The H1 upward channel maintains a structure of higher lows; the lower trendline is the main support.
4163–4165: confluence of trendline + liquidity (ideal Buy entry point).
4130–4133: deeper support; below that is the 4100–4080 zone (medium-term support; around Fibo ext 1.618 ≈ 4114 and 2.618 ≈ 4054).
Nearby resistance: 4215–4225; a decisive break opens up to 4260.
🎯 Trading Plan Reference
Buy #1 (priority): 4163–4165 │ SL 4157 │ TP 4180 → 4195 → 4220 → 4260
Buy #2 (deeper support): 4130–4133 │ SL 4125 │ TP 4150 → 4175 → 4190 → 4220
Sell (only with confirmation):
Scenario A: M15/M30 gives strong rejection signals at 4215–4225 → SL 4230 │ TP 4200 → 4188 → 4165.
Scenario B: H1 closes below 4157 (breaks structure) then retests unsuccessfully → target 4135 → 4115 → 4100.
⚠️ Risk Management Notes
Prioritize Buy according to trend; Sell orders are only short-term reactions.
Use M15/M5 to time entries in the specified zones.
If H1 closes below 4125, consider narrowing Buy positions, wait for the 4100–4080 zone.
🌷 Conclusion
The H1 upward channel still guides the flow of funds 💛. Patiently wait for adjustments to 4163–4165 or 4130–4133 to buy according to the trend, manage orders tightly as prices approach 4215–4225.
If useful, please 💛 like – 💬 comment – 🔔 follow LanaM2 for daily gold updates ✨

GOLD HOLDS STRONG ABOVE $4,200! 🚀 XAUUSD DAILY MARKET ANALYSIS
Thursday, November 14, 2025
💰 GOLD HOLDS STRONG ABOVE $4,200! 📈
Current Price: $4,189 - $4,235 💎
Yesterday's Close: $4,231 (+0.86%)
Weekly Gain: +5.4% (MASSIVE!) 🔥
Status: 🟢 CONSOLIDATING AT HIGHS
🎯 MARKET UPDATE - WHAT'S HAPPENING NOW?
Gold is CONSOLIDATING above the critical $4,200 level after yesterday's explosive breakout! The market is catching its breath after a 5-day winning streak that pushed prices up over $330 from last month's lows.
Key Developments:
✅ Government Shutdown ENDED - US House passed funding bill
✅ Strong Above $4,200 - Holding key psychological level
✅ Fed Rate Cut at 80% - Economists now predicting December cut
✅ Four Consecutive Green Days - Bullish momentum intact
✅ Testing $4,235 - Approaching critical resistance zone
📊 TECHNICAL ANALYSIS
Market Structure: BULLISH CONSOLIDATION 🟢
The rally has paused for a healthy consolidation. This is NORMAL and HEALTHY after a 5.4% weekly gain. Gold is building a base for the next leg up!
Key Observation: Price is respecting the $4,189-$4,235 range today - this is a coiling pattern before the next move.
Critical Support Levels (BUY ZONES) 🔵
Support 1: $4,189 - $4,200 (MAJOR - Former resistance)
Support 2: $4,157 - $4,160 (Strong base)
Support 3: $4,114 - $4,120 (Key level)
Support 4: $4,048 - $4,060 (Breakout point)
Support 5: $3,987 - $4,002 (November open)
Key Resistance Levels (SELL/TARGET ZONES) 🔴
Resistance 1: $4,235 - $4,243 (Current test)
Resistance 2: $4,252 - $4,254 (Critical breakout level)
Resistance 3: $4,313 - $4,320 (Next target)
Resistance 4: $4,356 - $4,382 (All-time high zone)
📈 TECHNICAL INDICATORS
RSI (14): 64 (Bullish but cooling - Room to move higher) ✅
MACD: Positive and rising - Strong bullish signal ✅
Stochastic: Neutral zone - Allows for upward movement ✅
Moving Averages:
Price WELL ABOVE all EMAs ✅
EMA 20/50/200 all aligned bullish ✅
Golden Cross confirmed ✅
Volume: Strong on rallies, lighter on dips (Healthy) ✅
Bollinger Bands: Price near upper band - Volatility expansion mode
🎯 TODAY'S TRADING STRATEGIES
SCENARIO 1: BREAKOUT CONTINUATION 🚀 (65% Probability)
IF Gold Breaks Above $4,252:
This is the CRITICAL LEVEL to watch! A close above $4,252 signals resumption of the major uptrend.
LONG Setup:
Entry: Break and close above $4,252 with volume
Targets:
TP1: $4,313 📍 (+60 pips)
TP2: $4,356 📍 (+104 pips)
TP3: $4,382 📍 (+130 pips - All-time high retest)
Stop Loss: $4,210 (Below consolidation)
Risk/Reward: Excellent 1:3+ ratio ✅
SCENARIO 2: HEALTHY PULLBACK 📉 (35% Probability)
IF Gold Breaks Below $4,189:
A pullback would be healthy and provide better entry opportunities.
BUY THE DIP Strategy:
Entry Zone 1: $4,157-$4,170 (Best value)
Entry Zone 2: $4,114-$4,120 (Strong support)
Targets:
TP1: $4,200 📍
TP2: $4,243 📍
TP3: $4,280 📍
Stop Loss: Below $4,100
⚠️ NOTE: Dips are BUYING opportunities in this bullish trend!
💎 BEST TRADE SETUP FOR TODAY
CONSERVATIVE APPROACH (Recommended) 🎯
WAIT for one of these clear setups:
Option A - Breakout Trade:
Entry: Above $4,252 (confirmed break)
Target: $4,313 → $4,356
SL: $4,210
Option B - Pullback Trade:
Entry: $4,157-$4,170 (on dip)
Target: $4,243 → $4,280
SL: $4,135
DO NOT CHASE at $4,220-$4,240! Wait for clear direction.
🌍 FUNDAMENTAL ANALYSIS
BULLISH CATALYSTS ⬆️⬆️⬆️
✅ Fed Rate Cut Odds: 80% - Economists now strongly expect December cut
✅ Government Reopening - But delayed data creates uncertainty = Gold support
✅ Missing Economic Data - October CPI/jobs reports delayed/may never release
✅ Weak Labor Market - 11,000+ weekly job losses continue
✅ Dollar Weakness - DXY struggling at resistance
✅ Central Bank Demand - 634 tonnes purchased YTD, expecting 750-900 total
✅ ETF Inflows - $64 billion added in 2025
✅ Safe-Haven Demand - Geopolitical tensions persist
Risk Factors ⬇️
⚠️ Overbought Short-Term - RSI 64, near 70 threshold
⚠️ Profit Taking Risk - After 5-day rally (+5.4%)
⚠️ Resistance Zone - $4,235-$4,252 is strong barrier
⚠️ Data Clarity - If delayed data shows strength, could pressure gold
🔥 MARKET SENTIMENT: BULLISH WITH CAUTION
Analyst Consensus:
Short-term: Consolidation before next leg (Most likely)
Medium-term: Target $4,300-$4,400
Long-term: $4,700-$5,000 by 2026 (UBS/Goldman)
This Week:
Expected to test $4,252 resistance. Break above = Rally to $4,313+
End of November:
Analysts predict $4,230-$4,300 range
💡 PROFESSIONAL GAME PLAN
For DAY TRADERS:
⚡ Scalp the Range - Trade between $4,189-$4,235 with tight stops (20-30 pip targets)
Buy: $4,190-$4,200
Sell: $4,230-$4,235
Breakout: Above $4,252 → GO LONG aggressively
For SWING TRADERS:
📊 Wait for Clarity
Either breakout above $4,252 → Hold to $4,356
Or pullback to $4,157 → Buy for retest of $4,252
For LONG-TERM INVESTORS:
💎 Accumulate on Dips
Target: $4,150-$4,180 range
Goal: Hold for $4,500+ (2026 target)
Strategy: Dollar-cost averaging
📅 KEY EVENTS TO WATCH
THIS WEEK:
🎤 FOMC Speakers - Watch for rate cut signals
📊 Economic Data - Delayed reports may start releasing
🏛️ Government Funding - Impact on market sentiment
NEXT WEEK:
📈 November 21 - US Manufacturing & Services PMI
🎬 BOTTOM LINE (TL;DR)
Price: $4,189-$4,235 (Consolidating)
Bias: 🟢 BULLISH (Pullbacks are buying opportunities)
Key Level: $4,252 (Break this = Rally resumes)
Best Action: WAIT for breakout above $4,252 OR dip to $4,157
Risk Level: MEDIUM-HIGH (Volatility expected)
🔔 TODAY'S CRITICAL LEVELS
DO NOT CHASE between $4,220-$4,240!
BUY SIGNALS:
✅ Break above $4,252 with volume → GO LONG
✅ Dip to $4,157-$4,170 → BUY THE DIP
SELL SIGNAL:
❌ Break below $4,114 → Exit longs, potential reversal
NEUTRAL ZONE:
⚪ Between $4,189-$4,235 → Wait for direction
📊 TECHNICAL OUTLOOK
Trend: STRONGLY BULLISH ⬆️
Momentum: STRONG (but cooling) ⚡
Support: SOLID at $4,189-$4,200 🛡️
Resistance: TOUGH at $4,252 🚧
Pattern: Ascending channel with bullish flag forming
Next Move: Break $4,252 → Target $4,313-$4,382
⚠️ RISK MANAGEMENT RULES
✅ Position Size: Max 2% risk per trade
✅ Stop Loss: ALWAYS required - No exceptions!
✅ Take Profits: Lock 50% at TP1, trail rest
✅ Don't Chase: Wait for your setup patiently
✅ Respect $4,252: This is the make-or-break level
🎯 SWING TRADE SETUP (Multi-Day Hold)
Setup A - Breakout Play:
Entry: $4,254-$4,260 (after confirmed break)
Target 1: $4,313 (Hold 2-3 days)
Target 2: $4,356 (Hold 5-7 days)
Target 3: $4,382 (Hold 1-2 weeks)
Stop Loss: $4,210
Setup B - Pullback Play:
Entry: $4,150-$4,170 (if it dips)
Target 1: $4,243 (Hold 3-5 days)
Target 2: $4,313 (Hold 1 week)
Stop Loss: $4,120
🏆 PROFESSIONAL ANALYSIS SUMMARY
Gold has successfully rallied 5.4% this week and is now consolidating at the $4,200 psychological level. This is textbook healthy behavior after a strong rally.
The Setup:
Consolidation forms a bull flag pattern
Next move determines short-term direction
$4,252 is the line in the sand
Most Likely Scenario:
Brief consolidation (1-2 days) → Break above $4,252 → Rally to $4,313-$4,356
Alternative Scenario:
Healthy pullback to $4,157-$4,170 → Strong bounce → Retest $4,252
Either way, the TREND IS UP! 📈
💪 TRADING PSYCHOLOGY TIP
After a big rally, markets MUST consolidate. Don't panic if price pulls back slightly. Use dips as OPPORTUNITY, not fear. The trend is your friend - and this trend is BULLISH! 🚀
🎓 LESSON: THE BULL FLAG PATTERN
What we're seeing now is a BULL FLAG:
✅ Strong rally (flagpole) - Done
✅ Consolidation (flag) - Happening now
⏳ Breakout (continuation) - Coming soon!
Action: Wait for flag breakout above $4,252, then go LONG!
🔮 FORECAST
Today: Range between $4,180-$4,240
Tomorrow: Test of $4,252 or pullback to $4,157
This Week: Break $4,252 → Rally to $4,300+
End November: $4,280-$4,350 range
December: Potential retest of all-time high $4,382
⚠️ FINAL DISCLAIMER
This analysis is for educational and informational purposes only. Trading gold and forex involves substantial risk of loss. Never trade with money you cannot afford to lose. Always use proper risk management including stop losses. Past performance does not guarantee future results. Consult a financial advisor before making investment decisions.
📱 Like this analysis? Share it!
💬 Drop your trade setups in comments
🔔 Follow for daily 8:00 AM updates
👍 Hit that like button!
#Gold #XAUUSD #ForexTrading #TechnicalAnalysis #TradingView #GoldAnalysis #ForexSignals #DayTrading #SwingTrading #MarketAnalysis #BullFlag #TradingStrategy #GoldForecast

USDJPY - H4 | OutlookLooking at USDJPY I've noticed that it has been forming a rising wedge of sorts which could signal potential downward/bearish momentum (fueled by potential upcoming $ weakness).
Should the market successfully manage to breakout of the wedge and start moving towards the 153.2xx - 153.0xx area where if that were to play out we'd expect a potential correction/pullback to the 154.4xx - 154.6xx area to confirm the breakout, which is also where I'd start looking for potential bearish opportunities/entries.
But for now it'll be interesting to watch how the market plays out before taking any entries on USDJPY as it's still trading within the wedge and hasn't given any potential entry confirmations.

LiamTrading – XAUUSD M45 | Fibonacci Perspective on the ...LiamTrading – XAUUSD M45 | Fibonacci Perspective on the Uptrend: watch for a sell at 2.618 @ 4229–4231, wait to buy at FVG 4174–4172
Quick Context: News about the U.S. government reopening eases tensions, but gold prices in the Asian session this morning only rose slightly before moving sideways – accumulating. On M45, the triangle has broken upwards but the buying momentum hasn't truly exploded; the market might retest the Fair Value Gaps (FVG) before choosing the next direction.
Technical Analysis
Trendline & M45 Structure: The uptrend after the breakout is running along a short-term rising trendline; the old triangle top becomes resistance near 4215.
Fibonacci Extension:
2.272 ≈ 4215: pivot point; staying above this level opens the path to higher levels.
2.618 ≈ 4229–4231: extended resistance – an area prone to rejection/short-term reversal.
FVG & Liquidity Zones:
FVG #1: 4195–4198 – likely to fill before continuing upward.
Liquidity: 4184–4188 – volume attraction zone between FVG and trendline.
Fibo 0.618 + FVG: 4172–4174 – strong confluence for a buy-back scenario following the trend.
Invalidation Level: breaking 4166 weakens the M45 uptrend structure, risking a pullback to lower zones.
Trading Scenarios
Scenario 1 – Trend-following Buy (priority)
Entry: 4172–4174 (Fibo 0.618 + FVG)
SL: 4166
TP: 4190 → 4215 → 4240 → 4280
Note: Prioritize if a clear rejection/long lower wick candle appears at 417x.
Scenario 2 – Counter-trend Sell Scalp at Extended Resistance
Entry: 4229–4231 (Fibo 2.618)
SL: 4236 (above the nearest peak)
TP: 4215 → 4196 → 4186 → 4175
Note: Quick trade; abandon if M45 closes strongly above 4231–4233.
Scenario 3 – Buy on Break & Hold of 4215
Condition: M45 closes above 4215, retest holds 4212–4216
Entry: 4216–4218
SL: 4207
TP: 4229–4231 → 4260 → 4285–4300
Which price zone do you find noteworthy today? Comment below & hit Follow on LiamTrading for the latest updates.

Trades on 4H candles, confirmation on 1H and entry on 15MAs easy as marking the wicks, marking fibonacci and waiting for their reaction in key support or resistance zones on the 4H chart, with a bounce and breakout accompanied by good volume, we have reliable short-duration trades.

NZDUSD: Bearish Forecast & Bearish Scenario
The charts are full of distraction, disturbance and are a graveyard of fear and greed which shall not cloud our judgement on the current state of affairs in the NZDUSD pair price action which suggests a high likelihood of a coming move down.
Disclosure: I am part of Trade Nation's Influencer program and receive a monthly fee for using their TradingView charts in my analysis.
❤️ Please, support our work with like & comment! ❤️

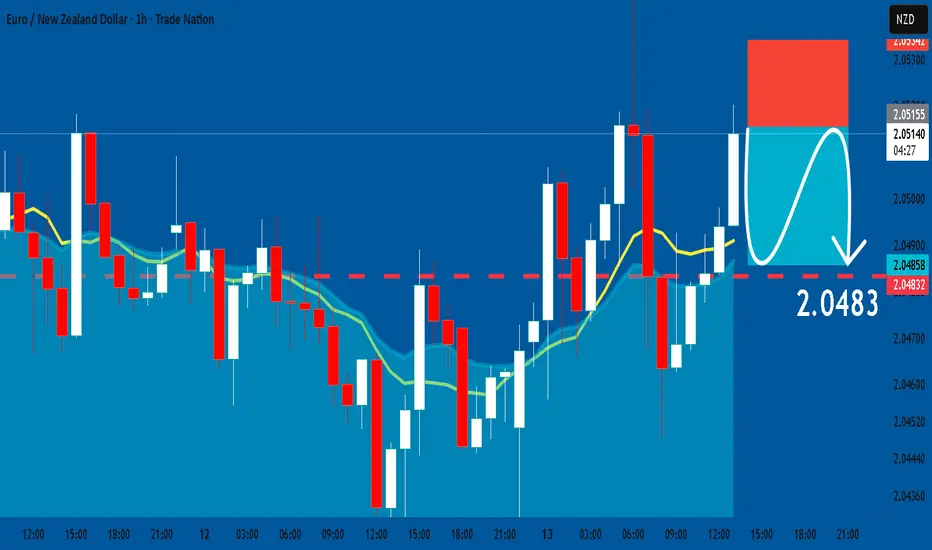
EURNZD: Short Trade with Entry/SL/TP
EURNZD
- Classic bearish formation
- Our team expects fall
SUGGESTED TRADE:
Swing Trade
Sell EURNZD
Entry Level - 2.0515
Sl - 2.0534
Tp -2.0483
Our Risk - 1%
Start protection of your profits from lower levels
Disclosure: I am part of Trade Nation's Influencer program and receive a monthly fee for using their TradingView charts in my analysis.
❤️ Please, support our work with like & comment! ❤️
CADCHF Technical Analysis! BUY!
My dear subscribers,
This is my opinion on the CADCHF next move:
The instrument tests an important psychological level 0.5682
Bias - Bullish
Technical Indicators: Supper Trend gives a precise Bullish signal, while Pivot Point HL predicts price changes and potential reversals in the market.
Target - 0.5706
About Used Indicators:
On the subsequent day, trading above the pivot point is thought to indicate ongoing bullish sentiment, while trading below the pivot point indicates bearish sentiment.
Disclosure: I am part of Trade Nation's Influencer program and receive a monthly fee for using their TradingView charts in my analysis.
———————————
WISH YOU ALL LUCK

EURCAD My Opinion! SELL!
My dear friends,
My technical analysis for EURCAD is below:
The market is trading on 1.6263 pivot level.
Bias - Bearish
Technical Indicators: Both Super Trend & Pivot HL indicate a highly probable Bearish continuation.
Target - 1.6246
Recommended Stop Loss - 1.6272
About Used Indicators:
A pivot point is a technical analysis indicator, or calculations, used to determine the overall trend of the market over different time frames.
Disclosure: I am part of Trade Nation's Influencer program and receive a monthly fee for using their TradingView charts in my analysis.
———————————
WISH YOU ALL LUCK

XAUUSD: Potential Bearish Reversal from 4H Fair Value Gap (FVG)Key Observations and Analysis
Recent Market Structure: The price action showed signs of accumulation near the lows (indicated by the (SMT) or Smart Money Trap/Swing point) and then broke a previous swing high (marked as MSS or Market Structure Shift), confirming a strong shift to a bullish trend recently.
Impulsive Rally and Break of Structure (BOS): The strong upward movement created new highs and broke a previous resistance level (marked as BOS or Break of Structure), confirming the continuation of the short-term bullish momentum.
The 4H Fair Value Gap (4H / FVG): The large gray shaded rectangle is labeled as a 4H / FVG (Fair Value Gap), also sometimes referred to as an Imbalance. This is an area where the market moved very quickly, leaving a price inefficiency (a gap between the high/low of specific candles). These gaps are often viewed as magnets that the price will return to in order to "fill" or "mitigate" the inefficiency before continuing its trend or reversing.
Bearish Scenario (The Setup):
The price has aggressively moved up and is currently near the lower boundary of the 4H / FVG.
The setup suggests a Contraction (CRT) phase. The high of this potential contraction is labeled CRT-L (Contraction Low, but likely indicating the upper boundary of the trade range).
The large green arrow shows the anticipated move: a reversal upon entering or touching the FVG/Supply Zone, leading to a move down to target the recent low of the strong rally (labeled CRT-H, indicating the high of the previous move/target low).
The target for the potential retracement is the area around the previous BOS level and the swing low that initiated the final push, around $4,120.00.
Interpretation: The chart suggests that the recent strong rally might be due for a deep retracement or even a short-term reversal, as the price is entering a potential supply/distribution zone created by the Fair Value Gap.
Conclusion
The chart presents a trade idea based on the mitigation of the 4H Fair Value Gap. A bearish entry is anticipated once the price fully enters the FVG, with the aim of capturing the move back down to the recent structure low (CRT-H). This is a common setup in SMC analysis, expecting the market to re-balance before the next major move.

EURCHF: Bullish Continuation
Our strategy, polished by years of trial and error has helped us identify what seems to be a great trading opportunity and we are here to share it with you as the time is ripe for us to buy EURCHF.
Disclosure: I am part of Trade Nation's Influencer program and receive a monthly fee for using their TradingView charts in my analysis.
❤️ Please, support our work with like & comment! ❤️

GOLD: Bearish Continuation & Short Signal
GOLD
- Classic bearish formation
- Our team expects pullback
SUGGESTED TRADE:
Swing Trade
Short GOLD
Entry - 4232.5
Sl - 4252.7
Tp - 4194.9
Our Risk - 1%
Start protection of your profits from lower levels
Disclosure: I am part of Trade Nation's Influencer program and receive a monthly fee for using their TradingView charts in my analysis.
❤️ Please, support our work with like & comment! ❤️

GBPCHF Expected Growth! BUY!
My dear friends,
Please, find my technical outlook for GBPCHF below:
The price is coiling around a solid key level - 1.0459
Bias - Bullish
Technical Indicators: Pivot Points High anticipates a potential price reversal.
Super trend shows a clear buy, giving a perfect indicators' convergence.
Goal - 1.0513
About Used Indicators:
The pivot point itself is simply the average of the high, low and closing prices from the previous trading day.
Disclosure: I am part of Trade Nation's Influencer program and receive a monthly fee for using their TradingView charts in my analysis.
———————————
WISH YOU ALL LUCK

BREAKING NEWS - GOLD SURGES ABOVE $4,200!🔥 XAUUSD DAILY MARKET ANALYSIS
Wednesday, November 13, 2025
💰 BREAKING NEWS - GOLD SURGES ABOVE $4,200! 🚀
Current Price: $4,187 - $4,210 ⬆️⬆️⬆️
Daily Change: +2% (UP 80+ PIPS!) 📈
Opening Price: $4,127
Today's Range: $4,098 - $4,210
Status: 🟢 STRONG BULLISH MOMENTUM
🎯 WHAT HAPPENED TODAY?
EXPLOSIVE RALLY! Gold has BLASTED through the $4,200 barrier for the first time in THREE WEEKS! This is a massive breakout after consolidating below $4,160 resistance for days.
Why Gold is Surging:
🇺🇸 US Government Shutdown Ending - Senate passed deal, House voting today (7 PM ET)
💵 Dollar Weakness - USD giving back gains, DXY falling to 99.60
📉 Treasury Yields Dropping - 10-year yield falling, boosting gold appeal
💼 Fed Rate Cut Bets SURGING - Now 68% probability for December cut (up from 62%)
📊 Weak Jobs Data - 11,000+ jobs cut weekly through October
🔥 NO CPI DATA TODAY - Government shutdown delayed critical data, creating uncertainty = GOLD UP!
📊 TECHNICAL ANALYSIS
Market Structure: BULLISH BREAKOUT 🟢🟢🟢
✅ Gold broke above $4,160 resistance with STRONG volume
✅ Price now testing $4,210 - new 3-week high
✅ Bullish trend confirmed - 5 consecutive green days!
✅ All moving averages pointing UP
Key Support Levels (BUY ZONES)
🔵 Support 1: $4,157 - $4,160 (Former resistance, now support - STRONG)
🔵 Support 2: $4,120 - $4,127 (Today's open - Critical)
🔵 Support 3: $4,098 - $4,100 (Today's low - Major)
🔵 Support 4: $4,048 - $4,039 (Breakout base)
Key Resistance Levels (TAKE PROFIT ZONES)
🔴 Resistance 1: $4,210 - $4,220 (Current test)
🔴 Resistance 2: $4,243 - $4,254 (Next target)
🔴 Resistance 3: $4,307 (October channel high)
🔴 Resistance 4: $4,374 - $4,381 (All-time high)
📈 TECHNICAL INDICATORS
RSI (14): 67 (Bullish momentum, not overbought yet) ✅
MACD: Strong bullish crossover - BUY signal confirmed ✅
Moving Averages:
Price ABOVE all major EMAs ✅
EMA 20/50/200 all pointing UP ✅
Golden Cross pattern forming ✅
Volume: INCREASING on breakout - Strong conviction ✅
🎯 TRADING STRATEGIES FOR TODAY
SCENARIO 1: CONTINUATION PLAY 🚀 (70% Probability)
IF Gold Holds Above $4,160:
LONG Entry Options:
Aggressive: BUY NOW at $4,187-$4,200
TP1: $4,243 📍 (+56 pips)
TP2: $4,280 📍 (+93 pips)
TP3: $4,307 📍 (+120 pips)
SL: $4,155 (Below breakout level)
Conservative: WAIT for pullback to $4,160-$4,170
TP1: $4,210 📍
TP2: $4,254 📍
TP3: $4,307 📍
SL: $4,140
Risk/Reward: 1:3 ratio minimum ✅
SCENARIO 2: FAKE BREAKOUT 📉 (30% Probability)
IF Gold Breaks Below $4,160:
SHORT Setup:
Entry: Break below $4,157 with volume
Targets:
TP1: $4,127 📍
TP2: $4,098 📍
TP3: $4,048 📍
Stop Loss: $4,175
⚠️ NOTE: This is AGAINST the trend, so smaller position size recommended!
🌍 FUNDAMENTAL CATALYSTS TODAY
BULLISH FACTORS ⬆️⬆️⬆️
✅ US Shutdown Resolution - Creates positive sentiment but maintains uncertainty
✅ Fed Dovish Pivot - 68% chance December rate cut (was 62% yesterday)
✅ Weak Employment Data - 11,000+ weekly job losses supporting rate cuts
✅ Dollar Weakness - DXY down 0.14% to 99.60
✅ Lower Bond Yields - Making non-yielding gold more attractive
✅ No CPI Data - Delayed economic data = uncertainty = GOLD RALLY
✅ Central Bank Buying - Continuous institutional demand
✅ Consumer Sentiment LOW - Lowest since June 2022 (50.3)
BEARISH RISKS ⬇️
⚠️ Overbought Technically - RSI approaching 70
⚠️ Profit Taking Risk - After +2% move in one day
⚠️ Resistance at $4,210 - Previous highs may cap gains
⚠️ US-China Tensions Easing - Reducing safe-haven premium
🔥 MARKET SENTIMENT: EXTREMELY BULLISH
Analyst Targets for End 2025:
Conservative: $4,300
Base Case: $4,400-$4,500
Bullish: $4,700-$5,000 (UBS/Goldman Sachs)
This Week's Targets:
Short term: $4,243-$4,254
Medium term: $4,307
Aggressive: Retest $4,381 all-time high
💡 TODAY'S GAME PLAN
For ACTIVE Traders:
🎯 BUY THE BREAKOUT - If you're aggressive, enter around $4,190-$4,200 with tight stop at $4,155. Target $4,243 first, then $4,280.
For CONSERVATIVE Traders:
⏰ WAIT FOR PULLBACK - Let price retrace to $4,160-$4,170, then enter LONG. This is safer with better risk/reward.
For SCALPERS:
⚡ Trade the Range - If price consolidates between $4,180-$4,210, scalp between these levels with tight stops (15-20 pip targets).
📅 KEY EVENTS TO WATCH
TODAY:
⏰ 7:00 PM ET - US House vote on shutdown (CRITICAL!)
Expect volatility around this news
THIS WEEK:
Fed speakers (watch for rate cut signals)
US economic data releases (delayed but coming)
Government shutdown resolution impact
📊 PROFESSIONAL ANALYSIS
Current Market Phase: BREAKOUT & EXPANSION 🚀
Gold has successfully broken out of the $4,080-$4,160 consolidation range that held for a week. The move is supported by:
Strong fundamental backdrop
Technical confirmation
Institutional buying
Retail FOMO (fear of missing out)
Key Level: $4,160 is now the LINE IN THE SAND. As long as gold holds above this level, the trend is UP. A close below $4,160 would signal caution.
🎬 BOTTOM LINE (TL;DR)
BIAS: 🟢 STRONGLY BULLISH
ACTION: BUY DIPS (Don't chase at $4,210!)
BEST ENTRY: $4,160-$4,170 on pullback
TARGET: $4,243 → $4,307 → $4,374
STOP LOSS: Below $4,155
RISK LEVEL: MEDIUM (High volatility expected)
🔔 TRADING TIPS
✅ Don't Chase - Wait for pullbacks to $4,160-$4,170
✅ Use Stop Loss - ALWAYS protect your capital
✅ Take Partial Profits - Lock in gains at each target level
✅ Manage Risk - Never risk more than 2% per trade
✅ Watch $4,160 - This is your key support now
⚠️ RISK MANAGEMENT RULES
Position Size: Max 2% of account per trade
Stop Loss: MANDATORY (Never trade without it)
Take Profit: Lock in 50% at TP1, let rest run
Trailing Stop: Once in 50+ pips profit, trail stop
🎯 SWING TRADER SETUP
Entry: $4,160-$4,170 (Wait for pullback)
Target 1: $4,254 (Hold 3-5 days)
Target 2: $4,307 (Hold 1 week)
Target 3: $4,381 (Hold 2-3 weeks)
Stop Loss: $4,120 (Wider for swing trade)
🏆 CONCLUSION
Today is a MAJOR breakout day for gold! The technical and fundamental stars are aligned for continued upside. However, be PATIENT - don't chase the price at $4,210. Wait for a healthy pullback to $4,160-$4,170 for optimal entry.
The trend is YOUR FRIEND - and right now, that trend is pointing UP! 📈🚀
⚠️ DISCLAIMER
This analysis is for educational purposes only. Trading involves significant risk. Always use proper risk management and never risk money you cannot afford to lose. Past performance does not guarantee future results.
📱 Follow for daily updates at 8:00 AM
💬 Share your trades in comments
🔔 Hit the bell for real-time alerts
👍 Like if this helped you!
#Gold #XAUUSD #ForexTrading #TechnicalAnalysis #TradingView #GoldBreakout #ForexSignals #DayTrading #SwingTrading #MarketAnalysis #TradingStrategy

XAUUSD – REFERENCE SCENARIO FOR NOVEMBER 13 – MONITORING ...💛 XAUUSD – REFERENCE SCENARIO FOR NOVEMBER 13 – MONITORING ELLIOTT WAVE 5 🎯
🌤 Overview
Hello everyone 💬
Gold is currently trading around the 4210 region, indicating that the upward momentum has slowed after two strong days of gains.
According to Elliott Wave, wave 5 may not have ended yet, and this area is becoming a strong resistance level – where prices could accumulate or adjust at any moment.
Besides technical factors, political news from the U.S. administration is causing significant USD volatility, leading to a wide fluctuation range for gold in the short term. Therefore, today it is crucial to prioritize risk management and monitor price reactions in the 4210–4260 region.
💹 Technical Analysis
📈 On the H4 chart, gold is approaching the resistance zone of 4210–4260, which also coincides with the 0.236 Fibonacci level and the previous FVG area.
🟣 A bearish view (ABC correction) will be confirmed if the price breaks below 4180 – targeting an adjustment to 4120–4050.
🔹 A bullish view remains valid if the H4 candle closes above 4212, in which case the trend may extend to 4250–4280.
🎯 Reference Trading Plan
💖 BUY Scenario (on breakout)
Entry: 4230–4232 | SL: 4225
TP: 4165 – 4190 – 4250
💢 SELL Scenario (reaction at resistance)
Entry: 4265–4267 | SL: 4273
TP: 4249 – 4215 – 4200
⚠️ Important Notes
Closely monitor reactions at the levels: 4246 – 4212 – 4260 – 4280.
USD is highly volatile due to political factors, which may cause rapid fluctuations in gold.
🌷 Gold is in a critical transition zone – Elliott wave 5 may soon conclude or expand further 💛
Be patient for clear confirmation, as even a small deviation at this stage can change the entire price structure.
If you find this useful, please 💛 like – 💬 comment – 🔔 follow LanaM2 to stay updated with daily gold insights ✨

XAU/USD OUTLOOK – TODAY 11/13/25The U.S. House has approved the reopening of the government, now awaiting President Trump's signature. This means U.S. economic data will gradually be released again, promising a week of strong and unpredictable volatility.
Technically, gold maintains an upward trend after breaking the H4 sideways boundary, but signs of overbought conditions and H4 peak divergence are emerging.
In smaller frames (M30 – H1), light divergence is also starting to appear, so BUY positions need to select favorable zones and avoid FOMO. SELL should only be short reactive trades.
🎯 Daily Scenario
Morning
Expect sideways movement ~30 points within the 4180 – 4212 range
You can WATCH FOR TRADING WITHIN THIS RANGE
if the price breaks through 4212, consider waiting for a retest back to 4205 to buy up.
Afternoon
Wait for gold to adjust to reasonable BUY zones:
4160 – 4162
4152 – 4148
4123 – 4120
If there is a strong adjustment:
Beautiful BUY at 4070 – 4040 (deep support zone).
🎯 Target increase:
4280 – 4285
4300 – 4305
🎯 Reactive SELL:
4255, 428X, 430X
(SL 10 – TP 10)
⚠️ Important Note
The overall trend remains uptrend, but attention is needed:
H4 shows signs of overbought + peak divergence.
M30 – H1 shows light divergence, indicating the market may have a short adjustment before continuing to rise.
BUY should only be entered at beautiful support zones, if you see a bad candle → close short and exit quickly.
SELL is only reactive at strong resistance zones, do not hold long.

XAUUSD Daily Chart Analysis: Potential Reversal from Premium FVGKey Observations & SMC Components
Strong Bullish Trend: The price experienced a significant rally leading up to the high on October 20th.
Break of Structure (BOS): The price recently broke above a previous swing high, marked as BOS (Break of Structure). This indicates a continuation of the short-term bullish momentum or a shift from bearish to bullish on lower timeframes.
Inefficiency/Fair Value Gap (D / FVG): The shaded gray area is identified as a D / FVG (Daily / Fair Value Gap). This area represents an imbalance in the market, often targeted for a price reaction or fill. Since the price is currently trading above the previous consolidation (near the high of the recent range), this FVG is considered to be in a Premium area.
Current Price Action: The price has moved into the lower part of the FVG.
Liquidity Grab/Equal Lows (X): The level marked X represents a prior swing high that was swept by the subsequent move, which then led to the BOS. It may also represent an area of liquidity (e.g., stops placed below that swing high) that was recently taken.
Projected Move (Arrow): The black arrow suggests a potential short trade from within the FVG, targeting the area indicated by the dotted line below the most recent swing high. This target likely represents a liquidity void or the internal liquidity of the most recent up move (perhaps an equal low or an old FVG/Imbalance on a lower timeframe).
Interpretation and Potential Scenario
The analysis suggests a trader is looking for a reaction/reversal from the Daily Fair Value Gap (FVG) in the Premium area.
Entry Trigger: The trader would likely look for a bearish confirmation (e.g., a change of character/market structure shift on a lower timeframe like H4 or H1) once the price is fully within or near the top of the FVG.
Target: The projected target (dotted line) suggests a move to correct the recent impulsive up-leg, potentially aiming for an internal liquidity point or the recent higher low before a potential continuation of the broader bullish trend, or even a deeper retracement.
In summary, the chart outlines a high-probability SMC short setup based on a retracement into a Premium FVG.
