USDJPY Under Pressure! SELL!
My dear friends,
Please, find my technical outlook for USDJPY below:
The price is coiling around a solid key level - 154.18
Bias - Bearish
Technical Indicators: Pivot Points High anticipates a potential price reversal.
Super trend shows a clear sell, giving a perfect indicators' convergence.
Goal - 153.86
Safe Stop Loss - 154.35
About Used Indicators:
The pivot point itself is simply the average of the high, low and closing prices from the previous trading day.
Disclosure: I am part of Trade Nation's Influencer program and receive a monthly fee for using their TradingView charts in my analysis.
———————————
WISH YOU ALL LUCK
Tecnicalanalysis

XAUUSD – PRIORITIZE BUYING, TARGET 4040XAUUSD – PRIORITIZE BUYING, TARGET 4040 🎯
🌤 1. Overview
Hello everyone 💬
My perspective on gold today is still to prioritize buying, as there hasn't been a clear deep decline.
The price is currently consolidating in a narrow range, needing more time to build momentum before breaking out.
I will wait to buy again at the OB area – where there is high liquidity, this is a zone likely to see strong price reactions.
The best scenario today: the price may sell off slightly at FVG, then drop to OB to trigger the buy setup.
💹 2. Technical Analysis (ICT Perspective)
💜 Price Structure: Gold still maintains a short-term uptrend, the main trend hasn't been broken.
💎 Liquidity: Liquidity is concentrated below the 3940 area – a potential buying OB.
💫 FVG: The 3975–3980 area is a zone where a slight bearish reaction may occur.
⚙️ Order Block (OB): 3938–3945 is a crucial support zone, with the potential for a strong price rebound from here.
📈 Main Target: 4040 – a high liquidity zone, coinciding with a large frame FVG.
🎯 3. Reference Trading Scenarios
💢 Short SELL (scalping)
Entry: 3980 | SL: 3988
TP: 3972 – 3960 – 3940
💖 Main BUY (priority)
Entry: 3940 | SL: 3932
TP: 3952 – 3968 – 3990 – 4012 – 4035
✨ 4. Important Notes
🔹 Observe price reactions at FVG and OB before taking action.
🔹 If the price exceeds 3988, the bearish scenario is temporarily invalidated.
🔹 The main direction is still to buy according to the Smart Money trend – only consider short selling when confirmed.
🌷 5. Conclusion & Interaction with LanaM2
Gold is still following the Smart Money Flow trajectory,
patiently waiting for the price to reach a favorable zone to act 💪
This is not an investment recommendation, just a personal perspective based on the ICT method.
If you find it useful, please 💛 like – 💬 comment – 🔔 follow LanaM2
to stay updated with the latest gold insights every day.

XAU/USD (Gold) 15-Min Chart AnalysisCurrent Price: $4,005
Resistance Zone: $4,020 – $4,040
Gold is approaching a strong resistance area that previously triggered a pullback.
Trend Structure:
The market is moving inside a short-term ascending channel, but momentum shows signs of exhaustion near the upper boundary.
Key Observation:
A false breakout or rejection at the resistance could initiate a downward correction.
Bearish Signal Setup:
Entry Zone (Sell): $4,015 – $4,035 (look for rejection candles or bearish engulfing near resistance)
Target 1: $3,960
Target 2 (Main Target): $3,913
Stop Loss: $4,045 above resistance zone
Risk/Reward Ratio: Approx. 1:2.5
Confirmation:
Wait for bearish confirmation candle on 15M or 30M timeframe.
Break below $3,980 will strengthen bearish momentum toward target.
Signal Summary (📉 Sell Setup):
Direction Entry TP1 TP2 SL
🔻 SELL 4,015 – 4,035 3,960 3,913 4,045 TMX:SXF1! TMX:CRA1! TMX:SXA1! TMX:FHO1! TMX:CGF1! TMX:CGZ1! TMX:FBA1! TMX:FSH1! TMX:SXM1! TMX:SXM1! TMX:FFL1! TMX:FOP1! TMX:FRW1! TMX:FFV1! TMX:FEQ1! TMX:FRQ1!

NZDJPY: Bullish Continuation is Highly Probable! Here is Why:
The recent price action on the NZDJPY pair was keeping me on the fence, however, my bias is slowly but surely changing into the bullish one and I think we will see the price go up.
Disclosure: I am part of Trade Nation's Influencer program and receive a monthly fee for using their TradingView charts in my analysis.
❤️ Please, support our work with like & comment! ❤️

EURCHF: Bullish Continuation & Long Trade
EURCHF
- Classic bullish pattern
- Our team expects retracement
SUGGESTED TRADE:
Swing Trade
Buy EURCHF
Entry - 0.9292
Stop - 0.9285
Take - 0.9306
Our Risk - 1%
Start protection of your profits from lower levels
Disclosure: I am part of Trade Nation's Influencer program and receive a monthly fee for using their TradingView charts in my analysis.
❤️ Please, support our work with like & comment! ❤️

Bitcoin (BTC/USD) Market Analysis | November 2025The overall bias remains unchanged from the previous outlook. After BTC touched the 103,500 level on Oct 17, 2025, we saw a brief bullish push toward the 116,329 resistance zone.
However, price was rejected three times, and the daily candle never closed above this level — confirming it as a strong supply zone.
🔹 The rejection aligns perfectly with the 50% Fibonacci retracement, adding solid confluence to the bearish move that followed.
🔹 BTC has now returned to the key area of interest between 104,700 – 90,000, which stands as the final zone to defend for any long-term bullish continuation.
A clear break and daily close below 90,000 would likely invalidate the bullish structure and open the door for deeper downside movement.
#Bitcoin #BTCUSD #CryptoAnalysis #PriceAction #TechnicalAnalysis #Fibonacci #SupportAndResistance #TradingView #CryptoMarket #SwingTrading #MarketUpdate

EURUSD: Growth & Bullish Continuation
It is essential that we apply multitimeframe technical analysis and there is no better example of why that is the case than the current EURUSD chart which, if analyzed properly, clearly points in the upward direction.
Disclosure: I am part of Trade Nation's Influencer program and receive a monthly fee for using their TradingView charts in my analysis.
❤️ Please, support our work with like & comment! ❤️

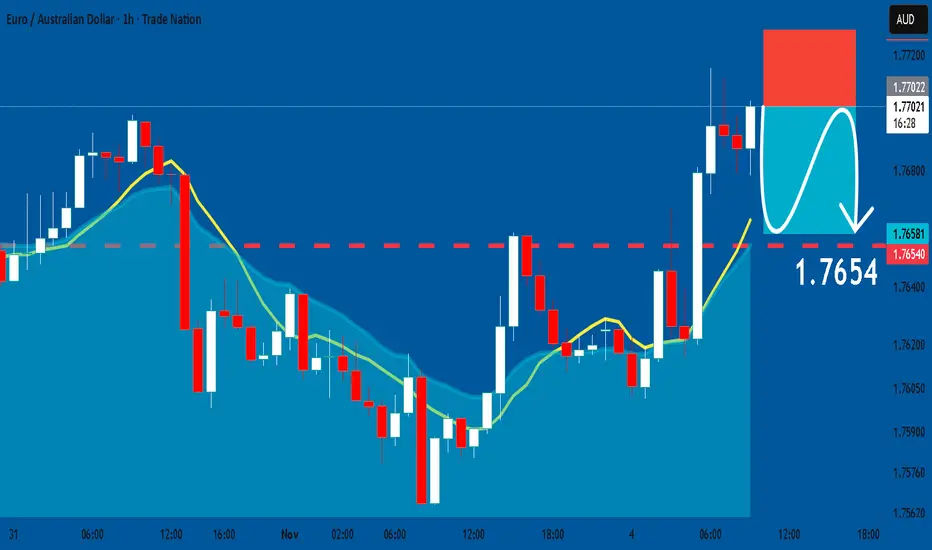
EURAUD: Short Signal Explained
EURAUD
- Classic bearish formation
- Our team expects fall
SUGGESTED TRADE:
Swing Trade
Sell EURAUD
Entry Level - 1.7701
Sl - 1.7728
Tp - 1.7654
Our Risk - 1%
Start protection of your profits from lower levels
Disclosure: I am part of Trade Nation's Influencer program and receive a monthly fee for using their TradingView charts in my analysis.
❤️ Please, support our work with like & comment! ❤️
USDCAD Technical Analysis! SELL!
My dear subscribers,
My technical analysis for USDCAD is below:
The price is coiling around a solid key level - 1.4067
Bias - Bearish
Technical Indicators: Pivot Points Low anticipates a potential price reversal.
Super trend shows a clear sell, giving a perfect indicators' convergence.
Goal - 1.4013
About Used Indicators:
By the very nature of the supertrend indicator, it offers firm support and resistance levels for traders to enter and exit trades. Additionally, it also provides signals for setting stop losses
Disclosure: I am part of Trade Nation's Influencer program and receive a monthly fee for using their TradingView charts in my analysis.
———————————
WISH YOU ALL LUCK

EURNZD: Market of Sellers
The charts are full of distraction, disturbance and are a graveyard of fear and greed which shall not cloud our judgement on the current state of affairs in the EURNZD pair price action which suggests a high likelihood of a coming move down.
Disclosure: I am part of Trade Nation's Influencer program and receive a monthly fee for using their TradingView charts in my analysis.
❤️ Please, support our work with like & comment! ❤️

AUDUSD My Opinion! BUY!
My dear followers,
I analysed this chart on AUDUSD and concluded the following:
The market is trading on 0.6526 pivot level.
Bias - Bullish
Technical Indicators: Both Super Trend & Pivot HL indicate a highly probable Bullish continuation.
Target - 0.6565
About Used Indicators:
A super-trend indicator is plotted on either above or below the closing price to signal a buy or sell. The indicator changes color, based on whether or not you should be buying. If the super-trend indicator moves below the closing price, the indicator turns green, and it signals an entry point or points to buy.
Disclosure: I am part of Trade Nation's Influencer program and receive a monthly fee for using their TradingView charts in my analysis.
———————————
WISH YOU ALL LUCK

AUDJPY Set To Grow! BUY!
My dear followers,
This is my opinion on the AUDJPY next move:
The asset is approaching an important pivot point 100.66
Bias - Bullish
Safe Stop Loss - 100.57
Technical Indicators: Supper Trend generates a clear long signal while Pivot Point HL is currently determining the overall Bullish trend of the market.
Goal - 100.83
About Used Indicators:
For more efficient signals, super-trend is used in combination with other indicators like Pivot Points.
Disclosure: I am part of Trade Nation's Influencer program and receive a monthly fee for using their TradingView charts in my analysis.
———————————
WISH YOU ALL LUCK

CHFJPY: Expecting Bullish Movement! Here is Why:
The analysis of the CHFJPY chart clearly shows us that the pair is finally about to go up due to the rising pressure from the buyers.
❤️ Please, support our work with like & comment! ❤️

GOLD: Bearish Continuation & Short Signal
GOLD
- Classic bearish pattern
- Our team expects retracement
SUGGESTED TRADE:
Swing Trade
Sell GOLD
Entry - 4001.7
Stop - 4011.35
Take - 3985.2
Our Risk - 1%
Start protection of your profits from lower levels
Disclosure: I am part of Trade Nation's Influencer program and receive a monthly fee for using their TradingView charts in my analysis.
❤️ Please, support our work with like & comment! ❤️

GBPCHF Trading Opportunity! SELL!
My dear friends,
GBPCHF looks like it will make a good move, and here are the details:
The market is trading on 1.0605 pivot level.
Bias - Bearish
Technical Indicators: Supper Trend generates a clear short signal while Pivot Point HL is currently determining the overall Bearish trend of the market.
Goal - 1.0571
About Used Indicators:
Pivot points are a great way to identify areas of support and resistance, but they work best when combined with other kinds of technical analysis
Disclosure: I am part of Trade Nation's Influencer program and receive a monthly fee for using their TradingView charts in my analysis.
———————————
WISH YOU ALL LUCK

EURUSD Will Explode! BUY!
My dear friends,
Please, find my technical outlook for EURUSD below:
The instrument tests an important psychological level 1.1515
Bias - Bullish
Technical Indicators: Supper Trend gives a precise Bullish signal, while Pivot Point HL predicts price changes and potential reversals in the market.
Target - 1.1538
Recommended Stop Loss - 1.1503
About Used Indicators:
Super-trend indicator is more useful in trending markets where there are clear uptrends and downtrends in price.
Disclosure: I am part of Trade Nation's Influencer program and receive a monthly fee for using their TradingView charts in my analysis.
———————————
WISH YOU ALL LUCK

LiamTrading - $XAUUSD$: Second Scenario – BUY Priority After...LiamTrading - OANDA:XAUUSD $: Second Scenario – BUY Priority After BREAKING $4002$
With Support from the U.S. Treasury Secretary
Hello traders community, LiamTrading is back with a detailed analysis of OANDA:XAUUSD $ for the start of the week!
The Gold market is receiving strong support from policy: U.S. Treasury Secretary Scott Bessent calls on the Fed to continue cutting interest rates as PCE inflation is currently at $2.7\%$.
This call, aimed at reducing mortgage rates and supporting the housing market, strengthens the long-term outlook for Gold.
Technical Analysis: We prioritize continuing to buy in line with the main trend. The best strategy is to enter at strong resistance/support zones to ensure the lowest risk.1.
📰 MACRO FUNDAMENTALS: CALL FOR RATE CUT
Impact: The Treasury Secretary's statement on cutting interest rates to support the "transitioning" economy increases expectations for policy easing, which is a strong support factor for Gold (though not yet an official decision).
Suitable Strategy: Market sentiment is being driven by expectations of policy easing, reinforcing the priority for a BUY (Long) position.
📊 TECHNICAL ANALYSIS: IMPORTANT PIVOT POINT
Resistance Zone $4002$: This area acts as an important pivot point.
Buy Entry will be activated after the price breaks $4002$ and retests.
Sell Entry: Look for short-term scalping at the resistance zone $4030$ to secure profits. Highlighted Zone: Prioritize entries at confirmed Trendline zones.
🎯 DETAILED TRADING PLAN (ACTION PLAN)
We will wait for Gold to break structure and create a BUY setup.
🟢 Main BUY Scenario (BUY Break & Retest)
Logic: Buy at $4002$ after breaking resistance and retesting, leveraging new upward momentum.
Entry (BUY): $4002$
SL: $3995$ (tight SL)
TP1/TP2: $4020$ | $4035$
TP3: $4070$
🔴 SCALPING SELL Scenario (SELL Scalping)
Logic: Short-term scalping at the strong resistance zone $4030$ (near Sell Liquidity zone).
Entry (SELL): $4030$
SL: $4038$
TP1/TP2: $4015$ | $4004$
TP3: $3990$4.
📌 SUMMARY & DISCIPLINE (Liam's Note)
Our BUY strategy is reinforced by policy outlook and technical breakout at $4002$. Strictly adhere to SL $3995$ to manage risk before the upward structure is confirmed.
Are you ready for Gold's movement at $4002$? Please LIKE and COMMENT!

LiamTrading - $XAUUSD$: NEW WEEK TRADING SCENARIO...LiamTrading - OANDA:XAUUSD $: NEW WEEK TRADING SCENARIO – PRIORITIZE SELLING After BREAKING THE TRENDLINE
Hello traders community,
The new week opens with a clear strategy: Prioritize SELLING after Gold has broken the previous upward trendline.
Although fundamental economic news (such as interest rate policies and politics) supports Gold potentially reaching $5,000$ USD, we must trade according to
current Price Action. Technical selling pressure is strong. We will SELL at key resistance areas and continue SELLING when the price breaks the downward structure.
📰 FUNDAMENTALS & LONG-TERM OUTLOOK
Prospect of $5,000$: Fundamental and political factors still support the scenario of Gold reaching $5,000$ USD in the long term (due to geopolitical risks and the potential loss of Fed's independence).
Short Term 🔴: Gold is under technical selling pressure after breaking through the $4,000$ USD mark.
📊 TECHNICAL ANALYSIS: BREAKING THE TRENDLINE
Structure: Gold has exited the upward price channel and is retesting the broken trendline.
Priority: SELL at the retest resistance area of $4024$.
🎯 DETAILED TRADING PLAN (ACTION PLAN)
🔴 SELL Scenario (SELL Primary) - Preemptive Resistance
Entry 1: $4024$ (Sell retest trendline area)
SL: $4032$
TP1/TP2: $4012$ | $4000$
TP3: $3989$
Entry 2 (Continued SELL): When the price breaks the next trendline at $3992$
SL: $4000$
TP: $3940$
🟢 BUY Scenario (BUY Reversal) - Buy at Strong Support
Logic: Only buy when the price hits a strong liquidity support area, potential for short-term recovery.
Entry (BUY): Around $3960$ (Buy Scalping area)
SL: $3954$
TP1/TP2: $3972$ | $3988 FWB:TP3 : $4000$
📌 SUMMARY & DISCIPLINE (Liam's Note) Don't let the $5,000$ USD prospect affect short-term risk management. Trade according to Price Action. Adhere to SL and prioritize SELL positions at resistance areas.
Are you ready for the SELL strategy at the start of this week?

Based on macd and SMA ready to go up .Based on macd and SMA ready to go up . Simple moving average is ready and supportedby MACD also

USDJPY: Bearish Forecast & Outlook
Balance of buyers and sellers on the USDJPY pair, that is best felt when all the timeframes are analyzed properly is shifting in favor of the sellers, therefore is it only natural that we go short on the pair.
Disclosure: I am part of Trade Nation's Influencer program and receive a monthly fee for using their TradingView charts in my analysis.
❤️ Please, support our work with like & comment! ❤️

USOIL: Short Trading Opportunity
USOIL
- Classic bearish setup
- Our team expects bearish continuation
SUGGESTED TRADE:
Swing Trade
Short USOIL
Entry Point - 60.87
Stop Loss - 61.10
Take Profit - 60.44
Our Risk - 1%
Start protection of your profits from lower levels
Disclosure: I am part of Trade Nation's Influencer program and receive a monthly fee for using their TradingView charts in my analysis.
❤️ Please, support our work with like & comment! ❤️

EURUSD: Growth & Bullish Forecast
Looking at the chart of EURUSD right now we are seeing some interesting price action on the lower timeframes. Thus a local move up seems to be quite likely.
Disclosure: I am part of Trade Nation's Influencer program and receive a monthly fee for using their TradingView charts in my analysis.
❤️ Please, support our work with like & comment! ❤️

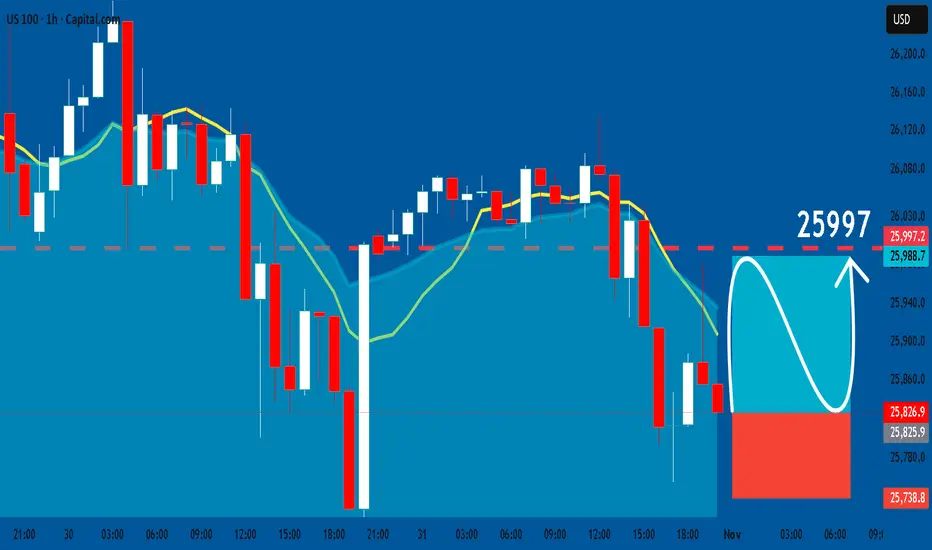
US100: Long Signal Explained
US100
- Classic bullish formation
- Our team expects pullback
SUGGESTED TRADE:
Swing Trade
Long US100
Entry - 25826
Sl - 25738
Tp - 25997
Our Risk - 1%
Start protection of your profits from lower levels
Disclosure: I am part of Trade Nation's Influencer program and receive a monthly fee for using their TradingView charts in my analysis.
❤️ Please, support our work with like & comment! ❤️