Tesla Inc. (TSLA) | Bullish Technical Outlook🚗⚡ TSLA Market Profit Playbook – Bullish Swing Strategy
Asset: Tesla, Inc. (TSLA) - NASDAQ Stock Exchange
Current Price: $445.01 (as of Jan 12, 2026)
52-Week Range: $214.25 - $498.83
📊 MARKET SNAPSHOT – REAL-TIME FEED
Live Price Action:
Current trading at $442.83 with intraday range $438.00 - $444.50
All-time high closing price was $489.88 on December 16, 2025
Average daily volume: 60.35M shares
Market cap: $1.48 trillion
Recent Performance:
Stock gained 19.18% over past 4 weeks as of Jan 6, 2026
Year-over-year performance: +13.27%
🎯 TRADING PLAN: BULLISH SETUP
📍 Entry Strategy: Layered Limit Orders (Thief Method)
This strategy uses multiple buy limit orders to scale into positions at favorable levels:
Layer 1: $430.00
Layer 2: $440.00
Layer 3: $450.00
Note: You can add additional layers based on your risk appetite and capital allocation strategy. This scaling approach reduces average entry cost and manages downside risk.
🎯 Take Profit Target:
Primary TP: $490.00 (near recent all-time high resistance zone)
Reasoning: Price approaching the $498.83 52-week high creates a strong resistance zone where profit-taking is expected. The $490 level acts as a police barricade (strong resistance + potential trap zone).
⚠️ Disclaimer: This is MY target level. You have the freedom to set your own profit targets based on your trading style and risk management. Take profits when YOU'RE comfortable – it's your capital, your decision.
🛑 Stop Loss:
Thief SL: $420.00
Risk Management: Positioned below recent support to prevent minor volatility from triggering exits
⚠️ Disclaimer: This is MY stop-loss level. You're encouraged to set your own stop-loss based on your risk tolerance and account size. Protect your capital at YOUR chosen level.
📈 TECHNICAL ANALYSIS
Chart Structure:
Price currently consolidating in mid-channel after pullback from $498.83 high
Stock lies in middle of wide, weak rising trend in short term with further rise signaled
Support from accumulated volume at $429.24 may hold as buying opportunity
Average True Range: 3.35% daily volatility (medium risk profile)
Key Levels:
Support: $429-430 (volume accumulation zone)
Resistance: $490-498 (police barricade resistance cluster)
🌍 FUNDAMENTAL & ECONOMIC FACTORS
Upcoming Catalysts:
Q4 2025 Earnings Release: Wednesday, January 28, 2026 (after market close)
Expected EPS: $0.45 per share
Q4 deliveries of 418,227 vehicles announced (down 15% YoY)
Delivery Performance:
Full year 2025 deliveries: 1.64M units (down 8.6% from 1.79M in 2024)
Energy storage deployments reached record 14.2 GWh in Q4
Industry Headwinds:
Global EV sales growth expected to slow to 12% in 2026 vs 23% in 2025
Federal EV tax credit expired September 2025, impacting affordability
BYD overtook Tesla as world's largest EV seller with 2.26M units sold in 2025
Technical Sentiment:
Analyst consensus: 20 buy, 10 sell ratings (Neutral overall)
Average 12-month price target: $403.32 (High: $600, Low: $120)
🔗 CORRELATED PAIRS TO WATCH
EV Sector Correlation:
NASDAQ:RIVN (Rivian Automotive) - Direct EV competitor
NASDAQ:LCID (Lucid Group) - Luxury EV segment
NYSE:NIO (NIO Inc.) - Chinese EV manufacturer
Tech/AI Correlation:
NASDAQ:NVDA (Nvidia) - AI chip supplier for Tesla's FSD technology
NASDAQ:MSFT (Microsoft) - Cloud/AI infrastructure plays
NASDAQ:META (Meta Platforms) - Nasdaq-100 stocks historically rise in January 70% of time with 2.5% average return
Key Relationship: Tesla's performance increasingly tied to its AI/autonomous driving narrative rather than pure automotive sales. Monitor semiconductor and tech sector momentum as leading indicators.
⚠️ RISK FACTORS
Earnings Volatility: Q4 earnings could create structural shift if margins compress or delivery guidance disappoints
Competition: Intense competition from Chinese manufacturers, particularly BYD's 28% growth rate
Political Risk: Musk's political activities have triggered consumer backlash in Europe and U.S.
Valuation Concerns: Director James Murdoch sold 60,000 shares at $445.40 on January 2, 2026
🎪 TRADING WISDOM: THE THIEF'S PLAYBOOK
This setup represents a swing trade opportunity in a consolidating market leader. The layered entry approach (Thief Strategy) provides:
✅ Cost averaging benefits
✅ Reduced timing risk
✅ Flexibility to scale position size
Remember: Markets reward patience and discipline. The goal isn't to catch the perfect bottom – it's to position yourself in the profit zone and manage risk effectively.
✨ "If you find value in my analysis, a 👍 and 🚀 boost is much appreciated — it helps me share more setups with the community!"
Teslaforecast

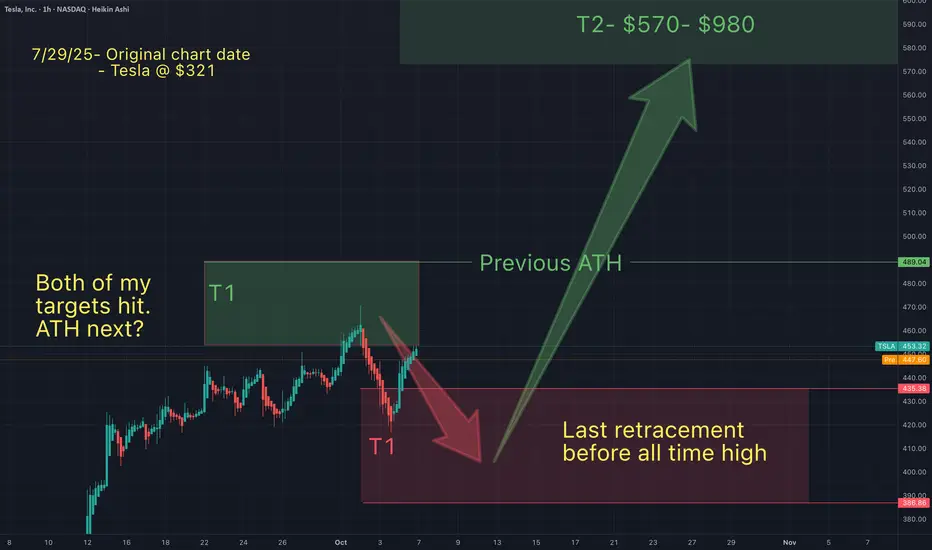
Last Tesla (Macro) chart before ATHATH NEXT!
If I'm wrong, then I have "strict invalidations" with minimal loses...because of "proper risk management".
If I'm right then I'm taking an extended vacation.
May the trends be with you.
My Last Tesla post before ALL TIME HIGHOn Oct 21st I said I was adding to my positions (price at the time below):
Some of my target hit. We may even go lower.
What do you think?
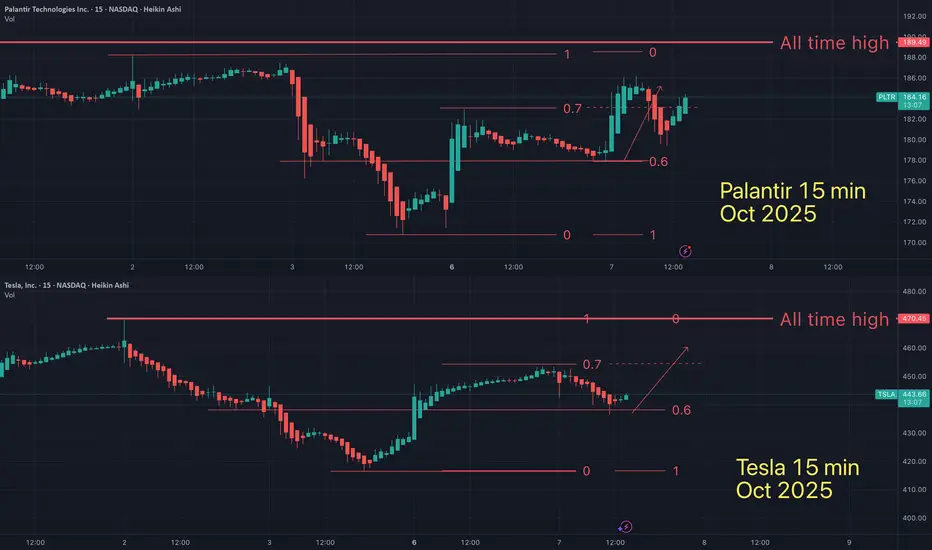
After 30 Days- Telsa is STill following Palantir fractal
On Oct 7th (30 days ago) I suggested that Tesla and palantir were in a "fractal" pattern.
Oct 7th - macro look
On Oct 27th - I wrote: "Fractals are a mathmatical anomaly, if you understand linear equations (and believe the market is "random"). All assets are doing the same patterns over and over, on all time frames. You just need to see it for what it is.
Oct 28th - "What is a fractal mathmatically?"
All asset charts are graphs, governed by coordinates on an x-axis and y-axis "chart". Where there exist trendlines that price action "respects". These trendlines and ratios are dictated by equations with several variables. If variables were by definition "random", then what would be the chance of 1 fractal appearing in a random assortment of buyers and sellers, in all different time zones (and countries)... all buyin in different amounts...at different times...
*Regardless the fractal seems to remain intact.
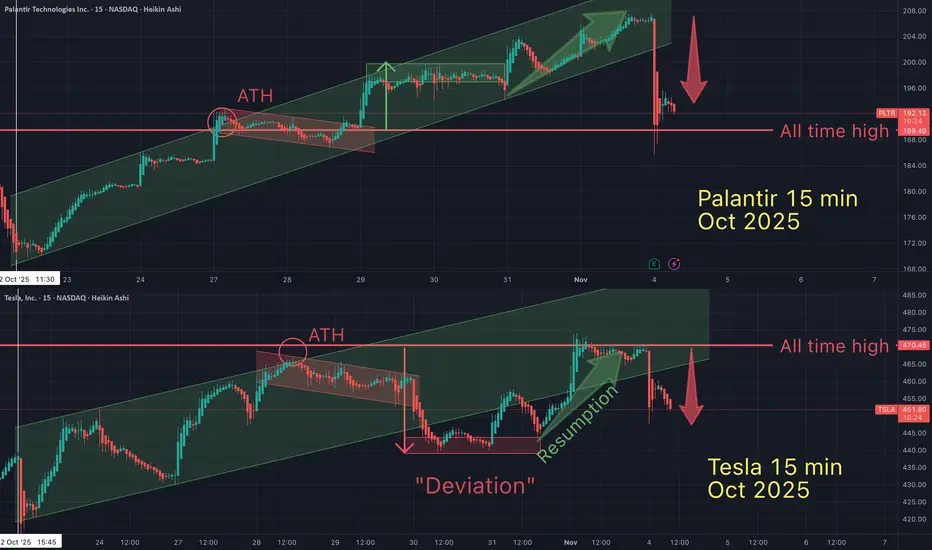
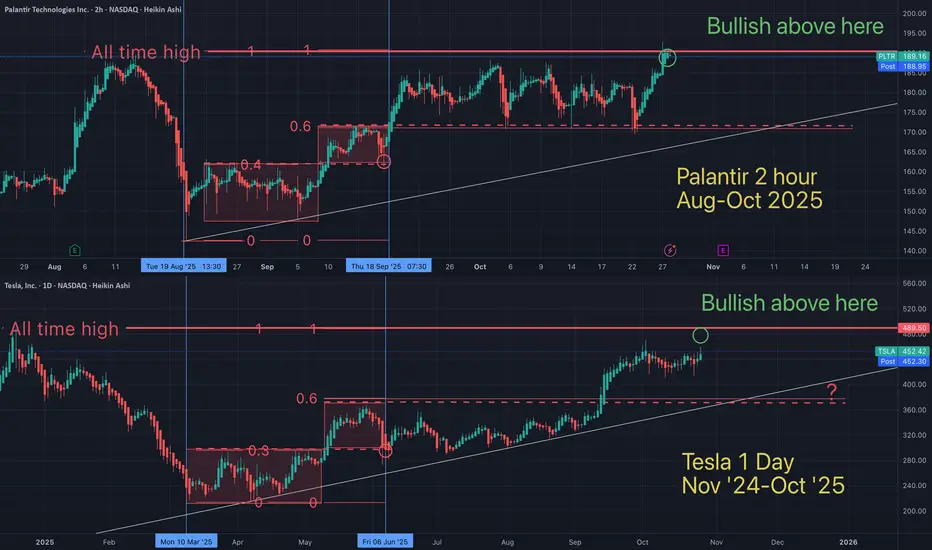
Oct 29th - "On Oct 7th I suggested that Palantir & Tesla were in a very bullish long term pattern and were both about to *soon break out into new all time highs (ATH). Palantir just did...is Tesla next?
Oct 29th - macro look "What do you think? Is Tesla primed for an all time high (soon)...and a blow off top?"
Nov 4th - "On Oct 7th I suggested the Palantir / Tesla "fractal" would lead them both to an all time high. Fast forward to today (1 month later), Palantir has recently hit a new ATH and Tesla is still following the fractal closely. I believe Tesla is days or weeks away from an ATH.
Tesla will move very quickly in 3rd angle fashion, once it breaks ATH & holds support.
If the fractals continues at this pace, how soon do you think Tesla will HOLD SUPPORT above ATH?"
Nov 4th - A different way of looking at this fractal. I wrote "Even when there is a 'deviation' from the pattern, the overall agenda prevails. There's no stoping this moving train. Hopefully you're on board...and know when to get off.
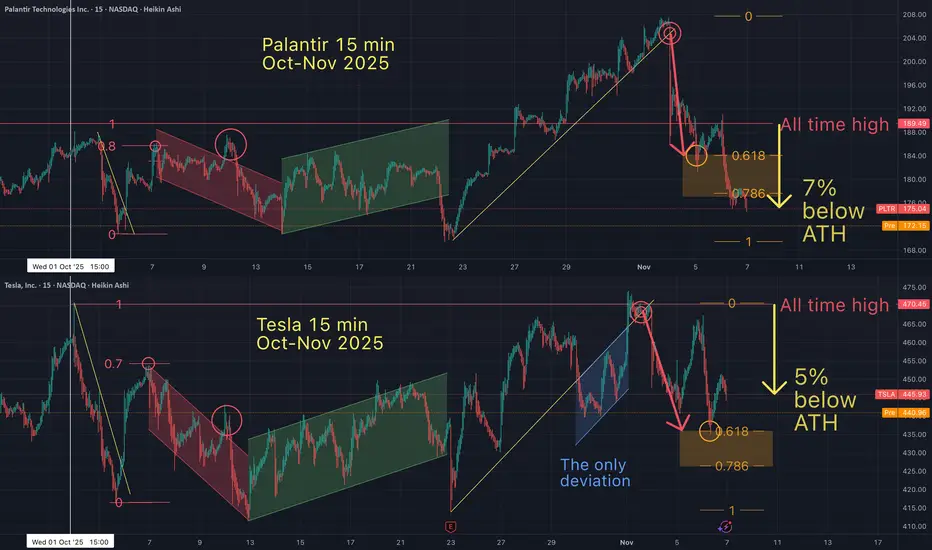
Tesla / Palantir Fractal STILL playing out STRANGELY ACCURATEMillions of people
...buying Trillions of dollars of assets
...at random times
...on random days
but somehow these 2 assets move together on the x-axis & the y-axis??
Cansomeone explain this to me mathematically?
May the Truth be with you.

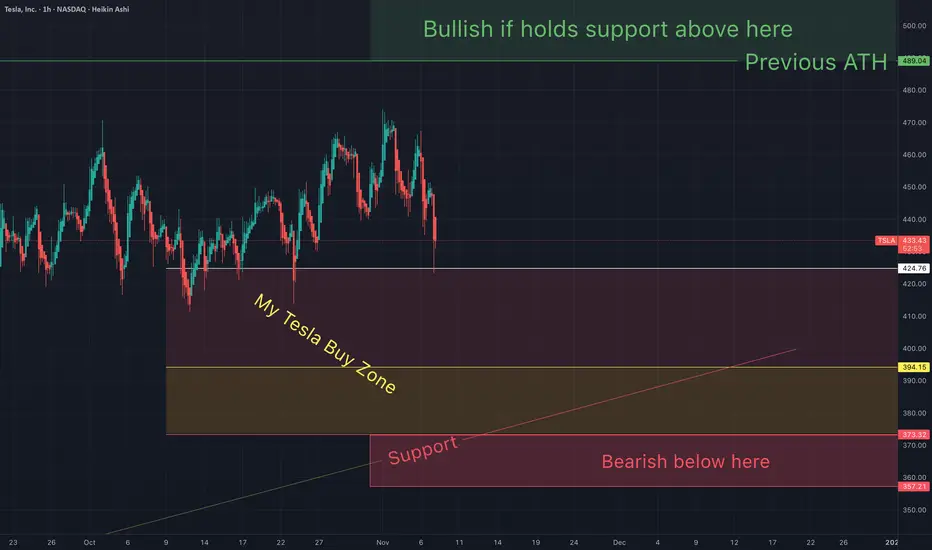
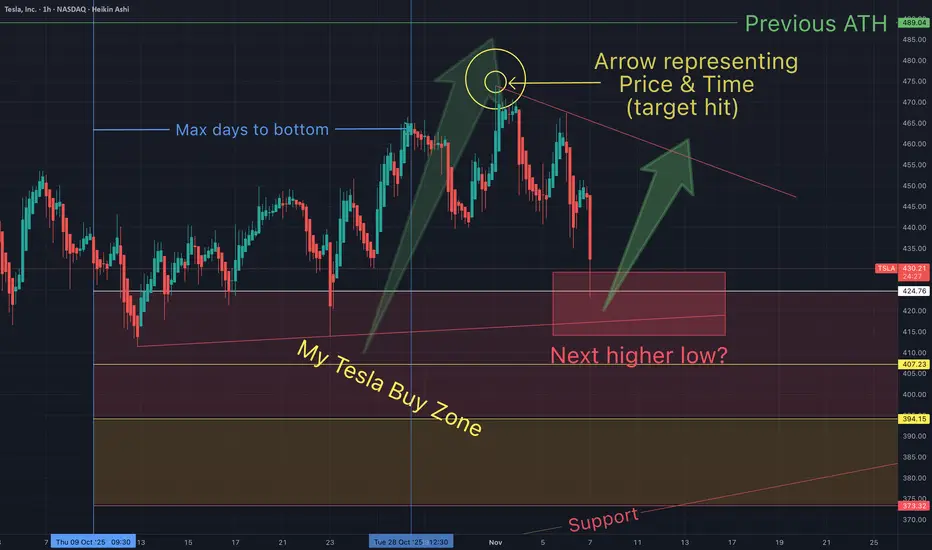
Tesla Inc. (Nasdaq: $TSLA) Eyes Breakout Above $490Tesla Inc. (Nasdaq: NASDAQ:TSLA ) is approaching a critical technical juncture as price action consolidates near the upper end of its ascending trendline. After rebounding strongly from the $180–$200 demand zone earlier this year, Tesla has maintained a steady uptrend, forming higher lows and higher highs — a classic bullish structure.
Currently trading near $440, Tesla has encountered resistance below the $490–$492 zone, which marks the previous swing high. The chart shows a clear ascending support line extending from the April low, reinforcing the overall bullish sentiment. As long as the stock holds above $420, bulls remain in control. A confirmed breakout above $492 could ignite the next leg higher, targeting the $520–$540 region in the medium term.
Volume analysis shows healthy participation during recent rallies, while the RSI hovering around 50 suggests moderate strength without signs of overbought conditions. This balance indicates potential for further upside before exhaustion sets in.
The projected path shown on the chart outlines a short-term pullback toward support, followed by a continuation rally through resistance. Such a move would confirm bullish momentum and possibly trigger a new wave of investor confidence as Tesla heads into the next earnings season.
However, if Tesla fails to maintain the ascending trendline, a dip below $410 could expose the stock to deeper retracement toward $380, testing previous breakout levels.
Overall, Tesla’s structure remains technically constructive. The uptrend is intact, supported by volume and strong higher-lows formation. Traders are closely watching for a decisive breakout above $492, which could mark the beginning of a fresh rally phase as market sentiment leans bullish on tech and EV momentum.

Tesla / Palantir "fractal" - Why do fractals exist?Even when there is a "deviation" from the pattern, the overall agenda prevails. There's no stoping this moving train. Hopefully you're on board...and know when to get off.
May the trends be with you.
Tesla / Palantir fractal showing both will hit ATH soonFractals are a mathmatical anomaly, if you understand linear equations (and believe the market is "random"). All assets are doing the same patterns over and over, on all time frames. You just need to see it for what it is.
May the trends be with you.

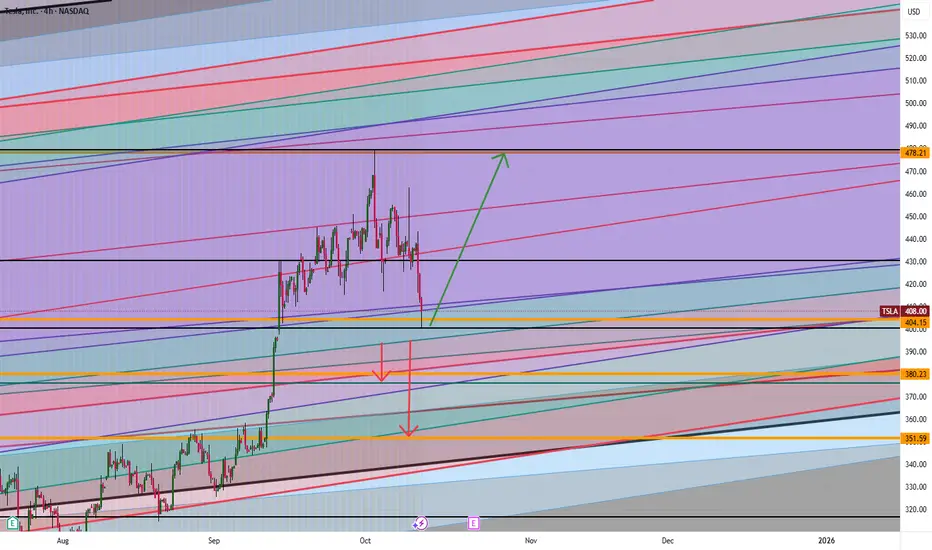
Tesla: Will It Blast Off or Fall Fast? The $404 Level Is the KeyTesla is at a big “make or break” point. If the price stays higher than $404, it could blast up to $437 or maybe even $478. But if Tesla drops below $404, watch out! It could fall down to $380 or even as low as $351.
Think about it:
What would you do if Tesla started moving toward those numbers? Do you think it will go up or will it go down?
If you’re not sure or have a question, send me a message! Sometimes asking one good question can help you make a smarter trade. What do you want to know about Tesla right now?
Mindbloome Exchange
Tesla & Palantir STILL following this fractal.On oct 7th I suggested that Tesla and Palantir were following the same fractal (on the daily & 15 min time frames). They are both still following the fractal, over a week later.
Repeating patterns are everywhere, once we know how tho spot them.
May the trends be with you.

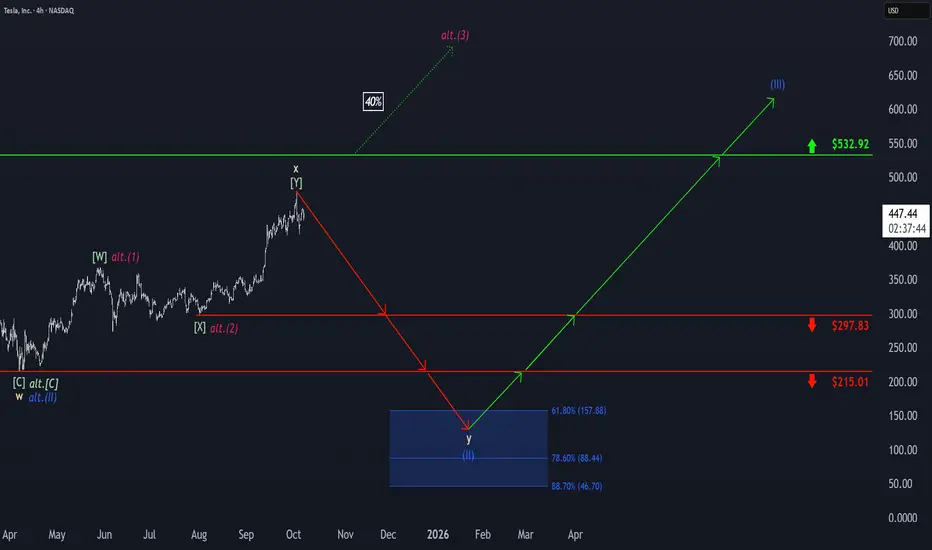
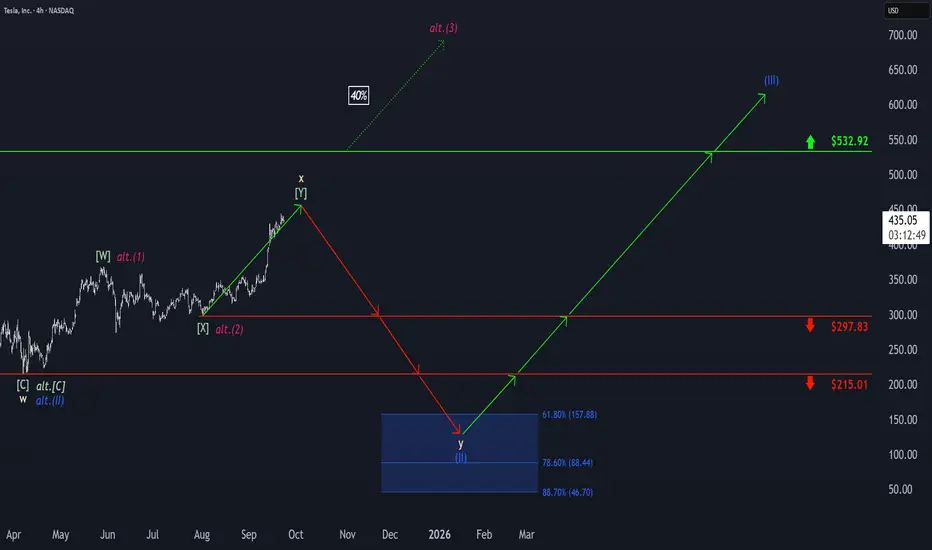
Tesla: Top Established!Tesla initially hit a new high before quickly reversing course with a notable move to the downside. As a result, we now view the corrective upward movement of beige wave x as complete and anticipate further sell-offs as part of wave y. The stock is expected to gradually break below the support levels at $297.83 and $215.01, ultimately reaching our blue Target Zone between $157.88 and $46.70, which we have identified for the final corrective low of blue wave (II). However, there remains a 40% chance that TSLA will not reach the blue zone at all but instead will break out directly above resistance at $532.92. In this case, we would consider blue wave alt.(II) already complete and locate the stock in a sustained (magenta) upward impulse. Even in our primary scenario, the new uptrend of the regular wave (III) is ultimately expected to surpass the $532.92 resistance.
Here is the Palantir / Telsa Fractal on current 15 min timeframeFractals are a mathmatical anomaly, if you understand linear equations (and believe the market is "random"). All assets are doing the same patterns over and over, on all time frames. You just need to see it for what it is.
May the trends be with you.
Is this Tesla / Palantir fractal showing both will hit ATH soon?Fractals are a mathmatical anomaly, if you understand linear equations (and believe the market is "random"). All assets are doing the same patterns over and over, on all time frames. You just need to see it for what it is.
May the trends be with you.

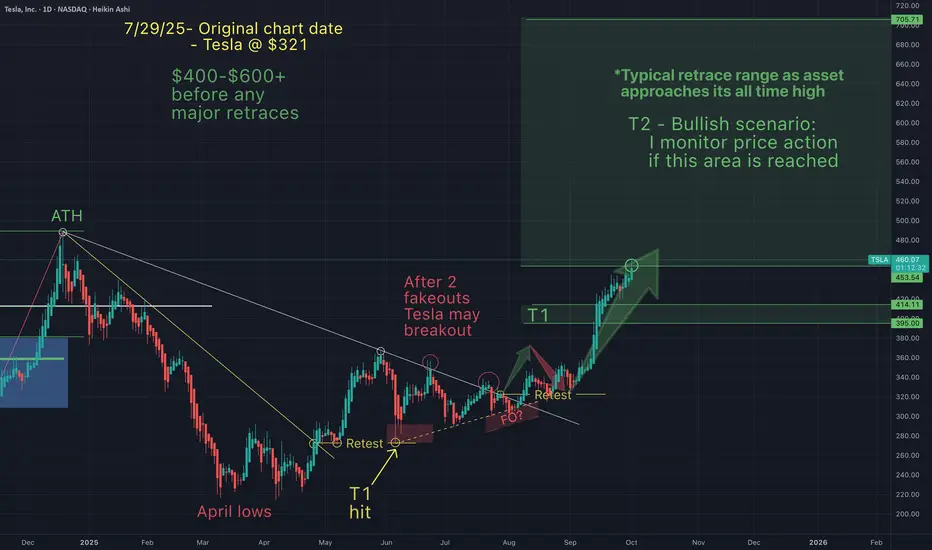
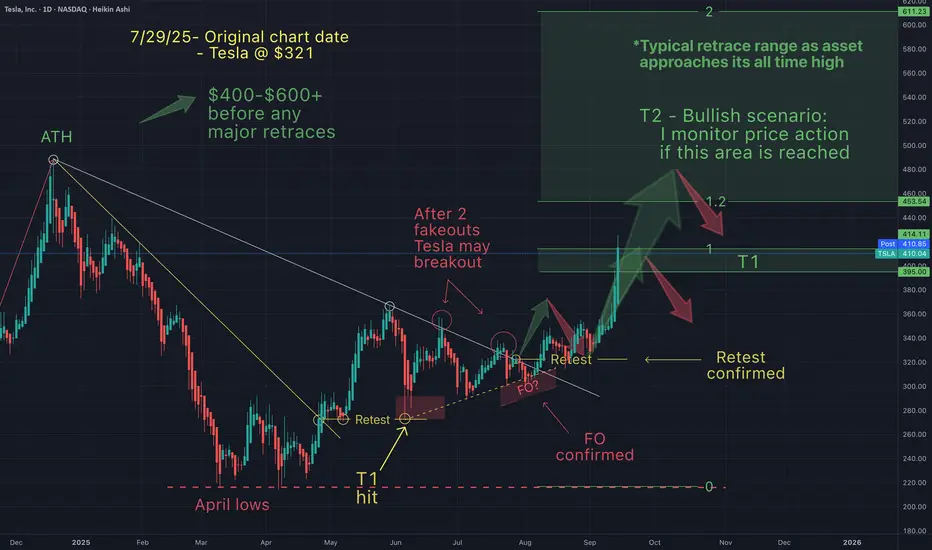
You will ask yourself "how did he know Tesla would do that"?On July 29th I suggested Telsa would follow a predicatble path. Price action has unfolded as anicipated every step of the way.
After a long run up, on Oct 1st I suggested that Tesla had topped at my green T1 and would retrace into my red support zone and bonce.
Now that this has played out, the only question that remains is Tesla going lower into my red T1...or simply all time highs from here?
Either way, Tesla may be about to melt faces (few & small retracements). For the next 2-10 weeks Tesla may form a blow off top (*"IF" Telsa continues this pattern). This blow off, will be the end of this bull pattern that I have been following since the April lows. Once Tesla hits my next range ($570-980) I expect a huge dump. I will monitor price action closely, once Tesla is in this next range.
May the trends be with you.
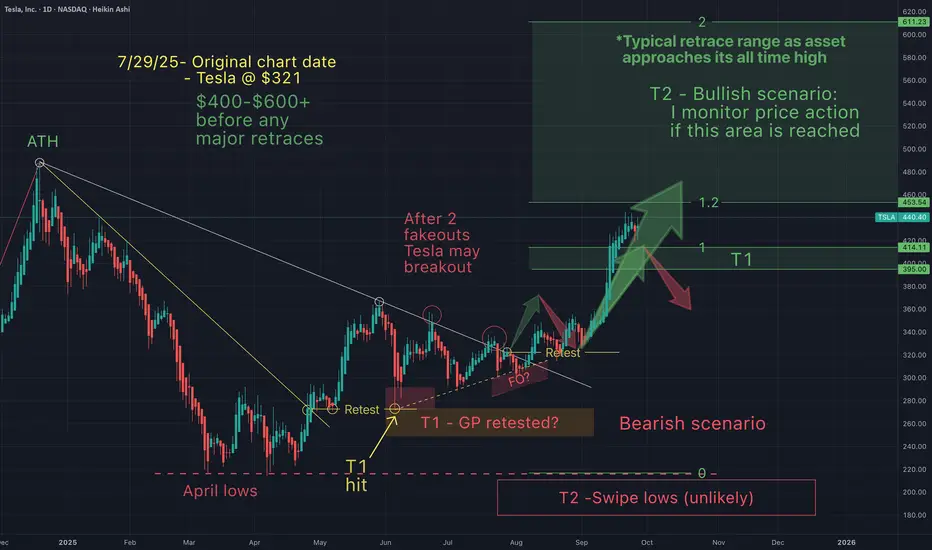
Telsa - NEW ALL TIME HIGHS INCOMING (price action simplified)Here's a simplified version of my short term targets. On July 29th Tesla was around $321 and I suggested that after a long downtrend, Tesla would breakout, retest and continue up ("without any major retraces)", to between $400-$600.
Tesla has now hit my T2 (currently $460) and I am anticipating a small retracement, before new all time highs in the near term.
Congrats to all of you who have made gains from my charts.
May the trends (continue) to be with you.
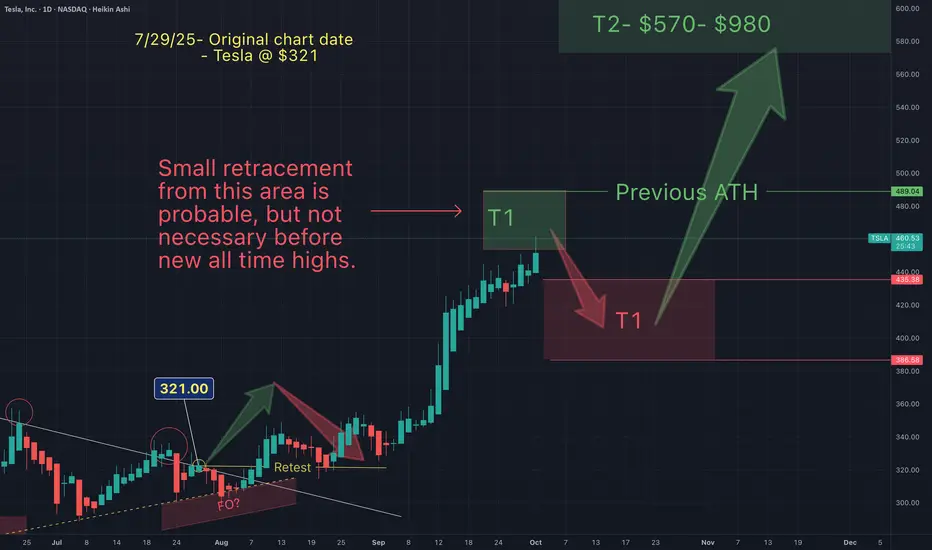
Tesla - NEW ALL TIME HIGH INCOMING (small pullback first?)On July 29th Tesla was around $320 and I suggested that after a long downtrend, Tesla would breakout, retest and continue up ("without any major retraces)", to between $400-$600.
Tesla has now hit my T2 (currently $460) and I am anticipating a small retest before new all time highs in the near term.
Congrats to all of you who have made gains from my charts.
May the trends (continue) to be with you.
You will ask yourself "how did he know Tesla would do that"?On July 29th Tesla was $321 and I suggested (after a breakout & retest) Tesla would pump straight to low $400s (without any retraces). Now that the trading week has closed here's an update:
Things are still going according to what I expected. But how is this possible...I don't have a crystal ball! How could I have predicted this even *before Elon claimed to have invested 1B into Tesla?
Did Elon know something that we didn't or did I know something you didn't?
Is it the "narative" or the ongoing, repeating, predicable chart patterns?
TA works!
Tesla - SHOW ME THE CHART AND I WILL TELL YOU THE NEWS!Back in June and July, Elon and Tesla were STILL getting a lot of bad press (Elon fighting with President Trump, people burning Tesla cars etc). Those that follow me may recall on July 29th I wrote the following:
"Tesla just needs a narrative shift (ie -new invention etc), & price action changes in a heart beat.
Yet, price action really has less to do with the news making Elon a hero, then a villain and then back and forth...but moreso to do with price action patterns that just keep repeating".
And you'll note that my July chart suggested that the huge pump to $400+ would begin around Sept 1st (Huge green arrow after the retest). What a coincidence that 2 weeks later Elon announces a $1Billion dollar Tesla stock buy (the new anticipated "narrative"). My huge green arrow was there many weeks before this "news". How could I have known?
SHOW ME THE CHART AND I WILL TELL YOU THE NEWS.
On July 29th Tesla was $321 and I suggested that Tesla was about to have a major breakout to at least $400 "with no major retraces". That target has now been hit. Is it because of the news or is it the patterns that just keep repeating?
My T1 targets are probable targets, so I anticipate them almost always getting hit. My ideal buy and sell targets are T2. Tesla now appears to be headed into my T2 target, so it's time to start monitoring price action closely.

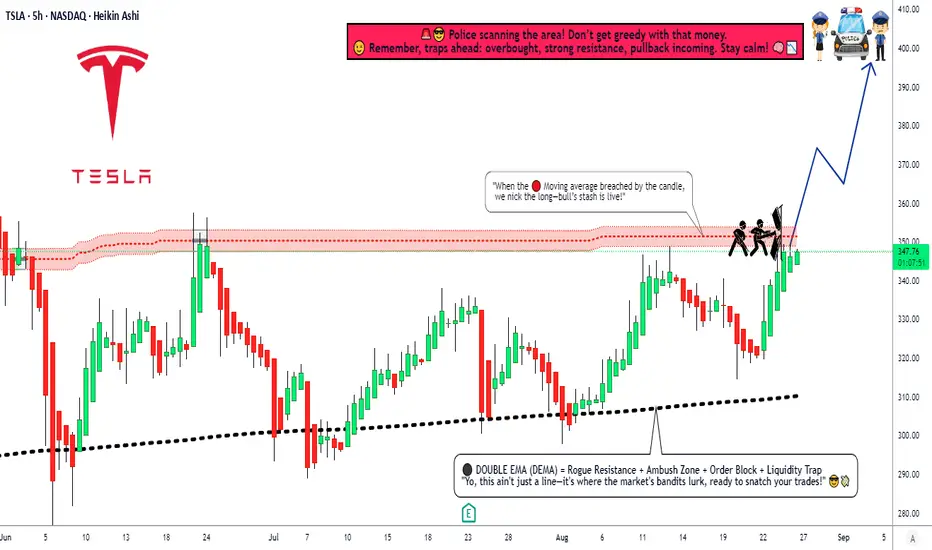
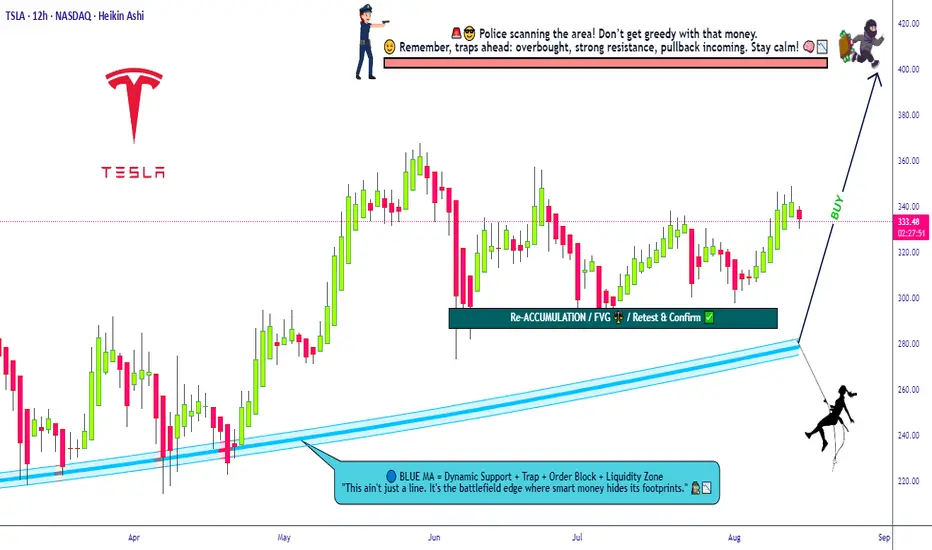
Bullish Tesla Mission Activated – Grab the Loot Now!💎🚨 TESLA STOCK MARKET HEIST PLAN 🚨💎
🕵️♂️ Attention All Thief OG’s, Chart Ninjas & Wall Street Pickpockets!
We’re gearing up for a full-blown Tesla loot mission — bullish, layered, and locked on target! 📈💰
🎯 Plan:
Bullish Layered Entry Strategy 🤑
We’re stacking multiple BUY LIMIT layers like a pro bank job:
💵 (330.00) | 💵 (320.00) | 💵 (310.00) | 💵 (300.00)
(You can add more layers if you want to steal bigger)
🛑 Stop Loss:
The Thief’s SL @ 280.00 💣
📌 Adjust to your own risk — every crew member knows their escape route!
Remember: A good thief never leaves fingerprints, only profits.
🏆 Target:
🚓 Police barricade at 420.00 — better vanish before the sirens!
🎯 Secure the main loot at 400.00 before making a clean getaway.
💡 Thief Strategy Tip:
Layering lets you grab more loot if price dips — like breaking into multiple vaults.
Keep your disguise on and watch the charts — Wall Street guards are always watching. 👀🖤
⚠️ Warning for the Crew:
Major news drops = cops on every corner.
Stay hidden, trail your stops, and protect the stash.
💥 Smash the ❤️ LIKE button if you’re in for this Tesla mission!
📌 Follow the crew for more Thief Trader blueprints — next heist drops soon!
Tesla: Upward Momentum PersistsTesla’s upward momentum has persisted, with the beige wave x still having some room to run. However, we expect the corrective top to form well below resistance at $532.92, which should then trigger the final selling phase within the broader correction. Ultimately, wave y is projected to approach our blue Target Zone between $157.88 and $46.70, completing the large blue wave (II) in that range. Afterward, we anticipate a new wave (III) uptrend. That said, there remains a 40% probability that price may not reach the blue zone, as wave alt.(II) could have already completed at $215.01. In this scenario, TSLA would already be developing a magenta upward impulse and could break above the $532.92 level directly and sustainably.
You will ask yourself, "how did he know Tesla would do that"?On July 29th, I posted this chart suggesting that I anticipated a typical pattern to emerge. Things are going according to what I was expecting.
Congratulations to everyone who has been making some gains here based on everthing that was discussed in the charts.
The most important thing in my opinion is a trading strategy...and these strategies have made us incredible gains across the board.
Only question remains, will Tesla hit my T2. What do you think?
May the trends be with you.
TSLA Breakout Play: Time to Steal Some Profits?🚨 TESLA INC (TSLA) HEIST PLAN - BULLISH SWING/Day LAYUP! 🚨
Yo, Thief OG's! 🐱👤🤑 Time to swarm the TSLA vault. The blueprint is set for a major bullish score. Our intel says the cops (bears) are losing their grip. Let's get this money! 💰💸✨
🎯 THE MASTER PLAN: BULLISH BREAKOUT (PENDING ORDERS)
Based on the Thief Trading Style™ technical analysis, we're plotting a bullish heist on TSLA. We wait for the breakout confirmation, then we strike with precision using our layered entry strategy.
Asset: TESLA INC (TSLA)
Trade Type: Swing / Day Trade
Bias: BULLISH ⬆️⚡
📍 ENTRY: THE HEIST INITIATES (SET YOUR ALARMS! ⏰)
Primary Entry: Breakout and close above $355.00 ⚡
THIEF'S LAYERED ENTRY STRATEGY: 🎯
Don't go all in at one price! We use multiple limit orders to layer into the position after the breakout confirms the move. This is how the pros (and thieves) do it!
Layer 1: Breakout Entry @ $355.00
Layer 2: Pullback Entry @ $350.00
Layer 3: Pullback Entry @ $345.00
Layer 4: Pullback Entry @ $340.00
Layer 5: Pullback Entry @ $335.00
(You can add more layers based on your own capital and risk appetite, you savage!)
📌 IMPORTANT: SET A TRADINGVIEW ALARM at $355.00! This is your signal that the heist is a GO! Don't get caught sleeping. 🛌💤
🛑 STOP LOSS: THE ESCAPE ROUTE
Thief SL for Breakout Entry: $320.00
⚠️ HEAR ME, HEAR ME! Dear Ladies & Gentleman (Thief OG's), adjust your SL based on your own strategy & risk! I am not your financial advisor; I'm just the guy with the blueprint. 🗺️ Place your SL ONLY AFTER the breakout happens. Protect your capital at all costs!
🎯 TARGET: CASH OUT & VANISH
Primary Target: $400.00 🚀
The police barricade is thick up there! 🚓🚧 Once the money is in the bag, don't get greedy! Escape with the stolen profits before they catch you!
Note: Dear Thief OG's, I am not recommending you use only my TP. Take profits at your own risk and based on your own analysis. Secure the bag when YOU feel comfortable! 💼🔥
💎 THIEF'S FINAL WORDS:
This is not a gamble; it's a calculated heist. Follow the plan, manage your risk, and let's eat! 🍽️
Hit the LIKE button if you're riding with us! ✅
BOOST this idea to empower the thief community! 💪❤️
Follow for more daily heist plans! 🎯
Stay sharp, stay profitable, and remember... in the market, be a thief, not a victim! 🐱💻🚀
NASDAQ:TSLA #TradingView #StockMarket #TradingPlan #SwingTrading #DayTrading #Investing #Bullish #TESLA #ThiefTradingStyle