Tesla - The next bullrun is coming!🚗Tesla ( NASDAQ:TSLA ) is clearly breaking out:
🔎Analysis summary:
In mid 2025, Tesla perfectly retested a major confluence of support. After Tesla then created bullish confirmation, the recent strong rally was totally expected. And with the current triangle breakout, Tesla is just starting its next major parabolic rally much higher.
📝Levels to watch:
$400 and $600
SwingTraderPhil
SwingTrading.Simplified. | Investing.Simplified. | #LONGTERMVISION
Teslalong

Tesla - The triangle is still valid!🎀Tesla ( NASDAQ:TSLA ) can still confirm the breakout:
🔎Analysis summary:
Just two months ago, Tesla perfectly broke out of the major ascending triangle pattern. In the meantime we just witnessed a major consolidation at the all time high. Quite likely that Tesla will soon confirm the breakout, launching another parabolic rally from here.
📝Levels to watch:
$400
SwingTraderPhil
SwingTrading.Simplified. | Investing.Simplified. | #LONGTERMVISION

Tesla Reversal Signal Triggered at the 200 SMA!TSLA 🚗 Bullish Pullback Playbook — Smart Layered Entry Setup!
📈 Asset:
TSLA — Tesla Inc. (NASDAQ)
Swing Trade Playbook | Trend-Continuation Setup
🧠 Market Thesis
TSLA shows a bullish pullback into the 200-Day Simple Moving Average, a level historically respected by trend-followers. The latest Heikin-Ashi Doji Reversal signals buyers regaining momentum ⚡ — suggesting the pullback is stabilizing and demand is stepping back in.
This combination of trend support + reversal confirmation forms the core of this structured swing setup.
🎯 Plan Overview
A clean bullish continuation strategy using a refined layered entry method (professionally framed as “scaled limit entries”). This maintains your signature thief-style energy, but aligned with TradingView rules and presentation standards. 😎
🟢 Entry Plan (Layered / Scaled Limit Orders)
Using a scaling approach allows better average pricing during volatility.
Proposed buy-limit layers:
Buy Limit 1 → $420.00
Buy Limit 2 → $410.00
Buy Limit 3 → $400.00
👉 Traders may increase or reduce the number of layers based on risk tolerance and personal strategy.
🔻 Stop-Loss (Risk Control)
A defensive stop-loss is placed near $380.00, below recent liquidity pockets and under the 200 SMA structure.
⚠️ This level is optional — traders should select their own SL based on personal risk management.
🎯 Take-Profit Zone
Target area sits around $470.00, where:
Major historical resistance awaits
Overbought conditions often develop
High-volume sellers tend to re-enter
This zone is treated as a profit-taking escape point, but traders can exit based on their own judgment.
📡 Related Markets to Watch (Correlation Insight)
Keeping the global view helps improve trade confidence:
NASDAQ:QQQ — High correlation with mega-cap tech, TSLA often follows Nasdaq momentum.
NASDAQ:NDX — Strong tech index correlation; strength supports TSLA continuation.
SP:SPX — Broad-market risk sentiment gauge.
NASDAQ:NVDA / NASDAQ:AMD — Momentum flow in growth-tech impacts liquidity rotation into TSLA.
AMEX:XLY — Consumer Discretionary ETF (TSLA is a major component).
Key takeaway:
Strong tech-sector momentum + risk-on environment = enhanced TSLA bullish continuation probability 📊⚡
🧰 Notes for the Community
Dear Traders (Thief OG-style Family 😄) —
SL/TP levels shared here are only examples for educational purposes. You’re always free to manage your own positions using your own risk preferences. Trade smart, trade safe, trade stylish. 💼✨
✨ “If you find value in my analysis, a 👍 and 🚀 boost is much appreciated — it helps me share more setups with the community!”
This is a thief-style trading strategy presentation strictly for fun and educational purposes. Not financial advice.
#TSLA #Tesla #SwingTrade #BullishSetup #LayeredEntries #HeikinAshi #200SMA #NASDAQ #MomentumTrading #TechnicalAnalysis #TradingView #RiskManagement #TraderLifestyle #StockMarket

Tesla - Withstanding all weakness!🏹Tesla ( NASDAQ:TSLA ) can still break out:
🔎Analysis summary:
Since Tesla was listed on the Nasdaq back in 2013, we witnessed a lot of triangle breakouts. And starting all the way back in 2020, Tesla once again created a bullish triangle. Last month we saw the breakout and this month we have to see the confirmation
📝Levels to watch:
$400
SwingTraderPhil
SwingTrading.Simplified. | Investing.Simplified. | #LONGTERMVISION

Tesla at Key Support Level & Wins Ride-Hailing Permit in ArizonaTesla has secured a Transportation Network Company (TNC) permit in Arizona, marking another strategic step toward launching its robotaxi service. While the permit does not authorize Tesla to operate a fully driverless ride-hailing network, it grants the company legal approval to function as a ride-hailing operator under state regulations. This follows Tesla’s earlier approval in September to test autonomous vehicles with a safety driver on Arizona roads.
According to the Arizona Department of Transportation, Tesla applied for the permit on November 13 and met all regulatory requirements, receiving approval on November 17. The TNC license positions Tesla to begin laying operational groundwork for its robotaxi ambitions, fleet structure, service protocols, pricing models, and state compliance, while it continues advancing autonomous capabilities through its Full Self-Driving (FSD) platform.
Arizona has long been considered one of the most autonomous-friendly states, hosting early deployments from Waymo, Cruise, and other AV developers. Tesla’s entry expands the competitive landscape and brings its robotaxi vision closer to reality, though safety-driver supervision remains mandatory for now. The new permit reinforces Tesla’s strategic push into transportation services, signaling that regulatory pathways for FSD-enabled ride-hailing are steadily opening.
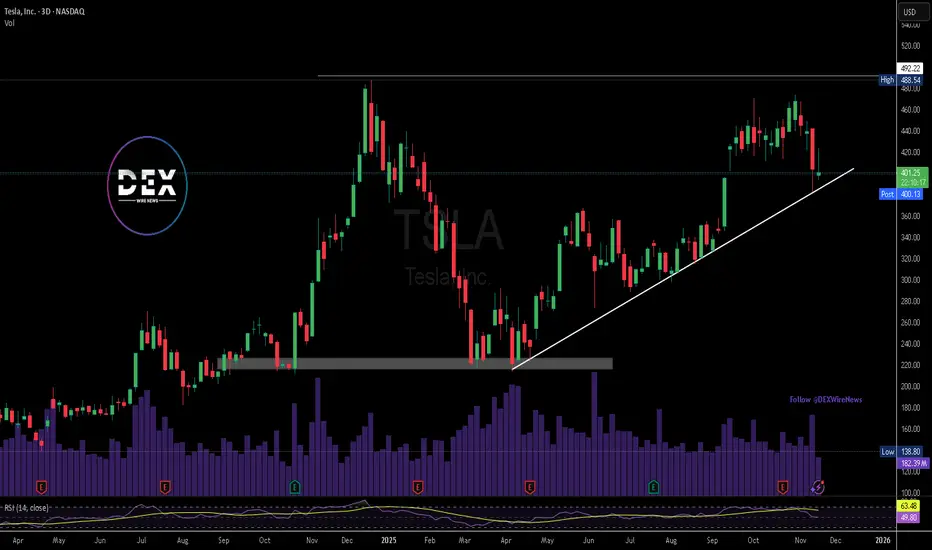
Technical Outlook
Tesla’s chart shows price pulling back into a key ascending trendline that has supported the uptrend since April. The current zone around $401 is a strong demand area, aligning with trendline support
A bounce from this level sets Tesla up for a potential continuation toward the major resistance at $488. A clean break above that level would confirm a medium-term bullish extension. RSI remains neutral, suggesting room for upside if buyers defend current support.
If the trendline fails, Tesla could retest deeper support near the $330–$345 range. For now, momentum favors a rebound as long as the trendline holds.
Tesla - Here comes the third breakout!🚀Tesla ( NASDAQ:TSLA ) is finally breaking out:
🔎Analysis summary:
For the past four years, Tesla has been trading in a very clear ascending triangle pattern. But just last month, we finally saw the expected bullish triangle breakout. Considering all of the previous triangle breakouts, Tesla is setting up for another parabolic rally soon.
📝Levels to watch:
$450
SwingTraderPhil
SwingTrading.Simplified. | Investing.Simplified. | #LONGTERMVISION

Last Tesla (Macro) chart before ATHATH NEXT!
If I'm wrong, then I have "strict invalidations" with minimal loses...because of "proper risk management".
If I'm right then I'm taking an extended vacation.
May the trends be with you.
Tesla Inc. (Nasdaq: $TSLA) Eyes Breakout Above $490Tesla Inc. (Nasdaq: NASDAQ:TSLA ) is approaching a critical technical juncture as price action consolidates near the upper end of its ascending trendline. After rebounding strongly from the $180–$200 demand zone earlier this year, Tesla has maintained a steady uptrend, forming higher lows and higher highs — a classic bullish structure.
Currently trading near $440, Tesla has encountered resistance below the $490–$492 zone, which marks the previous swing high. The chart shows a clear ascending support line extending from the April low, reinforcing the overall bullish sentiment. As long as the stock holds above $420, bulls remain in control. A confirmed breakout above $492 could ignite the next leg higher, targeting the $520–$540 region in the medium term.
Volume analysis shows healthy participation during recent rallies, while the RSI hovering around 50 suggests moderate strength without signs of overbought conditions. This balance indicates potential for further upside before exhaustion sets in.
The projected path shown on the chart outlines a short-term pullback toward support, followed by a continuation rally through resistance. Such a move would confirm bullish momentum and possibly trigger a new wave of investor confidence as Tesla heads into the next earnings season.
However, if Tesla fails to maintain the ascending trendline, a dip below $410 could expose the stock to deeper retracement toward $380, testing previous breakout levels.
Overall, Tesla’s structure remains technically constructive. The uptrend is intact, supported by volume and strong higher-lows formation. Traders are closely watching for a decisive breakout above $492, which could mark the beginning of a fresh rally phase as market sentiment leans bullish on tech and EV momentum.

You will ask yourself, "how did he know Palantir would do that"?On Oct 7th I suggested that Palantir & Tesla were in a very bullish long term pattern and were both about to *soon break out into new all time highs (ATH). Palantir just did...is Tesla next?
Blow off top next?
May the trends be with you.
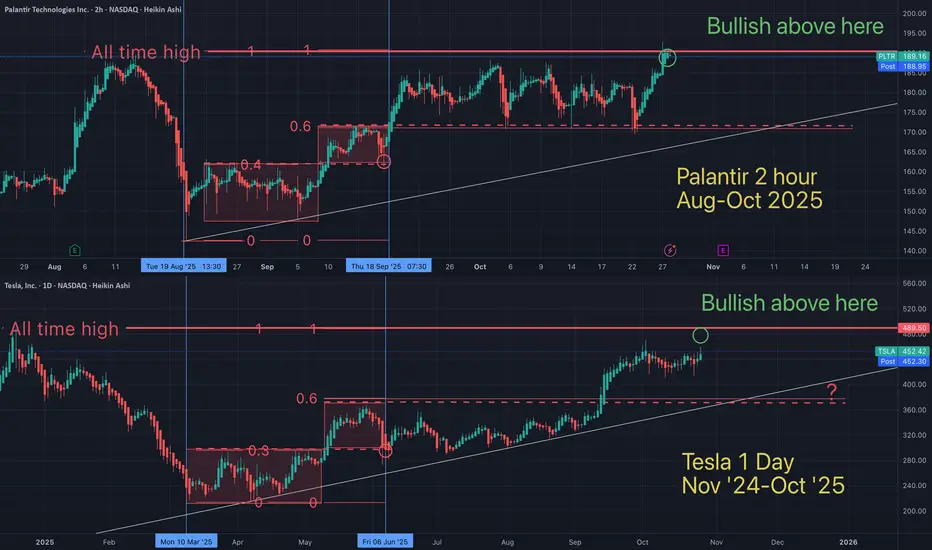
Tesla / Palantir fractal showing both will hit ATH soonFractals are a mathmatical anomaly, if you understand linear equations (and believe the market is "random"). All assets are doing the same patterns over and over, on all time frames. You just need to see it for what it is.
May the trends be with you.
Tesla - The massive triangle breakout!🪩Tesla ( NASDAQ:TSLA ) is breaking out:
🔎Analysis summary:
Last month, we witnessed an incredible but expected rally of about +35% on Tesla. Furthermore, with this move Tesla is attempting to break above the previous all time highs. After bullish confirmation, this would also lead to a massive triangle breakout.
📝Levels to watch:
$400
SwingTraderPhil
SwingTrading.Simplified. | Investing.Simplified. | #LONGTERMVISION

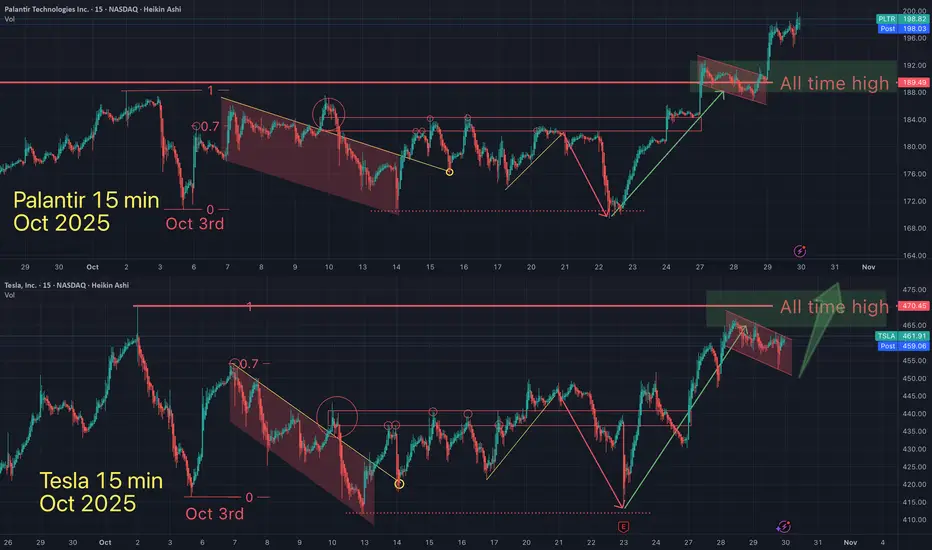
Tesla & Palantir STILL following this fractal.On oct 7th I suggested that Tesla and Palantir were following the same fractal (on the daily & 15 min time frames). They are both still following the fractal, over a week later.
Repeating patterns are everywhere, once we know how tho spot them.
May the trends be with you.

Here is the Palantir / Telsa Fractal on current 15 min timeframeFractals are a mathmatical anomaly, if you understand linear equations (and believe the market is "random"). All assets are doing the same patterns over and over, on all time frames. You just need to see it for what it is.
May the trends be with you.
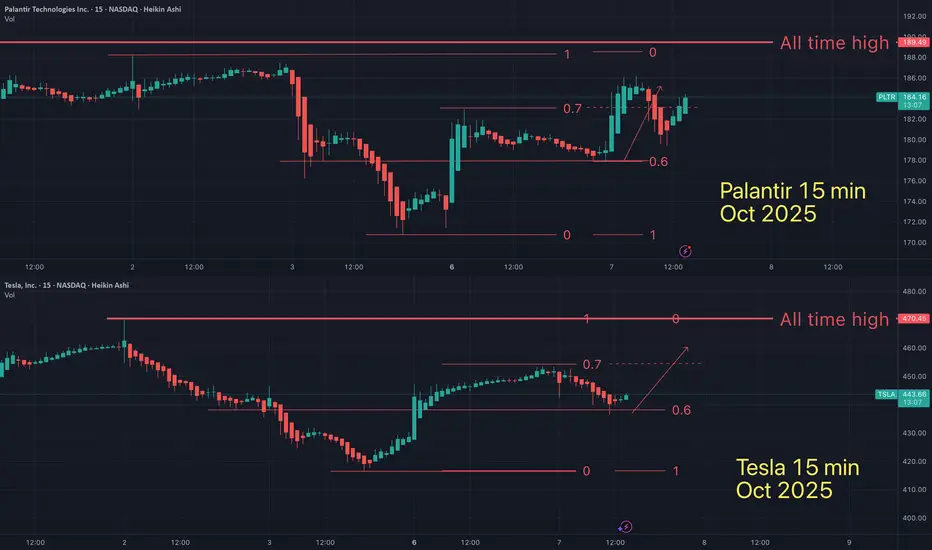
Is this Tesla / Palantir fractal showing both will hit ATH soon?Fractals are a mathmatical anomaly, if you understand linear equations (and believe the market is "random"). All assets are doing the same patterns over and over, on all time frames. You just need to see it for what it is.
May the trends be with you.

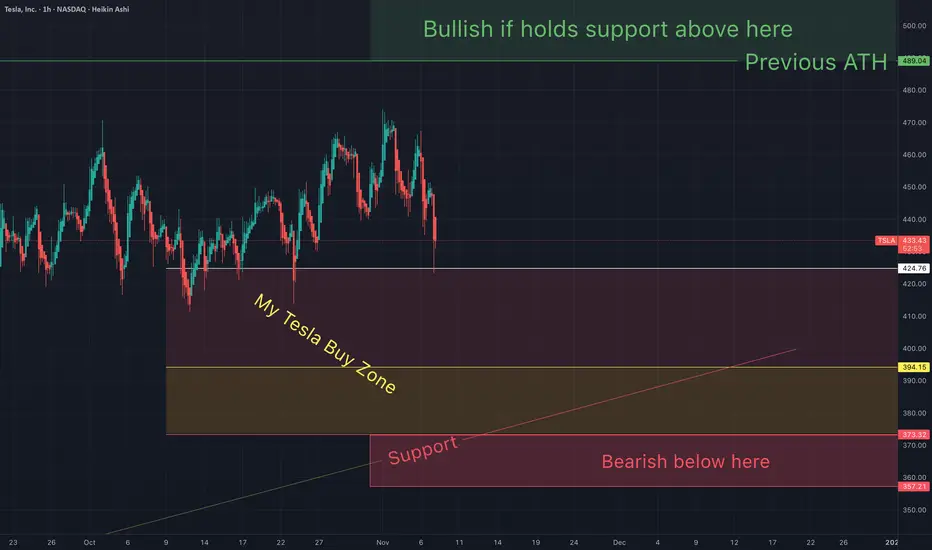
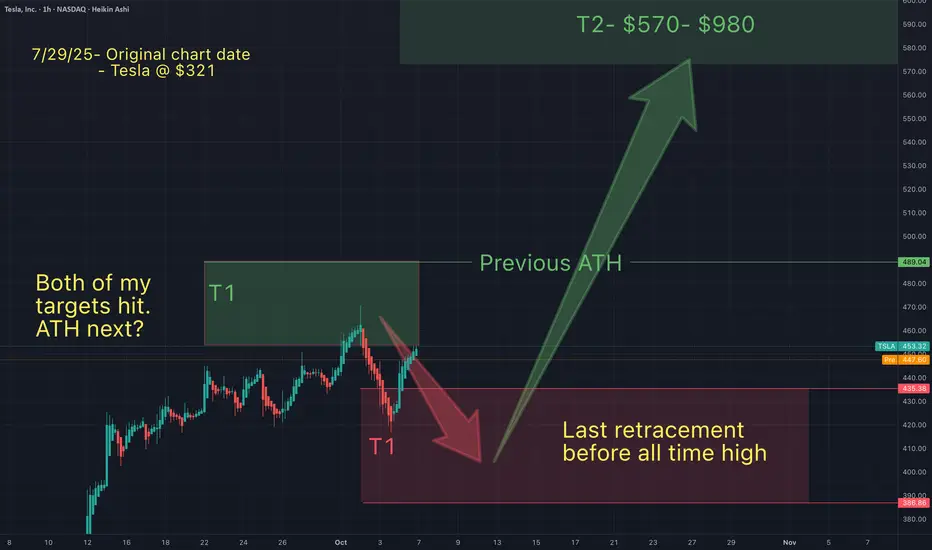
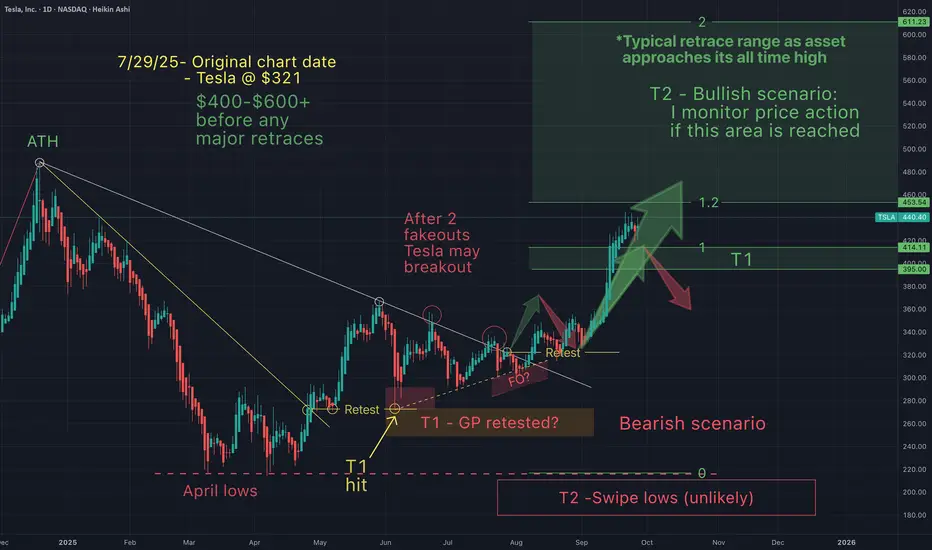
You will ask yourself "how did he know Tesla would do that"?On July 29th I suggested Telsa would follow a predicatble path. Price action has unfolded as anicipated every step of the way.
After a long run up, on Oct 1st I suggested that Tesla had topped at my green T1 and would retrace into my red support zone and bonce.
Now that this has played out, the only question that remains is Tesla going lower into my red T1...or simply all time highs from here?
Either way, Tesla may be about to melt faces (few & small retracements). For the next 2-10 weeks Tesla may form a blow off top (*"IF" Telsa continues this pattern). This blow off, will be the end of this bull pattern that I have been following since the April lows. Once Tesla hits my next range ($570-980) I expect a huge dump. I will monitor price action closely, once Tesla is in this next range.
May the trends be with you.
Telsa - NEW ALL TIME HIGHS INCOMING (price action simplified)Here's a simplified version of my short term targets. On July 29th Tesla was around $321 and I suggested that after a long downtrend, Tesla would breakout, retest and continue up ("without any major retraces)", to between $400-$600.
Tesla has now hit my T2 (currently $460) and I am anticipating a small retracement, before new all time highs in the near term.
Congrats to all of you who have made gains from my charts.
May the trends (continue) to be with you.
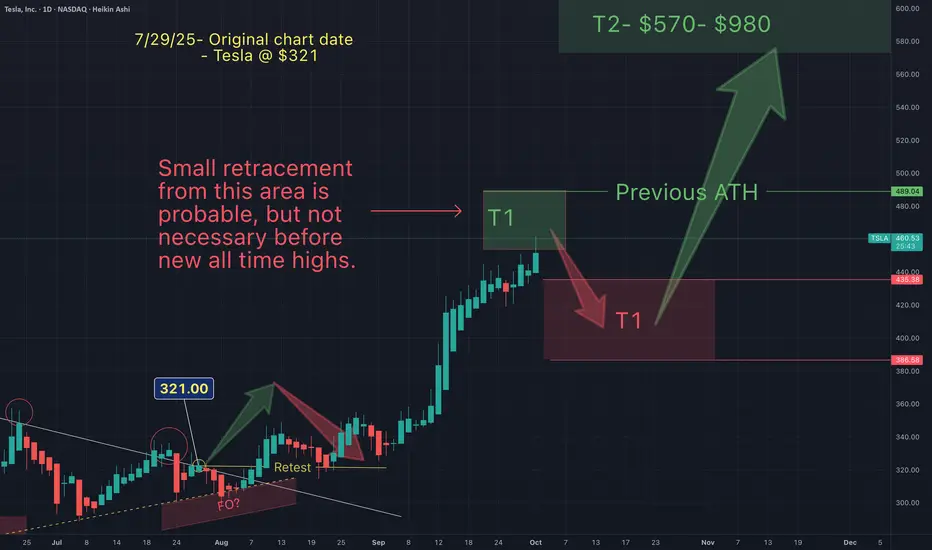
Tesla - NEW ALL TIME HIGH INCOMING (small pullback first?)On July 29th Tesla was around $320 and I suggested that after a long downtrend, Tesla would breakout, retest and continue up ("without any major retraces)", to between $400-$600.
Tesla has now hit my T2 (currently $460) and I am anticipating a small retest before new all time highs in the near term.
Congrats to all of you who have made gains from my charts.
May the trends (continue) to be with you.
Tesla - Here we goooooo!🚗Tesla ( NASDAQ:TSLA ) is finally breaking out:
🔎Analysis summary:
Finally, after a consolidation of four years, Tesla is attempting another all time high breakout. With the bullish triangle coming to an end, bulls are dominating this stock. It just comes down to the next couple of months but a triangle breakout remains far more likely.
📝Levels to watch:
$400
SwingTraderPhil
SwingTrading.Simplified. | Investing.Simplified. | #LONGTERMVISION

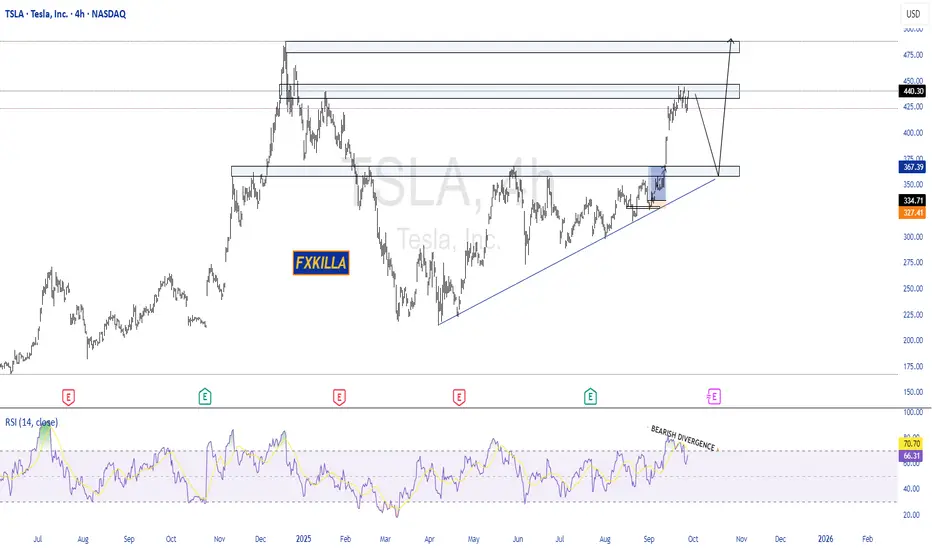
TESLA HIGH PROBABILITY SETUPS SOON!!!🚨 TESLA HIGH PROBABILITY SETUPS 🚨
* Here We Can See The Next Potential Moves For TSLA Coming Hours/Days.
* Keep Your Eyes Close On Your Trading Positions.
* Happy PIP Hunting Traders.
FXKILLA.
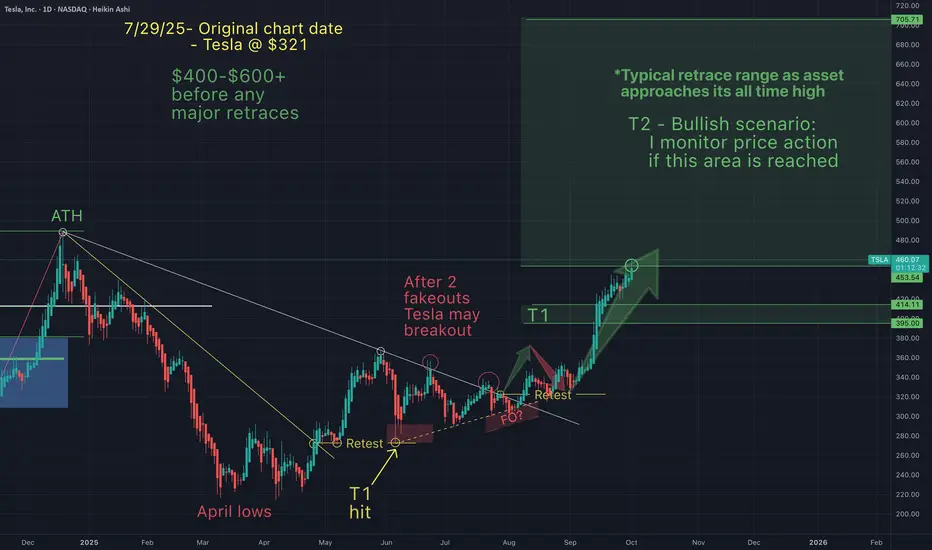
You will ask yourself "how did he know Tesla would do that"?On July 29th Tesla was $321 and I suggested (after a breakout & retest) Tesla would pump straight to low $400s (without any retraces). Now that the trading week has closed here's an update:
Things are still going according to what I expected. But how is this possible...I don't have a crystal ball! How could I have predicted this even *before Elon claimed to have invested 1B into Tesla?
Did Elon know something that we didn't or did I know something you didn't?
Is it the "narative" or the ongoing, repeating, predicable chart patterns?
TA works!
Tesla - SHOW ME THE CHART AND I WILL TELL YOU THE NEWS!Back in June and July, Elon and Tesla were STILL getting a lot of bad press (Elon fighting with President Trump, people burning Tesla cars etc). Those that follow me may recall on July 29th I wrote the following:
"Tesla just needs a narrative shift (ie -new invention etc), & price action changes in a heart beat.
Yet, price action really has less to do with the news making Elon a hero, then a villain and then back and forth...but moreso to do with price action patterns that just keep repeating".
And you'll note that my July chart suggested that the huge pump to $400+ would begin around Sept 1st (Huge green arrow after the retest). What a coincidence that 2 weeks later Elon announces a $1Billion dollar Tesla stock buy (the new anticipated "narrative"). My huge green arrow was there many weeks before this "news". How could I have known?
SHOW ME THE CHART AND I WILL TELL YOU THE NEWS.
On July 29th Tesla was $321 and I suggested that Tesla was about to have a major breakout to at least $400 "with no major retraces". That target has now been hit. Is it because of the news or is it the patterns that just keep repeating?
My T1 targets are probable targets, so I anticipate them almost always getting hit. My ideal buy and sell targets are T2. Tesla now appears to be headed into my T2 target, so it's time to start monitoring price action closely.

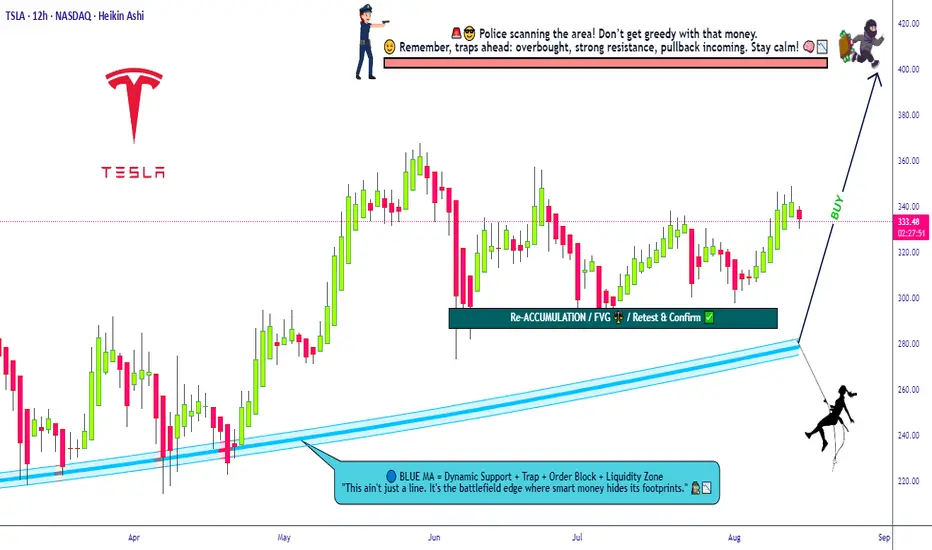
Bullish Tesla Mission Activated – Grab the Loot Now!💎🚨 TESLA STOCK MARKET HEIST PLAN 🚨💎
🕵️♂️ Attention All Thief OG’s, Chart Ninjas & Wall Street Pickpockets!
We’re gearing up for a full-blown Tesla loot mission — bullish, layered, and locked on target! 📈💰
🎯 Plan:
Bullish Layered Entry Strategy 🤑
We’re stacking multiple BUY LIMIT layers like a pro bank job:
💵 (330.00) | 💵 (320.00) | 💵 (310.00) | 💵 (300.00)
(You can add more layers if you want to steal bigger)
🛑 Stop Loss:
The Thief’s SL @ 280.00 💣
📌 Adjust to your own risk — every crew member knows their escape route!
Remember: A good thief never leaves fingerprints, only profits.
🏆 Target:
🚓 Police barricade at 420.00 — better vanish before the sirens!
🎯 Secure the main loot at 400.00 before making a clean getaway.
💡 Thief Strategy Tip:
Layering lets you grab more loot if price dips — like breaking into multiple vaults.
Keep your disguise on and watch the charts — Wall Street guards are always watching. 👀🖤
⚠️ Warning for the Crew:
Major news drops = cops on every corner.
Stay hidden, trail your stops, and protect the stash.
💥 Smash the ❤️ LIKE button if you’re in for this Tesla mission!
📌 Follow the crew for more Thief Trader blueprints — next heist drops soon!
Tesla - Technicals are pretty clear!🚨Tesla ( NASDAQ:TSLA ) respects the triangle:
🔎Analysis summary:
Ever since Tesla was listed on the Nasdaq, we saw perfect cycles playing out. Since 2021, Tesla has once again been consolidating within a bullish triangle pattern. Therefore with the recent bullish break and retest, it becomes more and more likely that Tesla will break out soon.
📝Levels to watch:
$400, $250
SwingTraderPhil
SwingTrading.Simplified. | Investing.Simplified. | #LONGTERMVISION
