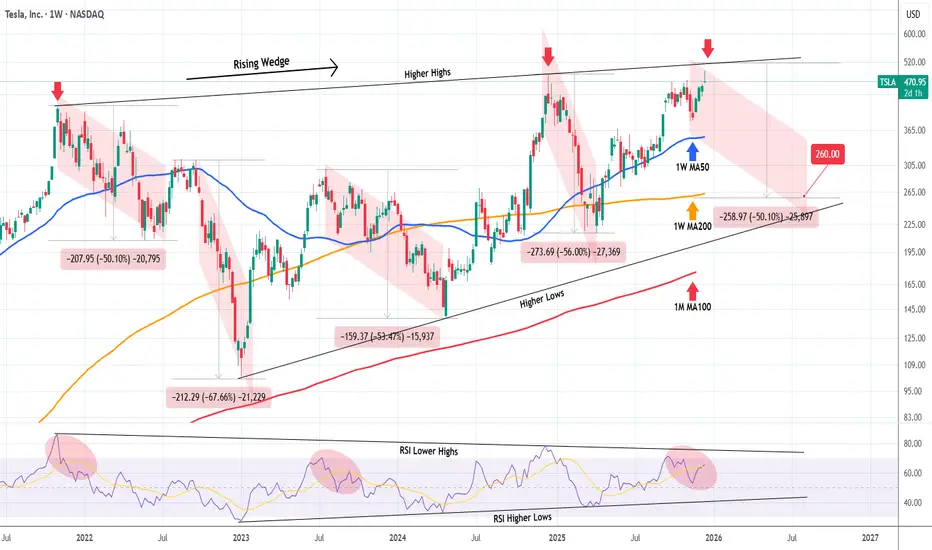
TESLA Did it just get rejected on its 4-year Resistance?Tesla (TSLA) has been trading within a Rising Wedge pattern since the November 01 2021 High. The current weekly (1W) candle almost hit this pattern's top (Higher Highs trend-line) yesterday and today got rejected.
That is the 4-year Higher Highs Resistance that initiated Tesla's last major correction of -56% during December 16 2024 - April 07 2025. Technically this pattern has provided another 3 such major correction events, with all declining by at least -50.10%.
With the 1W RSI also trading within its own Wedge, displaying a similar peak pattern, we expect the price to start a strong decline of at least 6 months. The minimum -50.10% decline projection from the Higher Highs trend-line, gives a $260.00 Target estimate. If the 1W RSI hits its Higher Lows (bottom) trend-line first, we can consider taking the profit on this one earlier.
---
** Please LIKE 👍, FOLLOW ✅, SHARE 🙌 and COMMENT ✍ if you enjoy this idea! Also share your ideas and charts in the comments section below! This is best way to keep it relevant, support us, keep the content here free and allow the idea to reach as many people as possible. **
---
💸💸💸💸💸💸
👇 👇 👇 👇 👇 👇
Teslasignals
TESLA Is December seasonality about to hit it hard?Tesla (TSLA) has been trading within a 3-year Channel Up and has been on a Bullish Leg since the April 07 market low. Not everything on its long-term outlook is positive though as December in the past 5 years, holds a bearish seasonality for the stock as it has aggressively declined.
A 1W MACD Bearish Cross was always present during these times and so is today. With the price trading under a familiar Lower Highs trend-line as in 2023, we see strong probabilities that Tesla starts a new long-term correction. The minimum drop on these corrections has been -50% so a repeat of that would put the price exactly at the bottom of the Channel Up at $236, with only the 1M MA100 (red trend-line) in support.
---
** Please LIKE 👍, FOLLOW ✅, SHARE 🙌 and COMMENT ✍ if you enjoy this idea! Also share your ideas and charts in the comments section below! This is best way to keep it relevant, support us, keep the content here free and allow the idea to reach as many people as possible. **
---
💸💸💸💸💸💸
👇 👇 👇 👇 👇 👇

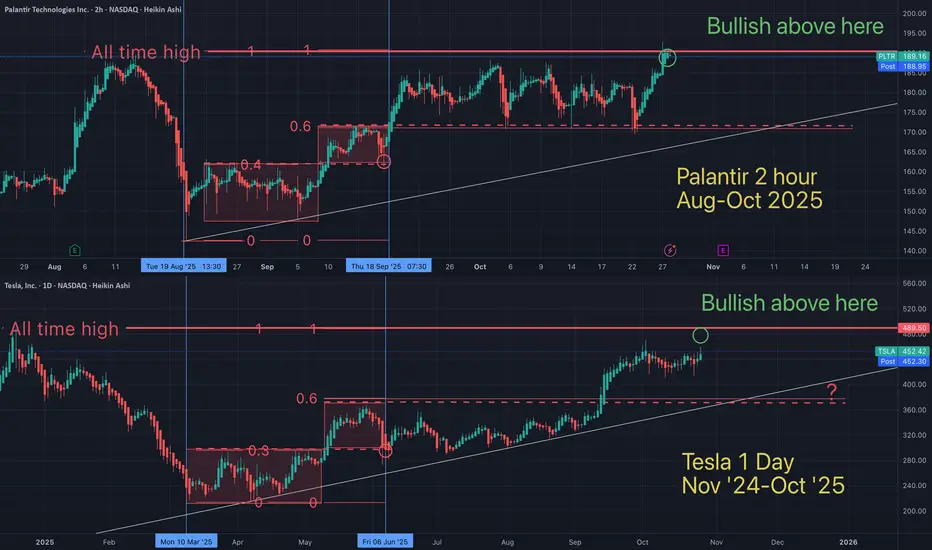
Tesla / Palantir fractal showing both will hit ATH soonFractals are a mathmatical anomaly, if you understand linear equations (and believe the market is "random"). All assets are doing the same patterns over and over, on all time frames. You just need to see it for what it is.
May the trends be with you.
TESLA New Bullish Leg to $600 has started.Last time we took a look at Tesla (TSLA) more than a month ago (September 11, see chart below), we gave a massive buy signal that worked out instantly, as we saw the resemblances between the recent Triangle accumulation pattern and that of late 2024, setting a $600 long-term Target:
This time we take a better look at the Channel Up that has emerged. Technically it looks like a Bearish Leg (red Channel Down) has ended and with the 1D MA50 (blue trend-line) holding, a new Bullish Leg has been initiated.
The previous Bullish Leg, which by the way started after a 1D MA100 (green trend-line) hold, rose by +59.26%. This puts the next Higher High technically above our $600 long-term Target.
Notice also how the 1D MACD is about to form a new Bullish Cross, with all previous ones being a strong Buy Signal. At the same time, the 1D RSI found support and bounced on its 5-month Higher Lows trend-line.
-------------------------------------------------------------------------------
** Please LIKE 👍, FOLLOW ✅, SHARE 🙌 and COMMENT ✍ if you enjoy this idea! Also share your ideas and charts in the comments section below! This is best way to keep it relevant, support us, keep the content here free and allow the idea to reach as many people as possible. **
-------------------------------------------------------------------------------
💸💸💸💸💸💸
👇 👇 👇 👇 👇 👇

Tesla & Palantir STILL following this fractal.On oct 7th I suggested that Tesla and Palantir were following the same fractal (on the daily & 15 min time frames). They are both still following the fractal, over a week later.
Repeating patterns are everywhere, once we know how tho spot them.
May the trends be with you.

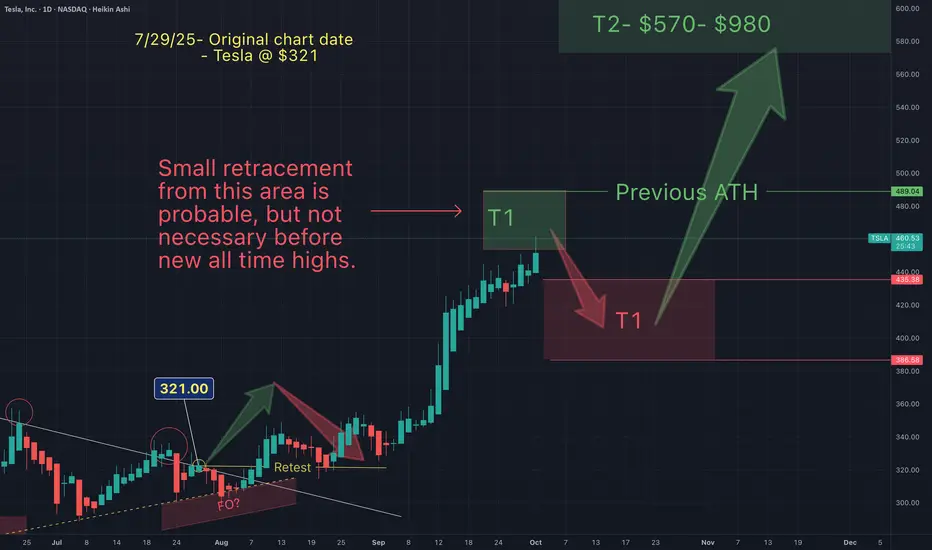
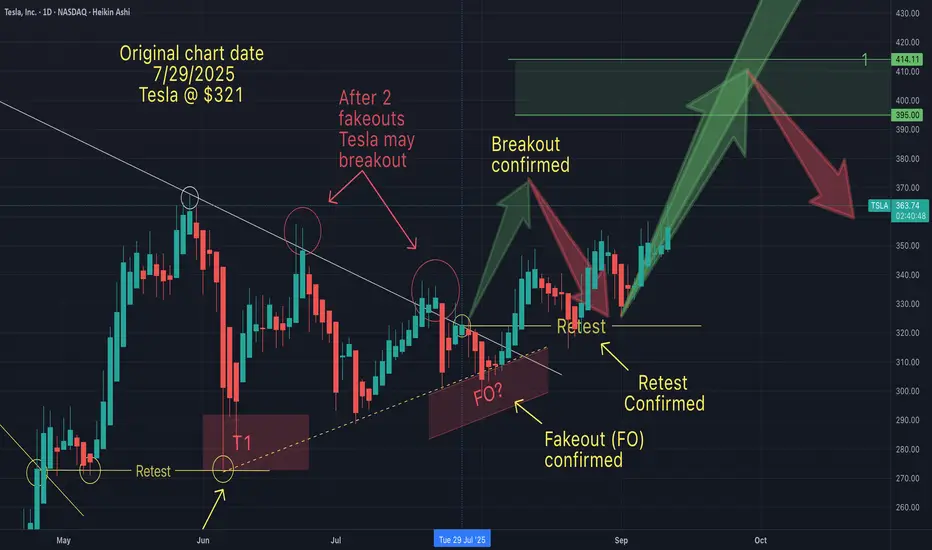
Telsa - NEW ALL TIME HIGHS INCOMING (price action simplified)Here's a simplified version of my short term targets. On July 29th Tesla was around $321 and I suggested that after a long downtrend, Tesla would breakout, retest and continue up ("without any major retraces)", to between $400-$600.
Tesla has now hit my T2 (currently $460) and I am anticipating a small retracement, before new all time highs in the near term.
Congrats to all of you who have made gains from my charts.
May the trends (continue) to be with you.
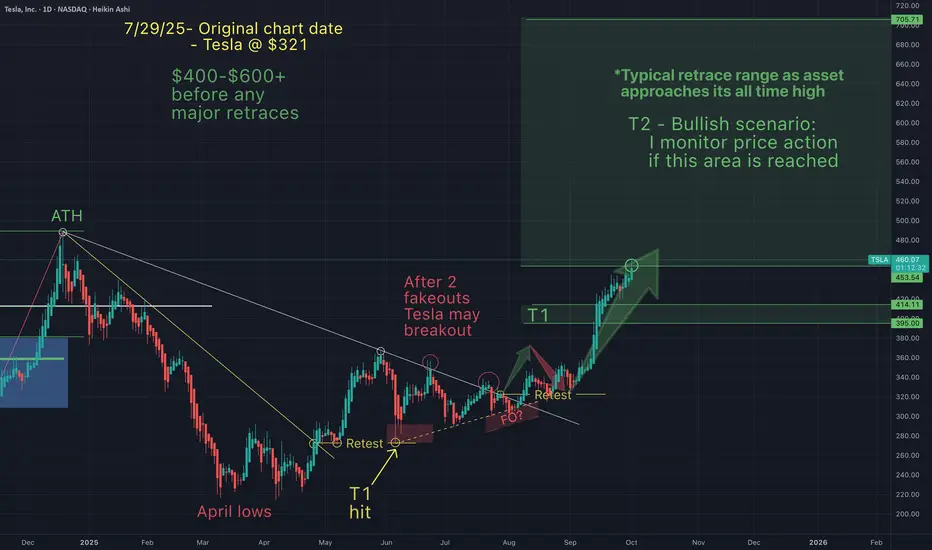
Tesla - NEW ALL TIME HIGH INCOMING (small pullback first?)On July 29th Tesla was around $320 and I suggested that after a long downtrend, Tesla would breakout, retest and continue up ("without any major retraces)", to between $400-$600.
Tesla has now hit my T2 (currently $460) and I am anticipating a small retest before new all time highs in the near term.
Congrats to all of you who have made gains from my charts.
May the trends (continue) to be with you.
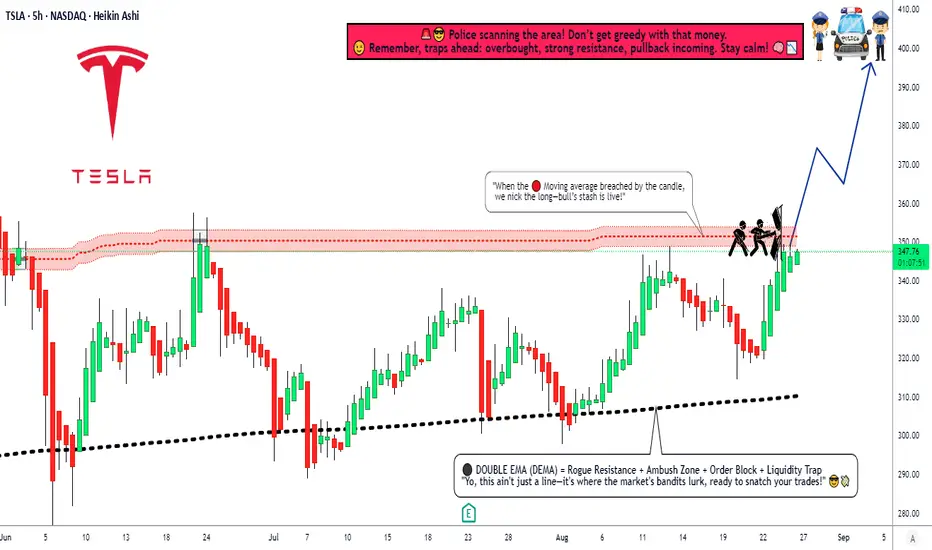
TSLA Breakout Play: Time to Steal Some Profits?🚨 TESLA INC (TSLA) HEIST PLAN - BULLISH SWING/Day LAYUP! 🚨
Yo, Thief OG's! 🐱👤🤑 Time to swarm the TSLA vault. The blueprint is set for a major bullish score. Our intel says the cops (bears) are losing their grip. Let's get this money! 💰💸✨
🎯 THE MASTER PLAN: BULLISH BREAKOUT (PENDING ORDERS)
Based on the Thief Trading Style™ technical analysis, we're plotting a bullish heist on TSLA. We wait for the breakout confirmation, then we strike with precision using our layered entry strategy.
Asset: TESLA INC (TSLA)
Trade Type: Swing / Day Trade
Bias: BULLISH ⬆️⚡
📍 ENTRY: THE HEIST INITIATES (SET YOUR ALARMS! ⏰)
Primary Entry: Breakout and close above $355.00 ⚡
THIEF'S LAYERED ENTRY STRATEGY: 🎯
Don't go all in at one price! We use multiple limit orders to layer into the position after the breakout confirms the move. This is how the pros (and thieves) do it!
Layer 1: Breakout Entry @ $355.00
Layer 2: Pullback Entry @ $350.00
Layer 3: Pullback Entry @ $345.00
Layer 4: Pullback Entry @ $340.00
Layer 5: Pullback Entry @ $335.00
(You can add more layers based on your own capital and risk appetite, you savage!)
📌 IMPORTANT: SET A TRADINGVIEW ALARM at $355.00! This is your signal that the heist is a GO! Don't get caught sleeping. 🛌💤
🛑 STOP LOSS: THE ESCAPE ROUTE
Thief SL for Breakout Entry: $320.00
⚠️ HEAR ME, HEAR ME! Dear Ladies & Gentleman (Thief OG's), adjust your SL based on your own strategy & risk! I am not your financial advisor; I'm just the guy with the blueprint. 🗺️ Place your SL ONLY AFTER the breakout happens. Protect your capital at all costs!
🎯 TARGET: CASH OUT & VANISH
Primary Target: $400.00 🚀
The police barricade is thick up there! 🚓🚧 Once the money is in the bag, don't get greedy! Escape with the stolen profits before they catch you!
Note: Dear Thief OG's, I am not recommending you use only my TP. Take profits at your own risk and based on your own analysis. Secure the bag when YOU feel comfortable! 💼🔥
💎 THIEF'S FINAL WORDS:
This is not a gamble; it's a calculated heist. Follow the plan, manage your risk, and let's eat! 🍽️
Hit the LIKE button if you're riding with us! ✅
BOOST this idea to empower the thief community! 💪❤️
Follow for more daily heist plans! 🎯
Stay sharp, stay profitable, and remember... in the market, be a thief, not a victim! 🐱💻🚀
NASDAQ:TSLA #TradingView #StockMarket #TradingPlan #SwingTrading #DayTrading #Investing #Bullish #TESLA #ThiefTradingStyle
TESLA about to start a parabolic rally to $600.Exactly 3 months ago (June 06, see chart below) we called a bottom buy on Tesla (TSLA) right when it was trading at $284.70:
The price followed this prediction precisely, got out of the Bull Flag and eyes now a new 4-month High above $368.
This would be a break above the 4-month Ascending Triangle, a pattern we last saw during the stocks previous Bullish Leg in mid-end 2024. As you can see, that break-out delivered the Higher High test of Tesla's 3-year Channel Up at $488.
At the same time we are about to form a 1D Golden Cross, which makes the bullish sentiment even stronger.
As with our June 06, we still expect the price to reach $600 and price a new Higher High on the long-term Channel Up
-------------------------------------------------------------------------------
** Please LIKE 👍, FOLLOW ✅, SHARE 🙌 and COMMENT ✍ if you enjoy this idea! Also share your ideas and charts in the comments section below! This is best way to keep it relevant, support us, keep the content here free and allow the idea to reach as many people as possible. **
-------------------------------------------------------------------------------
💸💸💸💸💸💸
👇 👇 👇 👇 👇 👇
Is Tesla on it's way to $400+On July 29th I suggested that Tesla was about to break out to the upside (after fakeouts).
Then on Sep 4th I suggested that after a restest (of the breakout line), Tesla would begin its climb. This portion of the anticipated pattern now been confirmed.
One question now remains...will Tesla hit my T1 ($395 - $414).
What do you think? I'd like to know what the sentiment is out there. I'd like to hear your thoughts.
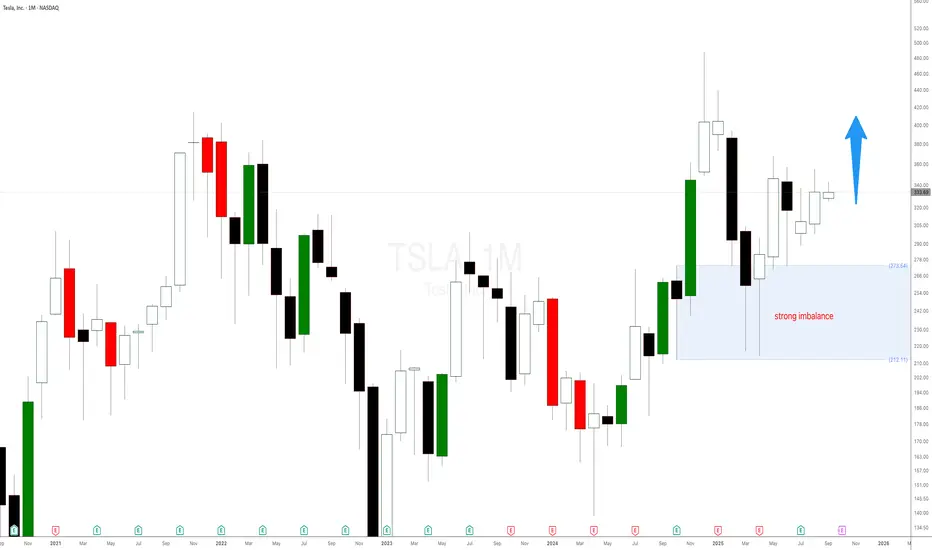
Tesla stock is printing new highs helped by the strong imbalanceTesla stock is printing new highs helped by the strong weekly imbalance as expected and mentioned in a previous Tesla stock analysis. The weekly demand level at $298 is playing out well. There is still a lot of room for NASDAQ:TSLA stock to keep on rallying. You can use the smaller timeframes to add more long positions or new imbalance to trade with even higher probability.
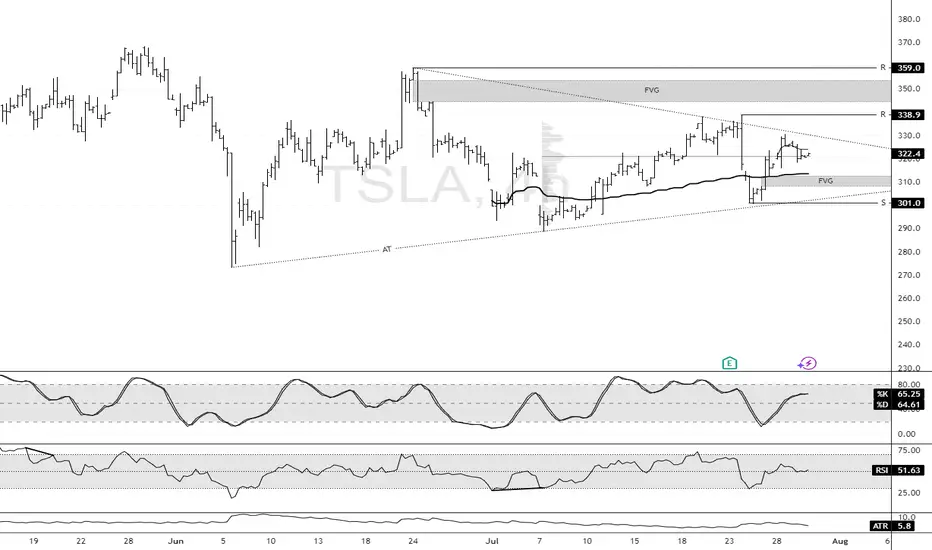
Tesla Builds Toward Fair Value GapFenzoFx—Tesla (#TSLA) bounced from the ascending trendline and closed yesterday's session at the volume point of interest, the $322.3 mark. This level is above the monthly VWAP, meaning bulls are gaining, and bears are losing money.
That said, we expect the uptick in momentum to resume, targeting $338.9, and if this level is breached, the stock will likely aim to fill the Fair Value Gap at $350.0.
TESLA Is it a good buy after the Trump - Musk clash?Tesla (TSLA) lost $150 billion yesterday, closing the session down by -14%, following President Trump's public feud with its CEO Elon Musk. Trump responded to Musk' criticism over the new tax bill, claiming that Musk was upset because the bill takes away tax benefits for electric vehicle purchases.
The obvious question that arises for investors is this: Is Tesla still a buy?
Quick answer? Yes. And once the dust from the fundamentals/ news settles, the technical patterns will prevail.
The long-term pattern since the January 03 2023 bottom has been a Channel Up. The recent April 07 2025 Low has been a Higher Low on this pattern as, even though it didn't touch the Channel's bottom, it did triple bottom on the 0.236 Fibonacci Channel retracement level.
This kick-started the new Bullish Leg of the pattern and yesterday's correction may be nothing more than the start of a Bull Flag formation, similar to those that took place half-way through both previous Bullish Legs.
You can even see how similar the 1W RSI patterns are among the 3 fractals, which have been Accumulation Phases before the start of the 2nd part of the Bullish Leg.
Even though the 1.618 Fibonacci extension is a technical possibility, we can settle for a $600 Target, which would fulfil the conditions of keeping the price action within the Channel Up by the end of the year.
-------------------------------------------------------------------------------
** Please LIKE 👍, FOLLOW ✅, SHARE 🙌 and COMMENT ✍ if you enjoy this idea! Also share your ideas and charts in the comments section below! This is best way to keep it relevant, support us, keep the content here free and allow the idea to reach as many people as possible. **
-------------------------------------------------------------------------------
💸💸💸💸💸💸
👇 👇 👇 👇 👇 👇

Is This the Perfect Moment to Execute the Tesla Heist?💰 Tesla Stock Market Heist Blueprint 🚀
🌟 Hi! Hola! Ola! Bonjour! Hallo! Marhaba! 🌟
Dear Money Makers & Robbers, 🤑💰💸✈️
Here’s our grand plan: a 🔥Thief Trading Style heist🔥 targeting the TESLA stock! Let’s break in with this cunning strategy — chart-ready and primed for action!
🎯 Entry:
The vault’s open! Grab the bullish loot at any price — the heist is live!
Tip: For precision, use a buy limit order on 15m/30m swing highs or lows — that’s your perfect pullback entry!
🛑 Stop Loss:
Thief SL is stashed at the nearest swing low (or just below the MA on the daily chart ~300.00 for swing trades).
Tailor SL to your trade risk, lot size, and your thieving gang’s order plan.
🏴☠️ Target:
460.00 — or vanish before hitting the target to avoid the traps of the overbought zone!
💎 The Setup:
We’re seeing bullishness fueled by key factors: macro moves, fundamentals, sentiment, intermarket trends… it’s all in play! 📈🔗🌏
Check the macro, COT report, sentiment outlook, and future trend targets to stay ahead of the game!
⚠️ Trading Alert:
News releases can flip the game fast.
Avoid fresh trades during major news.
Use trailing stops to lock in those juicy profits and protect your loot.
❤️🔥 Support the Heist Crew!
💥Hit the Boost Button💥 — fuel our robbery plans and let’s keep cashing in every day!
The Thief Trading Style: slick, powerful, and ready for the next heist.
See you soon with another plan, fellow robbers! 🤑🐱👤🤩

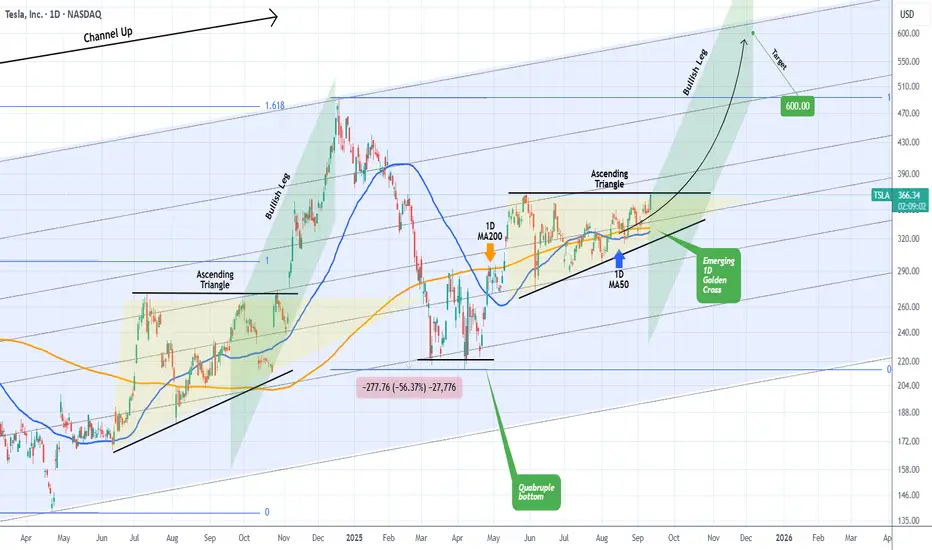
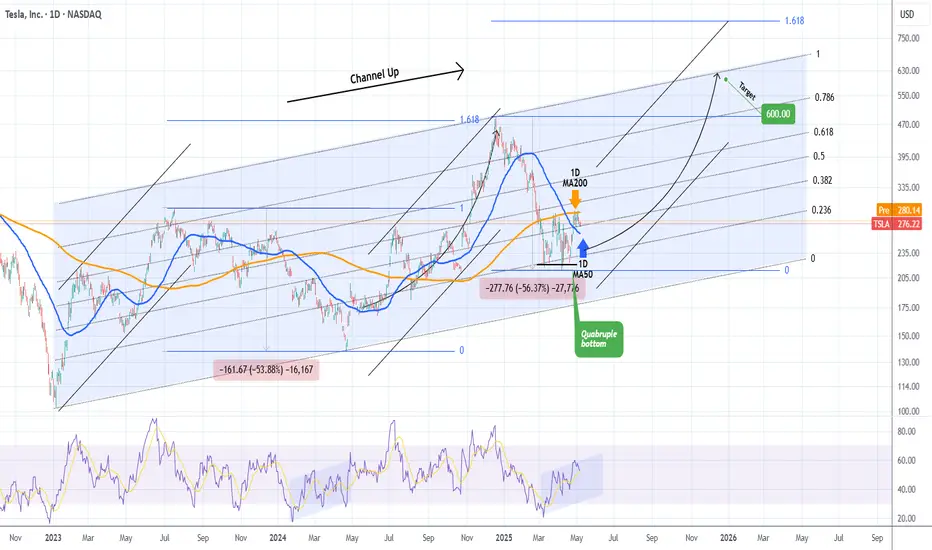
TESLA Is a $600 price tag a pipe dream?Tesla (TSLA) is seeing a steady recovery from the April 21 2025 Low, which has been a Quadruple Bottom, and has found itself consolidating the last 10 days within the 1D MA200 (orange trend-line) and the 1D MA50 (blue trend-line).
The 2.5 year pattern is a Channel Up and this Quadruple Bottom took place exactly on its 0.236 Fibonacci level, with a 1D RSI sequence that resembles the Bullish Divergence of its previous bottom on April 22 2024. The similarities don't stop there as the Bearish Legs that led to those bottoms have almost been identical (-53.88% and -56.37% respectively).
As a result we can technically assume that the current Bullish Leg that will be confirmed with a break above the 1D MA200, will be symmetrical to the previous one, which made a Higher High on the 1.618 Fibonacci extension from the bottom. That is now at $823 but falls outside of the 2.5-year Channel Up, so our long-term Target for the end of the year is $600, which is right at the top of the pattern.
-------------------------------------------------------------------------------
** Please LIKE 👍, FOLLOW ✅, SHARE 🙌 and COMMENT ✍ if you enjoy this idea! Also share your ideas and charts in the comments section below! This is best way to keep it relevant, support us, keep the content here free and allow the idea to reach as many people as possible. **
-------------------------------------------------------------------------------
💸💸💸💸💸💸
👇 👇 👇 👇 👇 👇
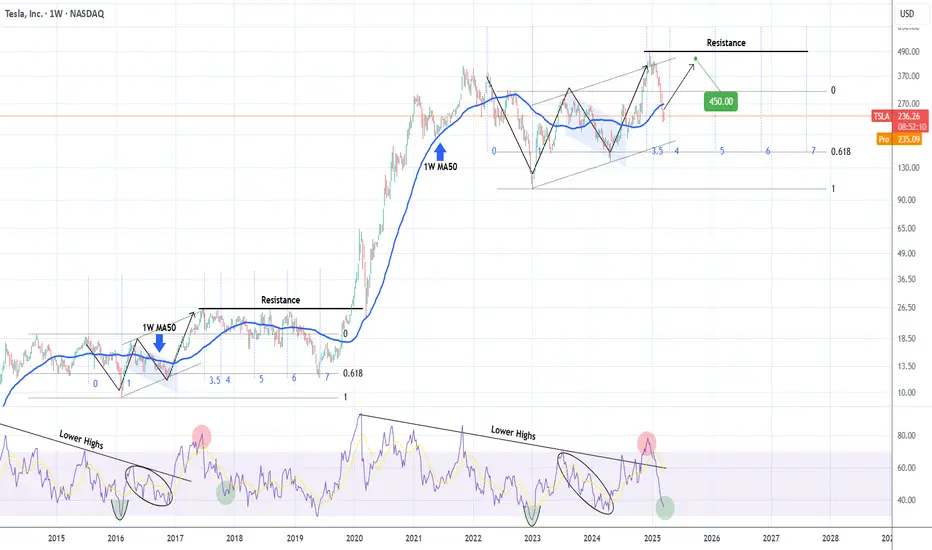
TESLA pricing its long-term bottom. $450 rebound highly likely.Nine months ago (June 26 2024, see chart below), we signaled the start of an enormous rally on Tesla (TSLA), which eventually hit our minimum Target ($400), based on a fractal from 2014 - 2016:
Since the upper 1.382 Fib Target wasn't achieved, the model is readjusted and this count makes better sense. Based on the 1W RSI we are on a bottom similar to October 30 2017 around the 4.0 Time Fib extension. That past sequence initiated a rebound towards the market Resistance before the next decline headed to the 5.0 Fib extension.
As a result, we believe Tesla will find a bottom here and target $450 just below the Resistance level.
-------------------------------------------------------------------------------
** Please LIKE 👍, FOLLOW ✅, SHARE 🙌 and COMMENT ✍ if you enjoy this idea! Also share your ideas and charts in the comments section below! This is best way to keep it relevant, support us, keep the content here free and allow the idea to reach as many people as possible. **
-------------------------------------------------------------------------------
💸💸💸💸💸💸
👇 👇 👇 👇 👇 👇
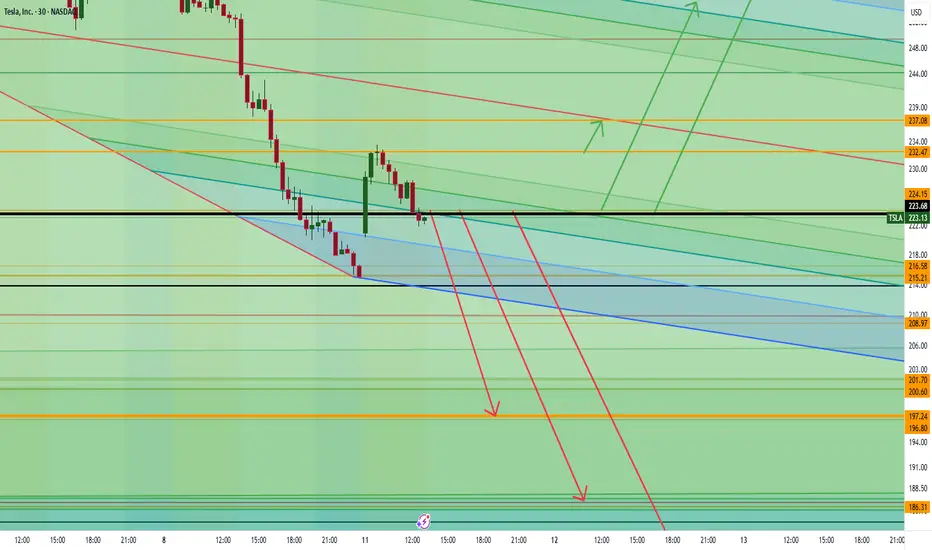
Tesla is About to Collapse… or Skyrocket—Are You In?Tesla is all over the news with boycotts, drama, and market chaos, but the real action is on the charts. If we break below 222, things could get ugly fast with a drop toward 197, 186, and even 176. But if we hold above 223, momentum could send us flying past 232, 237, and potentially 256 or even 264.
Big money is watching, and the next move could be massive. The question is—are you trading this or just watching from the sidelines?
Kris/ Mindbloome Exchange
Trade Smarter Live Better
TSLA’s Next Big Move: Collapse or Skyrocket? Key Levels to WatchTesla (TSLA) is approaching key price levels that will determine its next move.
Potential Downside:
-If TSLA drops below $297, the next level to watch is $292.
-A break below $292 could lead to $283.
-If $283 fails, the price may drop significantly toward $222.
Potential Upside:
-If TSLA reverses, it could rise back to $384.
-A breakout above $384 could push it to $431 and beyond.
If this analysis added value to you, please like and share!
Kris/Mindbloome Exchange
Trade Smarter Live Better

Tesla Stock $TSLA monthly imbalance. Bullish price action to buyTesla Stock NASDAQ:TSLA monthly imbalance at $273 has taken control. Bullish price action to buy shares of Tesla stock. Expecting a decent reaction for this stock in the following days. You can use smaller timeframe stock strategies, bullish option strategies and intraday stock strategies to trade this imbalance.

Quick 4-Min Tesla Analysis: Deeper Pullback or Ready for LiftoffJust wrapped up a quick Tesla analysis (under 4 min)! Right now, we could see a dip to the $289 zone before pushing higher, or a deeper move down to $250 before driving up toward $475.
Where do you think Tesla is headed next? Let me know your thoughts!
Kris/Mindbloome Exchange
Trade Smarter Live Better

TESLA Is this the right time to buy again?Right at the start of the year (January 02, see chart below) we issued a Sell Target on Tesla (TSLA) at $330:
This was based on the 1-year Parabolic Growth Channel of the stock, which formed a Higher High and was already in the rejection phase. The 330 Target was hit yesterday, the price touched the bottom of the Channel and we already see a recovery attempt today.
The condition that completes the strong buy sentiment that is emerging on Tesla, is that it hit yesterday the 1D MA100 (green trend-line) for the first time since October 23 2024. As you can see, the last two times that the stock traded on its 1D MA100, it was the most optimal buy opportunity.
Following a -33% decline on the previous two corrections of the Parabolic Channel, we've always seen an immediate rebound of at least +43.38%. As a result, we expect Tesla to initiate the new Bullish Leg, which, before a Higher High, can target on the short-term $465 (+43.38%).
-------------------------------------------------------------------------------
** Please LIKE 👍, FOLLOW ✅, SHARE 🙌 and COMMENT ✍ if you enjoy this idea! Also share your ideas and charts in the comments section below! This is best way to keep it relevant, support us, keep the content here free and allow the idea to reach as many people as possible. **
-------------------------------------------------------------------------------
💸💸💸💸💸💸
👇 👇 👇 👇 👇 👇

Tesla Update: Navigating the Road to $440Morning Trading Family
Tesla's journey is heating up as we aim for the $440 target. But buckle up, because we've got some resistance zones to watch:
First Stop: $427 - This could be where the ride gets a bit turbulent. Expect some market reactions here.
Next Challenge: $435.35 - Another potential bump in the road. Will we see a correction, or will Tesla's momentum carry us straight through?
The depth of any correction at these levels is still up in the air, but keep your eyes peeled. If the market punches through these resistances, $440 might just be in our sights sooner than expected!
If you found this useful: boost, share, like, and comment. I appreciate all the support! If you're struggling as a trader, I get it - I've been there myself. Jump in, send me a DM or head to my profile; I'm more than happy to help.
Kris/Mindbloome Exchange
Trade What You See

What’s Next for Tesla: $440 or $340?Good Morning, Trading Family!
Here’s the plan: if Tesla moves up to $398 and breaks above it, we could see it head to $440. But if it starts to drop, it might go down to $374 and bounce back up. If it falls below $374, we could see it drop further to $340.
This Sunday, I’m hosting a webinar about how emotions can hurt your trading and how to stay in control.
Send me a message or check my profile for more info. If this analysis helped, like, comment, and share it with others.
Kris/ Mindbloome Exchange ( ME)
Trade What You See
