USDT Dominance(USDT.D%) RoadmapUSDT.D% ( CRYPTOCAP:USDT.D ) is one of the crucial indexes in the crypto market. Alongside token analysis, it’s important to consider this metric because an increase in USDT.D% often leads to a decrease in crypto asset prices.
Currently, USDT.D% has successfully broken through its support lines and even created a fake breakout above the resistance lines.
From an Elliott Wave perspective, it appears that USDT.D% has completed its 5 impulsive waves over the past 10 to 12 days, and we can expect a corrective downward movement.
Additionally, we can observe a negative Regular Divergence(RD-) between two consecutive peaks.
I anticipate that USDT.D% will begin to decline, potentially reaching the Fibonacci support levels. This decline could lead to an increase in crypto asset prices, especially Bitcoin .
Notes: If USDT.D% drops below the support zone(6.234%-6.090%), we can expect a significant upward trend in the crypto market.
💡 Please respect each other's opinions and express agreement or disagreement politely.
📌Market Cap USDT Dominance% Analyze (USDT.D%), 8-hour time frame.
🛑 Always set a Stop Loss(SL) for every position you open.
✅ This is just my idea; I’d love to see your thoughts too!
🔥 If you find it helpful, please BOOST this post and share it with your friends.
Tetherdominance

USDT DOMINANCE Analysis (4H)We are currently observing a well-defined and complete market structure on USDT Dominance. The presence of a bullish Change of Character (CHoCH), along with a strong and decisive break of the bearish trendline, clearly suggests that buyers have stepped into the market and that selling pressure from bears is weakening.
From a technical perspective, this shift in structure indicates a potential trend reversal or at least a strong corrective move to the upside in USDT dominance. As expected in such scenarios, price is likely to pull back toward the identified support zone before continuing its movement toward the previously marked targets. This pullback can be seen as a healthy retracement and a possible opportunity for confirmation rather than immediate continuation.
An increase in USDT dominance typically signals risk-off behavior, meaning capital is flowing out of riskier assets. Therefore, if this scenario plays out, it strongly implies that Bitcoin and most altcoins may experience further downside pressure, leading to more red candles across the crypto market.
For traders, this index can be a valuable macro-level confirmation tool. It is crucial to manage risk carefully, avoid overexposure, and adjust your trading plan in alignment with USDT dominance behavior. Always wait for confirmation, respect key levels, and make sure your position sizing and risk management strategy reflect the current market conditions.
Trade smart, stay disciplined, and let the market confirm the move before committing.
If you would like us to analyze a coin or altcoin for you, first like this post, then comment the name of your altcoin below.

USDT DOMINANCE Is Still Bullish (4H)This analysis is an update to the previous one, which you can find in the related publications section.
First of all you should know that "USDT Dominance" is always moving inverse of BTCUSDT .
This index provides a good roadmap for Bitcoin and high volume altcoins.
For the next phase, the demand zone has been updated. Once price reaches this demand area, another upside move in USDT dominance is expected, which would likely put further downside pressure on the overall crypto market.
If you have a coin or altcoin you want analyzed, first hit the like button and then comment its name so I can review it for you.
This is not a trade setup, as it has no precise stop-loss, stop, or target. I do not publish my trade setups here.

USDT Dominance Turning Bullish | Risk-Off Mode Is Back (4H)Contrary to our previous analysis the market experienced a pump and reclaimed the flip zone Because of this the current wave count for USDT Dominance appears to be more accurate and reliable
The flip zone is a critical area in trading where the behavior of buyers and sellers often changes It can either be a point where buyers give up and start selling alongside sellers or a level where sellers capitulate and buy alongside the buyers Essentially it represents a shift in market sentiment and understanding it can give us a clearer picture of potential price action
In the case of USDT Dominance the flip zone we are observing acted as a resistance level As a result sellers are likely to capitulate and join the buying side reinforcing support at this level This suggests that the price could find a solid footing here before moving higher
Our expectation is that USDT Dominance will hold support at the green flip zone and gradually move toward the target levels marked on the chart If this scenario unfolds it could increase selling pressure in the broader crypto market especially on Bitcoin and some altcoins as traders react to rising stablecoin dominance
It will be interesting to see how this plays out but for now this flip zone represents a key battleground between buyers and sellers and could dictate the near term market dynamics.

USDT DOINANCE is still under the control of bears (4H)USDT Dominance (USDT.D) – ABC Correction Completed? Bearish Wave C in Play 🚨
Altcoins & Bitcoin Recovery Scenario Explained | Smart Money Levels Ahead
If you remember our previous analysis, we were tracking a classic ABC corrective structure on USDT Dominance (USDT.D). In that scenario, Wave B was developing as a Triangle / Diametric pattern, which typically represents a complex correction before the final move.
📌 Now, the structure is becoming clearer.
Based on current price action and market behavior, it appears that Wave B has officially completed, and USDT Dominance has entered Wave C.
🔻 Why Wave C Is Important for the Crypto Market
Wave C in this structure is bearish for USDT Dominance, which is bullish for risk assets:
📈 Bitcoin (BTC) has room for further recovery
🚀 Altcoins may outperform and print greener candles
💧 Capital is likely rotating out of stablecoins and into crypto
Historically, a declining USDT.D often aligns with market relief rallies, increased risk appetite, and stronger momentum across altcoin pairs.
🎯 Key Targets & Market Maker Zones
On the chart, we have identified two major downside targets that act as high-importance reaction levels:
These levels are liquidity-rich zones
Market makers may slow price, create fake breakouts, or engineer reactions
Expect volatility and potential short-term bounces around these areas
⚠️ These are not random levels — they align with structure, Fibonacci confluence, and prior demand zones.
🔴 Critical Rejection Zone (Red Area)
The red-highlighted zone represents a strong resistance / rejection area where USDT Dominance is expected to fail and reverse lower.
If price reacts as expected from this zone:
It would confirm Wave C continuation
Strengthens the bullish case for BTC & Altcoins
Adds confidence to risk-on strategies
🧠 Smart Money Perspective
From a market maker & smart money point of view:
Liquidity above has likely been collected
Distribution appears complete
The path of least resistance is downward for USDT.D
This aligns perfectly with the current recovery narrative across the crypto market.
📊 What Should Traders Watch Next?
Reaction at the red rejection zone
Momentum toward the two marked targets
Confirmation via BTC.D and Total Market Cap
Volume expansion on altcoins
Final Thoughts
Nothing is guaranteed in the market, but structure + sentiment + liquidity are pointing in the same direction for now.
Let’s see how the market reacts.
Stay patient, trade the levels, and manage risk properly.
💬 If you’re tracking USDT.D, BTC, or Altcoins, share your bias in the comments.
📌 Follow for more Elliott Wave, Smart Money, and Crypto Market Structure analysis.

USDT dominance will experience pumps and dumps (4H)One of the key indicators for understanding the market’s direction is this index. As you know, Tether dominance (USDT dominance) moves inversely to Bitcoin.
From the point marked F on the chart, the bearish phase of Tether dominance, which we refer to as wave G, has begun.
Currently, wave G is forming as a bearish ABC correction. Wave A has already completed, and we are now in wave B.
At this stage, it’s not yet clear whether wave B will take the shape of a triangle or a diagonal, but it is evident that wave E of this pattern is forming, which is a bullish wave. As you know, a bullish move in Tether dominance corresponds to a bearish move for Bitcoin and altcoins.
For now, Tether dominance may form a double bottom before moving toward the red box area as part of wave E.
After wave E of B completes, price could drop again for wave F of B or even for the larger wave C, which would signal a potential recovery for Bitcoin and altcoins.
Trading in these zones can be tricky and requires careful risk management and constant attention, as it’s essential to have a deep understanding of the volatility of this index.
You just need to be careful, as price may test the bottom of wave E once more, which could lead to a short-term recovery in Bitcoin and altcoins before a larger drop.
Let’s wait and see how this unfolds.

FireHoseReel | USDT.D Compression Signals a Big Market Reaction🔥 Welcome To FireHoseReel !
Let’s dive into USDT.D analysis.
👀 USDT.D 4H Overview
USDT Dominance is trading inside a large 4H range (box) with a very strong monthly resistance at 6.605%, a key 4H and daily support at 5.859%, and a newly formed midline at 6.210%. A breakout or breakdown of any of these levels could drive a major move across the crypto market.
✍️ USDT.D Trading Scenarios
🟢 Long Scenario:
An initial long setup can be considered on a break below the 6.210% midline, allowing for a small-risk entry. If downside momentum continues and the 5.859% support is lost, a second long position can be opened, with the option to add to earlier positions if conditions allow.
🔴 Short Scenario:
A breakout above the 6.605% range high could activate short triggers across crypto assets, leading to broader market downside. A confirmed break of this level may result in a deep correction across the crypto market.
🧠 Protect your capital first. No setup is worth blowing your account. If risk isn’t controlled, profit means nothing. Trade with rules, not emotions.

$USDT Dominance Is it really different this time?CRYPTOCAP:USDT has broken a major resistance across multiple timeframes, showing clear strength.
Technically, this is not a positive sign for CRYPTOCAP:BTC and other altcoins.
Tether has been in an uptrend for the last 75 days. A reversal could be around the corner in Q1 2025, but for now, the structure does not favour the bulls.
This is not FUD; it's simply clear observations based on the chart.
There has been no major altcoin season this year. Every KOL, including myself, has been wrong in calling an altseason so far.
Is it really different this time?
Only time will tell.
Do share your views in the comments and hit the like button if you like it.
Thank you
#PEACE

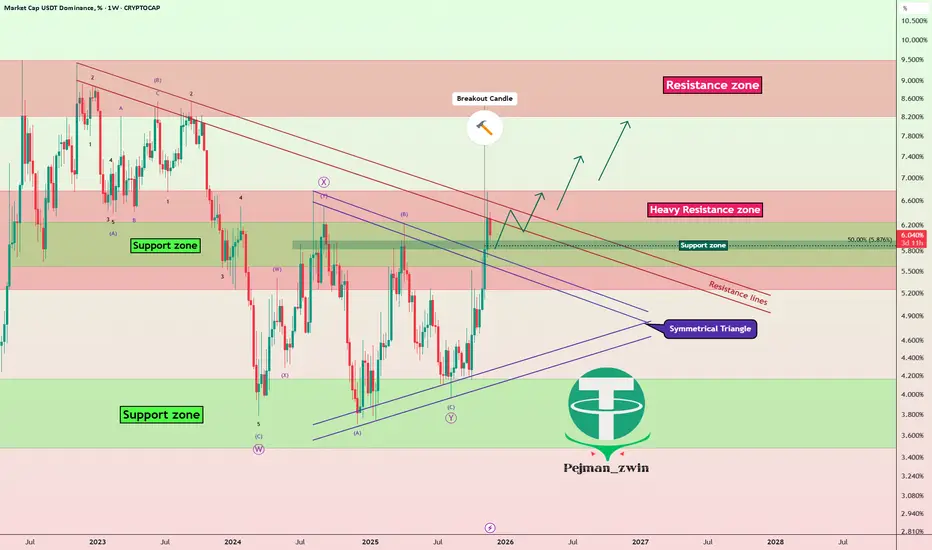
USDT Dominance% Breakout: Crypto Correction Not Over?Today, I’m going to analyze Market Cap USDT Dominance%( CRYPTOCAP:USDT.D ) on the weekly timeframe for you. The reason I want to analyze USDT.D% is that the crypto market conditions have become a bit complex lately, and many factors are influencing it. Therefore, it’s better to take a look at the weekly chart of USDT.D%.
Currently, it seems that USDT.D% is in the vicinity of a Heavy Resistance zone(6.78%-5.25%), but at the same time, there’s also a Support zone(6.24%-5.57%) that could potentially lead to an increase in USDT.D%.
From a classical technical analysis perspective, we can clearly see on the weekly chart that the upper lines of the symmetrical triangle have been broken, and it seems that USDT.D% is currently pulling back to those upper lines. As long as it doesn’t move below those lines again, we can still expect that the market correction is ongoing and hasn’t ended yet. This is a sign that helps us gauge whether the crypto market correction is complete or still ongoing.
From an Elliott Wave perspective, with the breakout of the symmetrical triangle, it seems that USDT.D% might be starting a new impulsive wave.
Since we’re not seeing Regular Divergence(RD-) at the highs, it indicates that the recent upward movement in the crypto market, especially Bitcoin’s( BINANCE:BTCUSDT ) recent gains, is still part of the correction phase.
In conclusion, based on the above analysis, I expect USDT.D% to rise again. If USDT.D% breaks through the resistance lines, we can hope that it will also break through the Heavy Resistance zone(6.78%-5.25%), and that would be a negative sign for the crypto market, potentially leading to deeper corrections in the coming weeks.
So, what do you think? Do you believe the crypto market correction is over, or do you think it will continue? That’s a nice question to leave our analysis with.
Stop Loss(SL): 5.49%
💡 Please respect each other's opinions and express agreement or disagreement politely.
📌Market Cap USDT Dominance% Analyze (USDT.D%), Weekly time frame.
🛑 Always set a Stop Loss(SL) for every position you open.
✅ This is just my idea; I’d love to see your thoughts too!
🔥 If you find it helpful, please BOOST this post and share it with your friends.
USDT DOMINANCE Update (4H)This analysis is an update to the previous one, which you can find in the related analyses section.
Considering that trading volume in the crypto market has decreased and the volatility of large-cap coins has slowed, analyses now require more time to play out.
We still believe that Tether dominance will experience a drop; however, the supply orders from the previous analysis have been consumed. The correct zone for orders is marked by the red box.
It is expected that after hitting the identified supply zone, the price will move toward the targets marked on the chart and drop.
Let’s see what happens.
For risk management, please don't forget stop loss and capital management
When we reach the first target, save some profit and then change the stop to entry
Comment if you have any questions
Thank You

New update on Tether Dominance (4H)Based on the previous analysis, which you can see in that post (), the price did not move above the defined supply zone and headed downward. We have now analyzed Tether Dominance on the four-hour timeframe.
Now it seems it may have another drop ahead and move toward the green zone. The best area for a rejection is the red zone.
This would make Bitcoin and some altcoins more bullish.
As long as this index has not reached the green zone, look for buy/long positions.
For risk management, please don't forget stop loss and capital management
When we reach the first target, save some profit and then change the stop to entry
Comment if you have any questions
Thank You

FireHoseReel | USDT.D : The Next Major Crypto Wave Is Starting🔥 Welcome to FireHoseReel!
Let’s dive into the USDT Dominance (USDT.D) market structure.
👀 USDT.D – 4H Overview
After a strong bullish rally, USDT Dominance has fully retraced its entire move and is now losing a key support zone. This is one of those levels you shouldn’t pass without a position — it’s a critical decision area.
🧮 RSI Analysis
The USDT Dominance RSI has formed an oversold zone around the 33 level. A breakdown and sustained move below this zone could trigger mass USDT selling and strong buying pressure in Bitcoin and altcoins.
✍️ Current Scenario for USDT Dominance (Simple Setup)
🟢 Long Scenario for the Crypto Market:
A clear break and candle close below 5.934%, ideally accompanied by RSI breaking below the 33 level, would confirm momentum. In that case, the move is expected to accelerate, and we’ll likely spend less time inside the position due to high volatility.
❤️ Risk Management & Emotional Discipline
Crypto trading is highly risky. Without proper risk management and emotional control, trading becomes no different from gambling.
Logic must always come before emotions. Learn to manage your trades and enjoy the process with control and discipline.

FireHoseReel | USDT Dominance at a Critical Turning Point🔥 Welcome to FireHoseReel !
Let’s dive into the USDT Dominance (USDT.D) analysis.
👀 USDT.D 1H OverView
USDT dominance moved higher after breaking our key level and is now facing a rejection near 6.491%.
⚡️ Fibbo Retracement
We have applied Fibonacci retracement from the recent low to the high, which clearly highlights the critical levels.
Forming a higher low on these zones could confirm a renewed bullish continuation in dominance.
However, a break below the 0.618 Fibonacci level and the formation of a lower low could act as an early trend reversal signal, forcing us to shift our multi-timeframe market bias.
❤️ Risk Management & Emotional Discipline
Crypto trading is highly risky. Without proper risk management and emotional control, trading is no different from gambling.
Logic must always come before emotions. Learn to manage your trades—and enjoy the process of trading with control and discipline.

FireHoseReel | USDT Dominance Is Loading a Market Shakeout🔥 Welcome To FireHoseReel !
Let's dive into DominanceUSDT Structure .
🎯 After breaking its bullish curve, USDT Dominance formed a higher low on the 4H timeframe compared to the previous bottom.
A sharp drop alongside a strong Bitcoin rally was needed to break its supports — but that scenario did not happen.
🌪 USDT.D has now broken its descending trendline and is facing resistance at 6.073%.
A breakout above this zone could restart a broader market correction and trigger a retest of the 4H high.
🧮 On the 1H timeframe, RSI has formed an overbought level.
A momentum break above this zone could drive USDT dominance sharply higher.
💡 Summary: USDT dominance still has bullish strength.
If it continues to move upward, our short position triggers could become active.
🛞 Risk Management & Disclaimer
Please remember to always use proper risk management and position sizing. Nothing in this analysis is financial advice. The market can change quickly, so always trade based on your own strategy, research, and risk tolerance. You are fully responsible for your own trades.

USDT DOMINANCE Analysis | Altseason Or New Bearish Cycle (3D)Before anything else, pay close attention to the timeframe. This analysis is based on the 3-hour timeframe, and it naturally takes time to unfold.
From the point where we placed the red arrow on the chart, it seems that the correction of USDT dominance has begun. This correction is forming a Diametric pattern, and we are currently at the end of wave F.
From the red zone, we expect a rejection to the downside, because wave F ends in this area and we will enter wave G, which is a bearish wave. During this bearish wave, Bitcoin and altcoins will experience some degree of recovery.
However, based on NeoWave wave-counting principles, in the green zone either:
* The correction of USDT dominance will be completed and it will enter a mid-term bullish phase, leading Bitcoin and altcoins into another bearish cycle,
or
* Wave G of this USDT dominance pattern will extend, and instead of a new bullish phase, an X wave will form. In this scenario, USDT dominance will enter another downward cycle, which could trigger an altseason.
We have to see which scenario plays out!
What do you think?
Comment if you have any questions
Thank You

FireHoseReel | USDT.D 4H Analysis🔥 Welcome FireHoseReel !
Let’s jump into the Tether Dominance Analysis , one of the most Popular Crypto Index .
👀 USDT Dominance – 4H Timeframe
USDT dominance has reached a major resistance level after a very strong upward rally. At this point, I personally have a bearish bias, expecting a rejection and the completion of a multi-timeframe secondary trend. This view is also supported by my mentor, Arshia Azizpour.
📉 RSI Analysis
Since volume isn’t very reliable on dominance charts, we use the RSI oscillator instead.
RSI has just rejected from the 81 zone, which is a strong static resistance inside the overbought area.
This rejection suggests potential cooldown, pullback, or loss of momentum.
📌 Key Levels to Watch
USDT dominance currently has three major levels:
🔺 6.623% – major top resistance
🔸 6.427% – multi-timeframe trend-shift zone
🔸 6.148% – secondary multi-timeframe trend-shift zone
A clean break and candle close below these levels can give us a bearish bias on dominance, which naturally creates a bullish bias for crypto assets.
⚠️ Important Note
USDT dominance still has strong trend momentum.
If it breaks above the current top, it could trigger another wave of downward pressure on Bitcoin and altcoins.
Historically, these dominance spikes hit BTC and ETH the hardest, while altcoins don’t always fall as aggressively.
🛞 Risk Management & Disclaimer
Please remember to always use proper risk management and position sizing. Nothing in this analysis is financial advice. The market can change quickly, so always trade based on your own strategy, research, and risk tolerance. You are fully responsible for your own trades.

FireHoseReel | USDT Dominance & BTC Dominance Overview😄 Hey! How’s everything? Hope you’re doing great!
🍾 Welcome to FireHoseReel — make sure to follow and enjoy the analysis along the way.
If you ever want a custom chart breakdown, just leave a comment and I’ve got you.
😎 Let’s dive into the analysis of two major crypto dominances: USDT and Bitcoin.
✔️ USDT Dominance Technical Analysis
• On the 4-hour timeframe of USDT dominance, we can see that after repeatedly breaking through multiple resistance levels on the chart, USDT.D has reached a point of heavy overbought conditions. It’s now sitting at a strong resistance zone.
If this resistance breaks, USDT dominance could push even higher, which would bring additional downward pressure on the market, especially on Bitcoin and altcoins, leading to another wave of selling.
• If USDT dominance rejects from this zone and starts moving downward, the nearest support to be tested is around 6.148%. Losing this support would signal the beginning of the first bullish wave in the market, giving us a potential opportunity to start opening long positions once this level breaks down.
• Another key level is the resistance at 6.623%.
If USDT dominance breaks above this level, it could trigger an even stronger bearish wave compared to the previous one, causing a deeper correction across the market.
✔️ BTC Dominance Technical Analysis
• On the 4-hour timeframe of Bitcoin dominance, we can see that after the recent market drop, BTC.D also moved downward and went through a relatively deep correction.
What’s important here is that despite the decline in Bitcoin dominance, altcoins did not experience a heavy correction, and most of them held their levels without major downside movement.
• If Bitcoin dominance loses the 58.80% level, it could extend its correction even further.
However, the key reversal zone for the 4-hour trend lies at 59.31%. A breakout above this level can trigger a solid bullish wave in BTC.D.
• Our confirmation for this bullish wave would be the formation of a higher low above this resistance zone, signaling a potential upward trend continuation.
🛞 Risk Management & Disclaimer
Please remember to always use proper risk management and position sizing. Nothing in this analysis is financial advice. The market can change quickly, so always trade based on your own strategy, research, and risk tolerance. You are fully responsible for your own trades.

USDT DOMINANCE Roadmap (1D)From the point where the green arrow is placed on the chart, it seems that a large-degree bullish pattern has started. Waves A and B of this pattern are complete, and we are now in wave C.
Wave A was a diametric, and wave B was a triangle. We are currently in wave a of C. After wave b of C completes, caution is needed because the movement of c of C will begin.
From the green zone, Tether dominance may turn bullish again toward the two red-line targets.
We will try to update this analysis periodically.
For risk management, please don't forget stop loss and capital management
When we reach the first target, save some profit and then change the stop to entry
Comment if you have any questions
Thank You

USDT-DOM- As usual, the charts tell the story very simply, watch the USDT triple top and the RSI divergence for clues.
- At times, tracking USDT trends gives clearer signals than watching BTC price alone.
- It’s an odd moment in the market, no real FUD, constant talk about crypto, yet price movements are surprisingly muted.
- Some major players are trying to shake out weak hands and buy your crypto lower. Stay focused: HODL and accumulate.
Time your entries and DCA, be a trader, not a victim of the cycle.
Happy Tr4Ding !

#USDT This is the most Crucial Level for ALTCOINS!CRYPTOCAP:USDT is hitting a crucial level right now. How the price reacts here will decide the next market direction.
The blue trendline has been acting as resistance since January 2024, and this level is far more important than most realise.
For now, the best move is to wait and watch how the index behaves over the next few days.
A close above this level could make things ugly, but honestly, I think it’ll get rejected, and the market could go insane in the coming days or weeks.
We’ve already seen maximum pain and liquidation. This is that phase where people are bored and rekt, just before something big happens.
This is just my view; always do your own research.
Invalidation: Close above 5.70%
Let me know what you think in the comments, and don’t forget to hit that like 👍
Peace ✌️
#Altcoins

USDT Dominance Breakdown and Market Rally !!!👋🏻 Hey everyone! Hope you’re doing great! Welcome to SatoshiFrame channel.
✨ Today we’re diving into the 4-Hour USDT.D analysis. Stay tuned and follow along.
👀 On the 4-hour timeframe, USDT dominance was rejected downward as it approached its seller-taker zone. With heavy USDT selling, it lost its key support at 4.89%, giving us a confirmation signal for long positions. USDT dominance is now sitting on a key support at 4.74%, with another close support at 4.61%. If these two key levels are broken, the prices of coins can become significantly more expensive.
🔍 Which support zone currently acts as the key one? The 4.74% level can create a short-term pullback in the market, but if you look closely, it has not yet shown any sign of weakening the downtrend or stopping the heavy USDT sell-off. Sellers are not interested in holding USDT in their wallets, and over the past weeks, we have also seen large USDT minting from the issuing company.
Regarding the 4.61% level: breaking this zone will likely require a whale liquidation move, clearing many short positions and large sell orders, which could then trigger a price rally.
🧮 On the 4-hour timeframe, the RSI oscillator is currently in the OverSell zone. Since we cannot rely only on this, we look at the daily timeframe. On the daily chart, USDT dominance is pushing below the 50 level, indicating continued broad selling pressure of USDT — a behavior usually aligned with breakouts in the crypto market.
⁉️ So what information is USDT dominance giving us now? If we observe dominance behavior on the 4-hour chart and compare it with the daily structure, we can identify the beginning of a strong bullish leg in the market, where the prerequisites are the breakdown of the multi-timeframe support zones mentioned in the first paragraph.
❤️ Disclaimer : This analysis is purely based on my personal opinion and I only trade if the stated triggers are activated .

Can USDT.D break its high ? | USDT.D 4H Analysis🥳 Hey everyone! Hope you’re doing great! Welcome to SatoshiFrame channel .
✨ Today we’re diving into the 4-Hour Ethereum analysis. Stay tuned and follow along!
💵 Can USDT.D break its high & cause crypto drop again ? Tether Dominance is hovering near the 5% zone after the Trump tariff rumors — a key resistance that perfectly aligns with the crypto market’s bottom. A breakout here could trigger another leg down across altcoins.
👀 4-hour timeframe of Tether Dominance and we can see that after breaking the 4.6% area, it gave us a confirmation for an uptrend, and in this area, it also formed a higher low compared to its previous low. It easily broke through several resistance levels and reached its top at the 5.16% area, where it is now rejected. Since we are in the holiday period, we have faced weak downward momentum, and now several breakout triggers have formed on the Tether dominance chart which, with Tether volume passing through these areas, the market can start its next move. Note that this top that has currently formed is the same as the bottom of the altcoins that we see on various charts, so breaking this top will not be easy.
🧮 The RSI oscillator can be a great help to us in this analysis, as it allows us to better identify the tops and bottoms of Tether dominance. If the oscillation passes through those desired areas, we can take positions on coins contrary to the direct supply and demand of the chart itself. The 74 oscillation zone is slightly above the overbought boundary, and crossing this area can increase the oscillation volume of Tether buy trades and cause the crypto market to lose its bottom. The next important area is the 50 zone, where a reaction to this area or passing the oscillation limit from this area can form a lower top for Tether dominance and then give us confirmation to start a bullish leg in the market.
🕯 The size of the Tether dominance candles during the rise was significantly smaller but closed with more strength, while during reactions and pullbacks, the size and number of candles increased, which informs us of the weakness of the Tether sellers' trend. A noteworthy point for Tether dominance is the rejection it received from the top and then moved downward, facing weak upward momentum. If the market bottom is in this area and the Tether dominance top is also in this area and this top does not break, the market can soon tend toward a trend change and a drop in dominance may occur.
❤️ Disclaimer : This analysis is purely based on my personal opinion and I only trade if the stated triggers are activated .

Can USDT.D break the Taker Seller Zone ? | USDT.D 1H Analysis👋 Hey everyone! Hope you’re doing great! - ❤️ Welcome to Satoshi Frame .
📅 Today we’re diving into the 1-hour Bitcoin analysis. Stay tuned and follow along!
👀 On the 1-hour timeframe of USDT.D, we can see that after the news of Trump imposing tariffs on China, USDT.D experienced an extremely sharp pump — rising from below 4.3% to near 5%. After that, it formed a trading-range box in this zone. The top of this box lies around 4.89%, overlapping with a “taker-seller” resistance zone where Tether’s market share is currently capped. There’s a key midline at 4.74% and a bottom at 4.59%, completing this trading-range pattern. Price has tested the top three times but failed to break it, meaning USDT.D remains trapped below resistance. A 15-minute multi-timeframe Low has also formed at 4.83%, creating a new structure that, if broken, could trigger Tether selling.
🧮 Looking at the RSI oscillator, since October 12 it has tried three times to enter its 1-hour OverBuy zone but failed each time. Each rejection from around the 70 level led to selling pressure and movement back toward its 50 support zone. This 50 level is a very important static resistance — a breakout above it could push USDT.D toward higher resistance levels. The 50 RSI zone also overlaps with the 4.83% price level, meaning if that area is lost, selling pressure and volume decline could begin.
🕯 The size and volume of recent USDT.D candles show weakness every time it reaches the 4.89% top. Breaking the taker-seller zone will require a large “whale” candle — a strong, high-volume bullish move that can fully absorb the sell orders placed there. In short, breaking this level needs a strong price surge and maximum buying pressure.
🧠 To manage or open new positions using USDT.D as a guide, we can consider these scenarios:
🟢 Breakout of the taker-seller zone: This breakout could be triggered by news or even a Trump tweet :) From a technical standpoint, this area needs a massive, high-volume “whale” candle so that all sell orders in this zone get filled instantly. Once price surges and holds above it, the next resistance would be around 5.1%.
🔴 Break of the 15-minute multi-timeframe Low: This Low sits at 4.83%. A confirmed close below it could signal the start of selling and volume decline. In this scenario, the next support for USDT.D would likely be the box midline — around 4.74%.
❤️ Disclaimer : This analysis is purely based on my personal opinion and I only trade if the stated triggers are activated .
