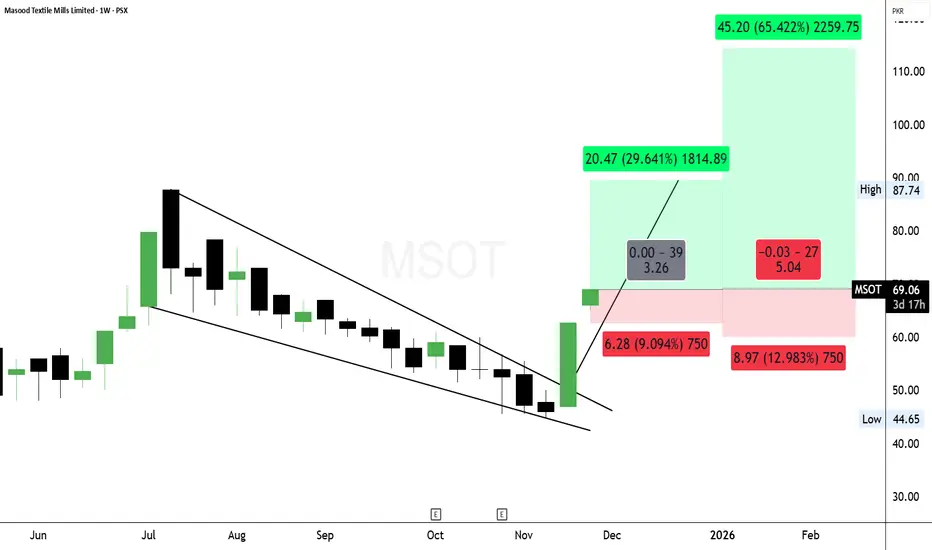
MSOT - Post Breakout Continuation; Targeting 88 - 114MSOT has broken out of a long falling wedge with strong volume. Price is now above key Fibonacci levels (50% & 61.8%), showing a clear trend reversal. Holding above 66 keeps momentum strong, with next resistance at 71. Above that, upside opens toward 88–114. SL below 61.
This is not financial advice. All stock market investments carry risk. Always conduct your own research and consult a licensed financial advisor before acting on any analysis.
Textile
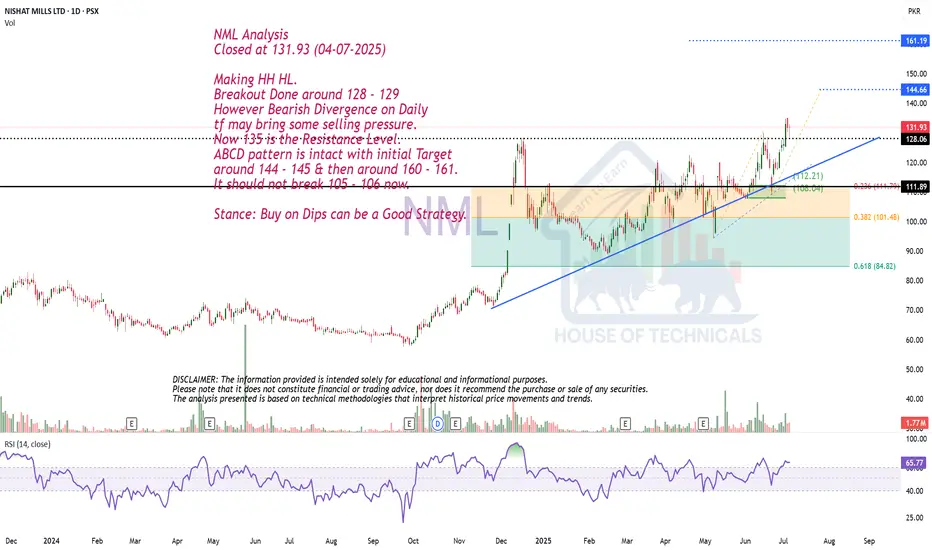
Making HH HL.NML Analysis
Closed at 131.93 (04-07-2025)
Making HH HL.
Breakout Done around 128 - 129
However Bearish Divergence on Daily
tf may bring some selling pressure.
Now 135 is the Resistance Level.
ABCD pattern is intact with initial Target
around 144 - 145 & then around 160 - 161.
It should not break 105 - 106 now.
Stance: Buy on Dips can be a Good Strategy.
Raj Rayon : {"Potential for Best investment for 2024";}
We are at the Biggest Picture available as per the data;
Price has formed a Wave 1 which is an Impulse Wave In the Upward direction;
Wave 2 is a downward 3-Wave-Simple-Correction Structure, retracing Wave 1 by less than a 100% which suffices the Laws of Wave as per the Elliott Wave Theory and now.
======================================================================
Let's talk about the most interesting part The Most Awaited Wave 3 is expected to come out, showing the move which is the reason why we trade,
According to the Elliot Wave Theory the Projection of Wave 3 is at least 161.80% of the Wave 1.
Let's see on the charts the Extension Levels as per the Best Leading Indicactor Fibonacci Extension;
Yo !!!!
Now Last Month that's in August 24, Price has closed above the EMA and hence I see a Buying Momentum in the Monthly chart,
Looking at the Promotor Holding of this company which is more than 90% only confirms my belief in the future growth of the company.
So we have an Overall Target Projection of Rs. 158.03 {Derived as per Fibonacci Extension}
Now Let's look at the other side the {downside/ stop loss/ risk against the reward}

Alok Industries ready for the MoveAlok Industries NSE:ALOKINDS ready for the Move. It has completed its consolidation and ready to try its next upmove. Buy at 28 and Target would be 40.50

Ambika Cotton 👚 and Sanghvi Movers 🏗️- Both leaders 🎥NSE:AMBIKCO
NSE:SANGHVIMOV
Both stocks I have discussed key levels and also Fib Trend analysis
Disc: Invested , Do your own research

MAYURUNIQATH Breakout .
Massive Volumes.
Above all Key EMA.
Good for Short Term and Long Term.
Do Like ,Comment , Follow for regular Updates...
Keep Learning ,Keep Earning...
Disclaimer : This is not a Buy or Sell recommendation. I am not SEBI Registered. Please consult your financial advisor before making any investments . This is for Educational purpose only.

Century Textiles BreakoutThe stock has broken out and retested, therefore may undergo a reversal rally. Trade is supported by Supports Nearby.
Risk Reward Ratio - 2:1
SL is placed below the support zone & the lower trendline. The target is placed near resistance.

#VTL Bullish swing tradeNSE:VTL
just broke out from "VCP pattern" with huge volume and now retraced and took support on "50ema" and also made "inside bar".....
it can be a good swing trade....
only for education purpose, do your analysis before investing.

Raymond BreakoutThe stock has broken out and retested, therefore may undergo a reversal rally. Trade is supported by Supports Nearby.
Risk Reward Ratio - 2:1
SL is placed below the support zone & the lower trendline. The target is placed near resistance.

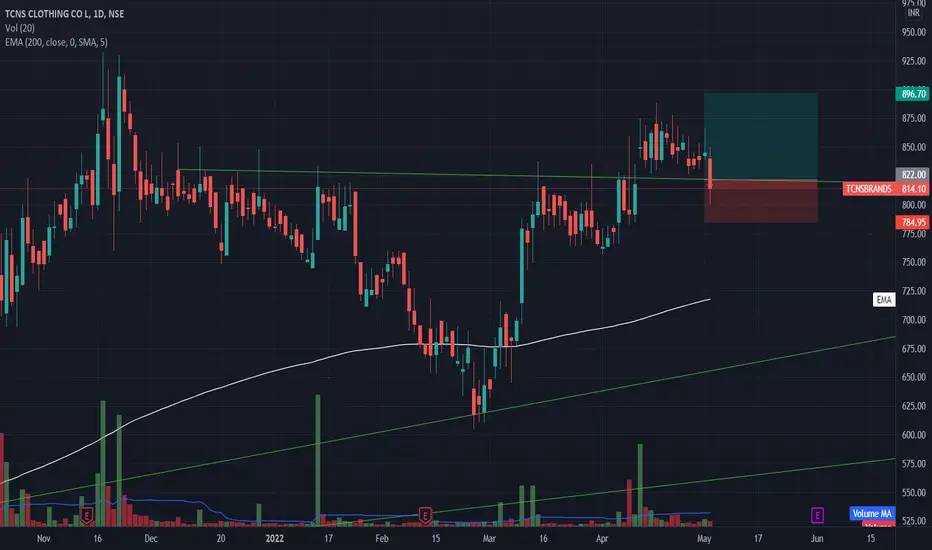
TCNS Clothing BreakoutThe stock has broken out and retested, therefore may undergo a reversal rally. Trade is supported by Supports Nearby.
Risk Reward Ratio - 2:1
SL is placed below the support zone & the lower trendline. The target is placed near resistance.
Page Industries BreakoutThe stock has broken out and retested, therefore may undergo a reversal rally. Trade is supported by Supports Nearby.
Risk Reward Ratio - 2:1
SL is placed below the support zone & the lower trendline. The target is placed near resistance.

SARLASARLA- Formed Rounding Bottom in 1 week view & Channel Breakout in Daily View.
FIB Retracement shows target of near 100
Disc- Not a recommendation. Just for Learning use.

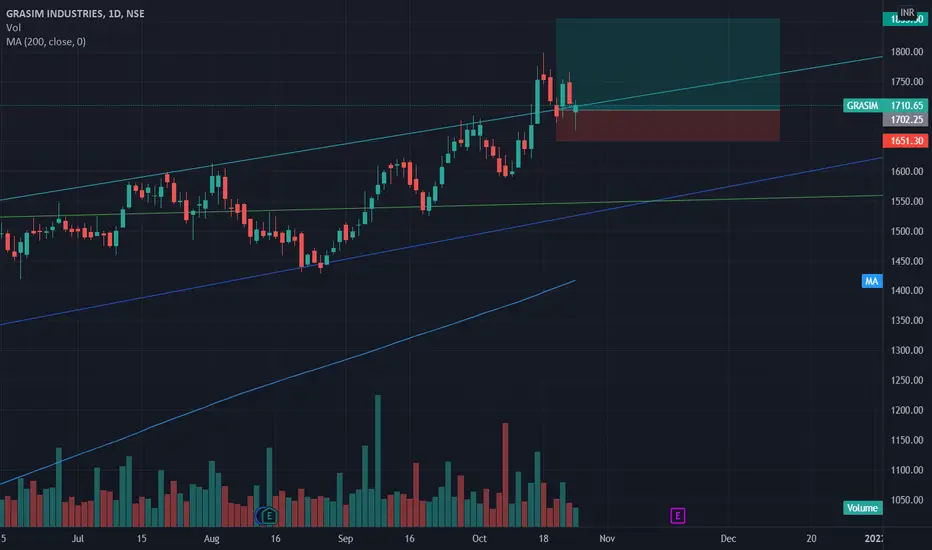
Grasim BreakoutThe stock has broken out and may undergo a rally. Trade is supported by brokerage calls and Supports Nearby.
Risk Reward Ratio - 3:1
SL is placed below support zone & the upper trendline. The target is placed near swing high.
This is a high risk trade as the market is in a overall bearish sentiment. Plan Trades Accordingly.
Postional Trade As #textile Sector Showing the strength from last few Weeks, in this Volatile market, All Textile Stock show the strength and Raymond is one of them Also on the verge of Break out.Plan your trade, Happy trading.

mirza int.Add Mirza Int. At cmp and near 55
we seen deemand up to 73/89/106/145+
view invalid below 39 wcb
Note: All views are education purpose only.

Nahar PolyFilmsRounding Bottom Pattern Complete on Weekly Charts from 2018 to 2021
BO with Biggest Volume above 84
Tgt1 - 118 (as per Fibonnaci)
Tgt2 - 136 (on the Long term Trend Line of 2015)
Tgt3 - 177 (as per Fibonnaci)
SL - 84

Bannari Amman Spinning Mill - BO from Rounding Bottom PatternWeekly Closing above 143, confirms BO from Rounding Bottom Pattern.
Next Targets - 165 - 190 - 223 - 248

Picanol, almost time to go long?This is a quality company but got sold off because of the cyclical nature of the business and the problems with the trade war.
50-40 range wouldn't be bad to pick this stock up.

