The Market is a Mirror — Not a Battlefield“Most traders fight the market.
The wise quietly observe — and realize they were fighting themselves.”
Every trader begins with the same illusion:
That the market is an opponent.
That success means winning against it.
But the truth is deeper — and quieter.
The market doesn’t fight you, test you, or trick you.
It simply reflects you : your fear, greed, patience, and discipline.
Why Most Traders Struggle?
When you call the market your enemy, you create conflict.
You start reacting emotionally to every candle.
You chase wins to heal your losses.
You overtrade to prove your worth.
And every chart becomes a battlefield of ego.
The Mirror View
Every loss points to your impatience.
Every missed entry points to your need for control.
Every winning trade tests your ability to stay humble.
That’s not punishment — it’s reflection.
When you begin to see this, your mindset changes:
You stop forcing trades.
You stop fighting.
You start listening.
How to Practice This
Pause before every trade and ask: “What am I feeling?”
Journal not just your entries, but your state of mind.
Watch your reactions more than your P&L.
Let silence between trades sharpen your awareness.
Trading mastery isn’t found on the chart —
It’s found in the mirror .
The moment you stop fighting the market,
you begin to understand it.
📘 Shared by @ChartIsMirror
If this perspective resonates with you, share your reflection below —
What do you see in your market mirror?
Thechartisthemirror

Gold (XAUUSD) – 13 Oct | Key Supply Zone in Focus🟡 Gold (XAUUSD) Analysis – 13 October
Hello Disciplined Traders,
Welcome to the Chart Is Mirror Community 👋
Market Context
• Gold remains in a H4 pullback phase , with M15 structure bearish after clear ChoCH + BoS confirmation — both aligned to the downside.
• Price is currently trading inside a strong supply + M15 LH zone 4048.8–4058.1 .
Key Observations
• A micro structure shift downside has already occurred on M1.
• Now waiting for a clean break of structure to confirm continuation of bearish momentum.
• Once confirmed, we’ll mark the micro POI and plan a short setup on the M1 pullback.
Execution Plan
• If price respects the current 4048.8–4058.1 supply zone and confirms on LTF, plan for shorts accordingly.
• If price breaks and sustains above the zone, that will be a M15 structure shift upside — no shorts, stay out and reassess for long setups.
Discipline means waiting for clarity — let confirmation lead, not bias.
📘 Shared by @ChartIsMirror

Gold (XAUUSD) – 10 Oct | Watching Key Zones for Short Setups🟡 Gold (XAUUSD) Analysis – 10 October
Hello Disciplined Traders,
Welcome to the Chart Is Mirror Community 👋
Market Context
• After marking a new all-time high at 4059.350 , Gold is currently in a pullback phase.
• CHOCH + BOS have been confirmed on the M15 structure , signaling that H4 may retrace deeper .
• Both H4 and M15 structures are now aligned for a short-term downtrend until a structure shift occurs back to the upside.
Key Observations
• First POI for short setup: 4007–4025 ( M30 OB zone ).
• Next potential POI: 4035–4044 ( fractal point zone ) — if retested and respected, it could offer another short opportunity.
Execution Plan
• Wait for price to pull back to either POI.
• If respected with LTF confirmation , plan short setups accordingly.
• If price continues forming new structure lows without a pullback, we’ll reassess the chart and plan based on fresh price action.
Stay disciplined — structure defines direction, confirmation defines action.
📘 Shared by @ChartIsMirror

Gold (XAUUSD) – 8 Oct | 4K Milestone Reached, Buy Zones in Focus🟡 Gold (XAUUSD) Analysis – 8 October
Hello Disciplined Traders,
Welcome to the Chart Is Mirror Community 👋
Market Context
• Gold continued its bullish momentum and achieved another psychological level at 4000 , marking a new all-time high at 4037 .
• H4 and M15 structures are aligned and strongly bullish, showing clear continuation of the uptrend.
Key Observations
• After the 4K breakout, price maintained strength with no signs of exhaustion.
• A pullback towards 3996–3984 day low zone would be the first area of interest for long setups.
• The next potential demand zone is 3969.5–3962.5 .
Execution Plan
• Watch for pullback and LTF confirmation from either of the above POIs to plan long entries.
• If market sustains above 4037 and creates new structure highs, we’ll reassess and plan accordingly.
Patience refines entry — let structure lead the trade.
📘 Shared by @ChartIsMirror

Gold (XAUUSD) – 6 Oct | Waiting for Retest of Key Buy Zones🟡 Gold (XAUUSD) Analysis – 6 October
Hello Disciplined Traders,
Welcome to the Chart Is Mirror Community 👋
Market Context
• Gold remains in bullish momentum , with both H4 and M15 structures aligned to the upside.
• In today’s Asia session, the market broke the previous all-time high 3897 and cleared the key 3900 psychological level .
• After the breakout, price pulled back briefly to retest 3900 and then resumed bullish continuation.
Key Observations
• Current structure confirms strong buyer control, with pullbacks offering continuation setups.
• Four potential POIs for long opportunities are in focus:
– 3919–3924 (OB zone)
– 3906–3899 (recent demand zone)
– 3888.5–3876.9 (day low + deeper demand zone)
– 3846–3838 (HL + strong demand zone)
• Keep in mind: market may sweep liquidity below demand before resuming upside.
Execution Plan
• Wait for price to retest any of the POI zones.
• Look for LTF confirmation before entering long setups.
• If none of these zones hold, we will reassess lower levels for new opportunities.
Stillness is clarity — let price pull back into your zones before execution.
📘 Shared by @ChartIsMirror

Order Blocks: Where Smart Money Leaves Its Footprints“The market doesn’t move randomly.
Every big push leaves a shadow — a clue of who was in control.”
That clue is what traders call an Order Block .
What is an Order Block?
An Order Block (OB) is the last bullish or bearish candle before a strong impulsive move in the opposite direction.
Think of it as the area where institutions placed their orders to fuel that move.
In an uptrend , look for the last down candle before a strong rally.
In a downtrend , look for the last up candle before a sharp drop.
These zones often act like magnets — price revisits them to “retest” before continuing.
Why Do Order Blocks Matter?
They reveal where the big money entered.
They create high-probability zones for entries.
They help traders avoid chasing moves at highs or lows.
How to Spot an Order Block
Identify a strong impulsive move (long-bodied candles, clear displacement).
Mark the last opposite candle before that move.
Wait for price to return to that zone.
Look for LTF confirmation — a ChoCH, BOS, or rejection wick.
Align with higher timeframe bias (H4/H1) for best results.
Example
Refer to the XAUUSD M15 chart above:
Gold formed a strong bullish rally, leaving behind a bullish order block zone at 3764.5 – 3757.5 .
When price retraced into this OB, it tapped liquidity from the stop area, then gave LTF confirmation (micro structure shift).
This long setup delivered an impressive 1:8 RR rally for disciplined traders who waited for the OB mitigation and entry confirmation.
Smart money doesn’t chase price — it waits for the market to come back home.
But here’s the secret most traders miss:
Order blocks alone are never the full story.
They work best when combined with liquidity sweeps, structure shifts, and precise timing .
That’s where the deeper edge lies — and it’s what separates surface-level knowledge from mastery.
📘 Shared by @ChartIsMirror

Gold (XAUUSD) – 3 October | Bearish Shift After Sharp Drop🟡 Gold (XAUUSD) Analysis – 3 October
Hello Disciplined Traders,
Welcome to the Chart Is Mirror Community 👋
Market Context
• Yesterday our M15 HL zone 3858.5–3853.5 played out perfectly, and the long setup hit TP ✅.
• Later in the session, Gold retested the all-time high 3895.5 before dropping sharply by nearly 770 pips .
• This move shifted the M15 internal structure bearish , confirming short-term downside momentum.
Key Observations
• My marked M15 POI 3863.5–3873.5 for shorts was tested in the early session.
• With LTF confirmation, a sell setup was executed and hit 120 pips TP cleanly.
• Current structure favors further short opportunities if supply zones hold.
Execution Plan
• Next POI to watch for shorts: 3859.8–3851.7 zone .
• If price retests and respects with LTF confirmation, another sell setup can be planned.
• If invalidated, reassess the price action for new structure shifts.
Discipline is patience — let the market confirm your plan before execution.
📘 Shared by @ChartIsMirror

Gold (XAUUSD) – 2 Oct | HL Retested, Watching for Long Setup🟡 Gold (XAUUSD) Analysis – 2 October
Hello Disciplined Traders,
Welcome to the Chart Is Mirror Community 👋
Market Context
• Gold printed a new high at 3895.5 in yesterday’s session, confirming strong bullish momentum.
• Price pulled back to retest the M15 HL + Demand zone 3858.5–3853.5 , which was respected.
• Currently trading around 3865–3868 .
Key Observations
• After the HL retest, a micro structure shift upside has appeared on LTF.
• This signals that a long setup is preparing , pending further confirmation.
Execution Plan
• Wait for clear LTF evidence before entering.
• If confirmed, we will look to execute our buy setup .
• Stay patient — let price action complete the setup first.
Discipline means waiting for the right confirmation, not forcing a trade.
📘 Shared by @ChartIsMirror
Gold (XAUUSD) – 1 Oct | Watching 3871 Supply Zone Reaction🟡 Gold (XAUUSD) Analysis – 1 October
Hello Disciplined Traders,
Welcome to the Chart Is Mirror Community 👋
Market Context
• As per yesterday’s analysis, market didn’t respect our buy zones due to a sharp fall from the all-time high 3871.890 .
• This fall shifted the M15 structure downside , forming a CHoCH — but whether it’s a liquidity grab depends on a clean close above 3871.890.
• Market took support from the 3797.5–3790.5 OB zone , and with volume + LTF confirmation, gave us a strong buy setup from 3805 , which played out beautifully.
Key Observations
• Price is now trading inside the 3871.890–3866.5 supply zone .
• Although a new all-time high 3875 was touched, M15 failed to close above the previous high 3871.890 , showing weakness and potential correction.
Execution Plan
• Watch the 3871.890–3866.5 supply zone carefully.
• If there is LTF confirmation , we can plan a short-term sell setup from this zone.
• If M15 closes above 3871.890 , invalidate the sell idea — instead, look for buy setups on pullbacks.
Discipline first — let the market confirm before you commit.
🚀 Congrats to everyone who caught the sharp upside move from 3805 with us — patience paid off!
📘 Shared by @ChartIsMirror

Gold (XAUUSD) – 30 Sep | Waiting for Retest of Key Buy Zones🟡 Gold (XAUUSD) Analysis – 30 September
Hello Disciplined Traders,
Welcome to the Chart Is Mirror Community 👋
Market Context
• Gold remains in bullish momentum , with H4 aligned to M15 structure.
• Price is currently trading around 3852 (all-time high) .
• Recent key levels formed:
– Asia Day Low: 3825.8
– M15 OB: 3840–3838
– M15 Demand Zone: 3831–3825.8
Key Observations
• First potential POI for long setup: 3840–3838 (M15 OB).
• If not respected, watch the 3831–3825.8 demand zone + Asia day low as the next strong buy area.
• Keep in mind, market may sweep liquidity below the demand zone before a strong up move — so reaction at the zone is crucial.
Execution Plan
• Wait for price to retest either of the above POIs.
• Look for LTF confirmation before committing to long setups.
Stillness before execution — let price come to your levels, not the other way around.
📘 Shared by @ChartIsMirror

Gold (XAUUSD) – 29 Sep | Key Demand Zones in Focus🟡 Gold (XAUUSD) Analysis – 29 September
Hello Disciplined Traders,
Welcome to the Chart Is Mirror Community 👋
Market Context
• Gold remains in bullish momentum with H4 and M15 structure aligned.
• Price printed a Change of Character (ChoCh) + Break of Structure (BoS) along with a new all-time high at 3798.79 , confirming bullish intent.
Key Zones to Watch
• Primary POI for Long Setup: 3770.8–3759.8 demand zone (also M15 HL).
• Secondary POI for Long Setup: 3752.5–3743 strong demand zone.
– Below this zone sits unmitigated sell-side liquidity . Price could sweep this liquidity before a strong up-move.
Execution Plan
• Wait for price to pull back to either POI.
• Look for clear LTF confirmation before executing a buy setup.
• If price stays above 3795 and forms new price action, reassess and look for fresh opportunities — as long as bullish structure remains intact .
Stay patient and let price come to your levels — discipline is your edge.
📘 Shared by @ChartIsMirror

Stop Hunts: How the Market Tests Your Patience“If the market keeps taking your stop before running in your direction…
You might not be wrong — just too early.”
What is a Stop Hunt?
A Stop Hunt is when price pushes just far enough to trigger stops sitting above a high or below a low — and then reverses.
It’s not random. It’s the market collecting liquidity before the real move begins.
Why Stop Hunts Happen
Stops are easy targets — they’re predictable.
Institutions use them to fill big orders at the best prices.
Your loss is their entry.
How to Spot a Stop Hunt
Mark clear swing highs and lows — obvious levels most traders are watching.
Watch price sweep above/below those levels with a quick move.
Wait. Don’t jump in — the first move is usually a trap.
Drop to a lower timeframe (M1/M5) to get a precise entry confirmation.
Look for structure shift or ChoCH after the sweep.
Only then, consider entering — now you’re trading with the market, not against it.
Example
Refer to the Gold(XAUUSD) M15 chart above:
Notice how price took out the previous swing low with a liquidity grab from the stop area — trapping early buyers — and only then launched into a strong up move.
This is the classic stop hunt behavior that shakes out weak hands before the real trend continues.
Patience turns a losing stop into a winning entry.
The market isn’t against you — it’s just testing who can wait.
📘 Shared by @ChartIsMirror

Gold (XAUUSD) – 25 Sep | Key Supply & Demand Zones in Focus🟡 Gold (XAUUSD) Analysis – 25 September
Hello Disciplined Traders,
Welcome to the Chart Is Mirror Community 👋
Market Context
• Gold remains in an H4 pullback with M15 downtrend aligned.
• Yesterday, price broke the key M15 HL 3736.6 , confirming a market structure shift to the downside.
• Price retested our first sell POI — 3750.5–3756 OB + S&R — and is now moving lower, in line with structure.
Key Observations
• A break below 3717.5 would confirm a new M15 BoS and strengthen the bearish bias.
• Next short POI : Strong supply zone 3765–3772 . Observe price reaction here for best short opportunities.
Potential Buy Zone
• If market breaks 3717.5 first, watch 3707.5–3695.5 demand zone for short-term long setup — but only with clear LTF confirmation .
Today’s focus: Let the structure guide you. Trade with patience and manage risk carefully.
📘 Shared by @ChartIsMirror

Gold (XAUUSD) – 24 Sep | Watching 3747–3743 POI for Long Setup🟡 Gold (XAUUSD) Analysis – 24 September
Hello Disciplined Traders,
Welcome to the Chart Is Mirror Community 👋
Market Context
• Our POI zone 3742–3738 HL respected beautifully yesterday, and our long setup hit full TP.
• Gold printed a new all-time high at 3791 in yesterday’s session.
• Price is now in an M15 pullback phase , likely retesting key buy zones before resuming its uptrend.
Key Observations
• Potential POI for Long Setup: 3747–3743 OB near HL area.
• If price respects this POI and gives LTF confirmation , we will look for a short-term buy trade.
• If price breaks this zone cleanly, we will reassess from lower levels.
Execution Plan
• Wait for price to retrace to 3747–3743 POI .
• Look for LTF confirmation before executing any trades.
• No setup, no trade — patience is key.
Invalidation
• A clean break and close below 3736.6 HL would signal a structure shift and may pause the bullish bias.
Stay disciplined — let price come to your zone before committing capital.
📘 Shared by @ChartIsMirror

Gold (XAUUSD) – 23 Sep | Watching 3742–3738 HL for Long Setup🟡 Gold (XAUUSD) Analysis – 23 September
Hello Disciplined Traders,
Welcome to the Chart Is Mirror Community 👋
As per yesterday’s analysis, our 3687–3685 POI zone respected beautifully, offering a clean long setup that played out perfectly.
Market Context
• New BoS: Asian session broke the New York session high, printing a fresh bullish break of structure.
• Current HL: Price is now trading around 3742–3738 HL , which is our first POI for a potential long setup.
Key Observations
• POI #1: 3742–3738 (HL zone) – watch for price to respect this area for a continuation move.
• POI #2: 3721–3712 – next buy zone, but note: if price reaches here, it would mean a short-term M15 structure shift to the downside, so treat this as a pullback area and manage risk tightly.
Execution Plan
Wait for price to respect 3742–3738 with LTF confirmation .
If confirmation aligns, plan a long setup with fixed risk ( SL: 40 pips | TP: 120 pips , 1:3 R:R).
If HL is broken and price moves toward 3721–3712 , reduce risk and watch closely before taking any setup.
Patience is still your edge – stay calm and let the market come to you.
📘 Shared by @ChartIsMirror

Gold (XAUUSD) – 22 Sep | Key Demand Zones in FocusGold (XAUUSD) Analysis – 22 September
As per our Friday analysis , market shifted the structure upside on M15 , which indicates that the H4 pullback phase may be over and the market could be resuming its major bullish trend.
Today’s Asian session supported this bullish intent and, with a compact pullback, created a BoS , giving us a clear directional bias towards the upside.
Currently, price is trading near the M15 recent HL key level (3687–3685) .
There is a high probability that market may respect this level and continue its upside momentum.
Key Zones to Watch:
• 3687–3685 HL zone → First zone to watch for a potential long setup.
• 3673–3666 breaker zone → Could act as a strong support if price retraces deeper.
• 3651–3643.8 demand zone → The zone from where market took support on Friday and broke the LH key level.
Plan:
Wait for price reaction and LTF confirmation at these zones before executing any long trades.
Mindset:
Stay patient and let the market show its hand before committing.
📘 Shared by @ChartIsMirror

Gold (XAUUSD) – 19 Sep | Crucial Zone, Watching for Next Move🟡 Gold (XAUUSD) Analysis – 19 September
Market Context
• Gold is currently trading near the H4 Higher Low (HL) zone , suggesting the H4 pullback phase may be nearing completion.
• Yesterday, price action respected our key levels beautifully — both the M15 demand zone (3644–3637) and the M15 LH + Day High zone (3668–3672) offered excellent setups.
• Market has now printed a Break of Structure (BoS) below 3637, confirming M15 is currently in a downtrend.
Key Observations
• Price is in a pullback phase within the M15 downtrend.
• H4 Context: Price is near HL support, which is also the 78.6% Fibonacci retracement level — a critical area to watch for a potential uptrend resumption.
Execution Plan
• Short Setup Zones:
• 3654.8–3659.3 (fractal pullback zone).
• 3667–3673 (M15 LH + supply zone).
– A breakout and strong close above this zone would signal potential upside trend resumption → no more shorts.
• Long Setup Zone:
• 3621–3613 (H4 HL zone) — wait for price to reach and respect this level with M1/LTF confirmation before planning longs.
Trading Bias
• Neutral-to-Bearish for now — shorts are valid only if POI zones are respected.
• Longs will be considered only from deeper H4 HL zone with confirmation.
Today’s approach: Observe with stillness — let price reveal its direction before committing.
📘 Shared by @ChartIsMirror

Gold (XAUUSD) – 18 Sep | Watching 3644–3637 Demand Zone for Long🟡 Gold (XAUUSD) Analysis – 18 September
Market Context
• Yesterday’s FOMC event caused extreme volatility, with price spiking to a new all-time high at 3707.5 , followed by sharp selling.
• M15 structure remains bearish, but our key demand zone from yesterday’s analysis is still valid.
• Market may look to grab sell-side liquidity below this zone before any potential move up, so caution is key.
Key Zone to Watch
• Demand Zone : 3644 – 3637 (strong area of interest for potential buy setups).
• Monitor price reaction here before committing capital.
Execution Plan
• Wait for price to respect 3644 – 3637 demand zone
• Look for LTF confirmation before planning a long setup
• If zone is invalidated, step aside and wait for deeper levels
Let price come to your zone — patience turns setups into opportunities.
📘 Shared by @ChartIsMirror

Gold (XAUUSD) – 17 Sep | Watching 3690.6–3695.5 for Short Setup🟡 Gold (XAUUSD) Analysis – 17 September
Market Context
• Price finally touched the psychological 3700 level in yesterday’s session.
• Sharp selling followed, causing an M15 ChoCh and a clear Break of Structure (BoS) , signaling bearish intent.
• Over the next two days, major events could drive volatility:
📅 17 Sep
• Federal Funds Rate
• FOMC Economic Projections
• FOMC Statement
📅 18 Sep
• FOMC Press Conference
• Unemployment Claims
Today’s Setup
• POI for Shorts: 3690.6–3695.5 — ideal zone for reaction and short setups.
• Wait for price to retest 3690.6–3695.5
• Look for LTF confirmation before entering
• Execute with fixed risk ( SL: 40 pips | TP: 120 pips , 1:3 R:R)
Support Zones to Watch
• 3660–3656 OB
• 3644–3637 strong demand
Risk Note
Do not rush into trades — these back-to-back events can trigger sharp moves and fake-outs. Manage your risk, or stay flat if price action is too volatile.
Sometimes the best trade is patience — wait for price to respect your zone.
Bias for Today
📉 Bearish bias. Watching for short opportunities from POI only if confirmed.
📘 Shared by @ChartIsMirror

Gold (XAUUSD) – 16 Sep | Watching 3674.6–3676.5 Zone for Long🟡 Gold (XAUUSD) Analysis – 16 September
Market Context
• Yesterday, NYC session pushed gold aggressively higher, printing a fresh all-time high around 3685.6 .
• This shifted H4 and M15 structure back to bullish.
• During today’s Asian session , price took support from the breaker zone of the previous all-time high (3674.6) and made a new high at 3689.6 .
Key Observations
• Primary POI: 3674.6 – 3676.5 (breaker demand zone).
• Secondary POIs: 3660 – 3656 (order block) and 3644 – 3637 (strong demand zone).
• Structure remains bullish as long as price holds above these demand zones.
Execution Plan
• Wait for price to respect 3674.6 – 3676.5 breaker zone.
• Look for M1 / LTF confirmation before executing a long setup.
• If zone fails, wait for price to reach lower POIs (3660–3656 or 3644–3637) before re-engaging.
• Risk management: Fixed SL: 40 pips | TP: 120 pips (1:3 R:R).
Invalidation
A clean break and close below 3674.6 will make us wait for price to reach deeper demand zones before planning new setups
Patience over impulse — let price confirm the demand zone before entering.
Bias for Today
📈 Bullish bias. Looking for long setups from key demand zones with confirmation.
📘 Shared by @ChartIsMirror

Gold (XAUUSD) – 15 Sep | Watching 3638–42 & 3647–51 for Shorts🟡 Gold (XAUUSD) Analysis – 15 September
Market Context
• As per our 12 Sep Analysis , market retested 3651 – 3657 (LH + supply zone) and resumed its downtrend.
• Price is now expected to continue lower and create a new lower low below the previous one at 3612 .
• In today’s Asian session, internal structure also broke to the downside, confirming alignment with the broader bearish trend.
Key Observations
• First Zone to Watch: 3638 – 3642 (recent order block). If price retraces here and shows LTF confirmation , we will look to short.
• Next POI: 3647 – 3651 (M15 POI + LH zone). If the first zone fails, this is our next preferred level for a potential short setup.
• Market structure continues to form lower highs and lower lows, reinforcing our bearish bias.
Execution Plan
Wait for price to pull back into 3638 – 3642 OB or 3647 – 3651 POI.
Watch M1 for confirmation (micro-ChoCh / micro-BoS).
On confirmation, execute a short setup with fixed risk ( SL: 40 pips | TP: 120 pips , 1:3 R:R).
If both zones fail, step aside and reassess before taking any trade.
Patience is also a position — let price come to you before taking action.
Bias for Today
📉 Bearish only. Looking for shorts from OB or POI with confirmation.
📘 Shared by @ChartIsMirror

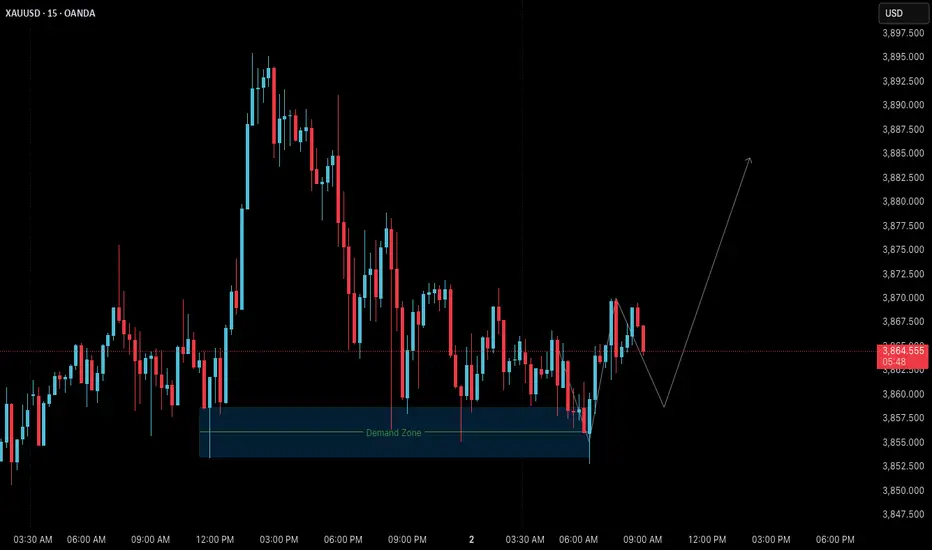
Sniper Entries Made Simple: The Power of Confirmation“Smart traders don’t predict.
They wait for the market to confirm their idea — then act.”
Finding a mitigation zone is only half the job.
Confirmation is what separates professional patience from random guessing.
It’s the step that keeps you from catching a falling knife or buying too soon.
Why Confirmation Matters
Jumping in blindly at the zone can work sometimes — but most of the time, it’s a gamble.
Confirmation gives you:
Higher probability setups (not every zone holds)
Tighter entries (better RR)
Fewer unnecessary stop-outs
The Confirmation Playbook
Here’s a simple process you can use.
Refer to the Gold M15 Bullish Chart (Sep 2, 2025) above — it shows this process step by step.
Step 1: Mark the Zone
Identify your mitigation block or demand zone after a BoS.
Step 2: Wait for Price to Tap
Be patient — let price react at this zone.
Step 3: Look for a Sweep
Notice how price often sweeps liquidity below the zone first — this fuels the reversal.
Step 4: Drop to Lower Timeframe (M1 or M5)
Watch for micro-structure shift in your favor:
micro-ChoCH
micro-BoS
Strong rejection wicks or engulfing candles
Step 5: Enter with Tight Risk
Take the trade after confirmation and set SL just beyond the sweep.
This gives you a small stop with a high RR potential.
Live Example (Gold)
In the XAUUSD bullish M15 chart above, you can see:
BoS creates a demand zone
Price returns and sweeps liquidity below demand zone
On lower timeframe, we get micro-ChoCH → micro-BoS confirmation
Entry is taken at micro-POI with tight SL, catching the next impulsive leg
Notice how confirmation turned a risky breakout buy into a sniper entry with a clean risk-reward profile.
📘 Shared by @ChartIsMirror
Do you already use confirmation techniques like ChoCH + BoS, or do you prefer instant entries at zones?
Share your experience in the comments — what’s your go-to trigger?
Gold (XAUUSD) – 12 Sep | Short Setup Watching 3651 – 3657.6 POI🟡 Gold (XAUUSD) Analysis – 12 September
Market Context
• Price is currently trading around 3649, approaching our fresh M15 POI (3651 – 3657.6) .
• We have seen a recent Break of Structure (BoS) to the downside, confirming a short-term shift to bearish sentiment.
• Price has now retraced back into the POI zone, aligning with a potential short setup area.
Key Observations
• POI Zone: 3651 – 3657.6 (aligned with LH + supply zone)
• Liquidity Sweep Potential: Price might push slightly above the POI to grab liquidity before resuming the downtrend.
• Structure: Market is forming lower highs and lower lows after the BoS, reinforcing a bearish bias unless price closes decisively above the POI.
Execution Plan
• Wait for price to retest 3651 – 3657.6
• Look for M1 confirmation (micro-ChoCh / micro-BoS)
• If confirmation aligns → plan short setup with fixed risk ( SL: 40 pips | TP: 120 pips , 1:3 R:R)
• If the POI is broken → step aside and reassess deeper levels
Invalidation
A clean break and 15M candle close above 3657.6 invalidates the short idea.
Patience pays — let the market reject the POI before committing capital.
Bias for Today
📉 Bearish only. Short setups will be taken only from the POI zone with confirmation.
📘 Shared by @ChartIsMirror
