Is the downtrend for GRT done?Here is what I see with GRT at the moment:
The bullish:
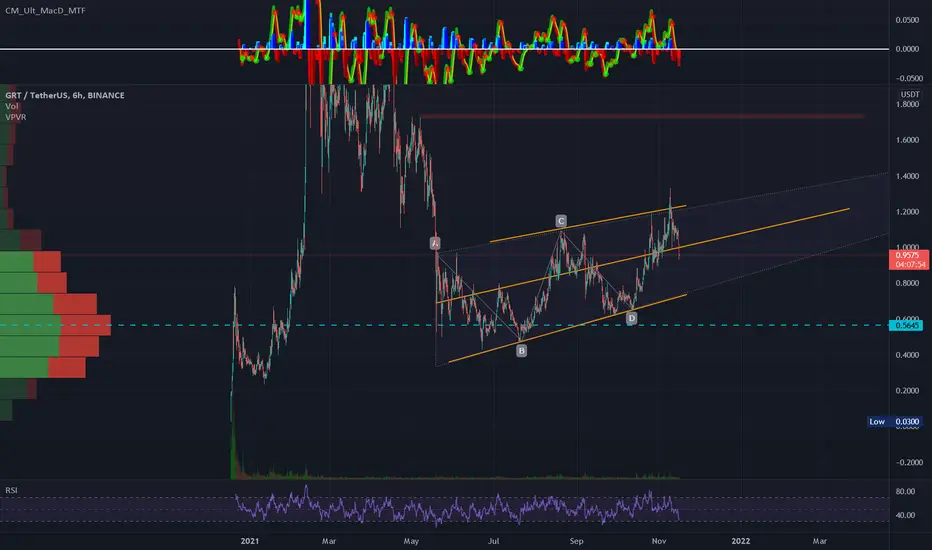
1) The green box I have drawn is GRT'S last key zone of support. I am getting this from the touch that GRT made shortly after launch and proceeded to rally over 1000%. Ever since then we have yet to re-test this box.
2) We have daily bullish RSI and MACD divergence. Always a good sign.
3) We have been in a downtrend for a very long time and have pretty much re-entered the price zone that the coin launched at.
4) It appears we are starting to break above the ema ribbon. The spread is also relatively small. A good sign.
The bearish:
1) We have a 60% ichimoku cloud above us. I have to suspect this will offer some sort of resistance, especially since we have yet to test it during this year long downtrend.
2) The red box marks a key area of resistance for GRT. This area lines up relatively well with the ichimoku cloud, supporting the idea that we will likely see resistance in this range.
3) I suspect the 200 daily ema will enter this range around the time GRT hits it, that is, if it does. This strengthens the previous two points even moreso.
4) Volume is pathetic
My take:
This is a bit of a risky play right now as GRT is heading into some substantial resistance. I still suspect some upwards movement in the short term, but only into those resistance levels, however I suspect something like scenario 1 will play out, especially if the overall market sentiment turns around in the next couple of months which I believe is to be expected.
If we lose the green box we will likely set new all time lows for GRT. Since it has lost so much of its value already, i'm inclined to believe that this wont happen.
If I were to go long I would wait for a retest of the green box, potentially after the resistance levels reject GRT.
Remember, this is not financial advice and always do your own analysis/research before making any decisions on the market.
Thegraph

The Graph GRT Price Targets and Stop LossEntry Range: $0.32 - 0.40
Price Target 1: $0.53
Price Target 2: $0.75
Price Target 3: $0.86
Stop Loss: $0.29

Descending Inverse Head and Shoulders on The Graph!Hey traders,
As you can see on the 1HR of The Graph (GRT). The price has formed an inverse head and shoulders with a descending neckline/ resistance. To find the inverse head and shoulders price breakout target, you measure the impulse move of the head and add it to the top of the neckline. This is cool and all but as a bonus, we additionally have a Bullish Divergence on the Momentum Oscillator (RSI)! This makes me really confident we will see a small recovery of +5% in the immediate short term. Set your TP for .437.
Safe trading,
-Pulkanator

it could be very precise TA about the GRAPHcrab harmonic pattern:
X=$6.3
AB=0.61 XA
BC=0.38 AB
1.6 BC=$1.74
0.78 XA=$1.98
2 BC=$2.8
0.88 XA=$3.4
2.24 BC=$3.8
2.6 BC=$6
1.13 XA=12.6
3.6 BC=$21
1.27 XA=$27.23
4.23 BC=$46
1.41 XA=$57
1.6 XA=$175

GRT/USDT - Range Trade - 100% profit from entry.In my opinion The Graph (GRT) still is undervalued with around 2,800,000,000$ market taking 51th place cmc. 100% is very likely to hit this quarter.
Tight stoploss is part of my strategy. Sometimes I might catch stoplosses 2, 4, 6 times before reaching TP.

The Graph broke trianglePrice broke the symmetrical triangle pattern and is making a pullback. We can watch for short positions.

Graph Protocol 1st Quarter Projection$GRT classic double top pattern
Break below neckline followed by reversal and repeat of pattern
12 HR chart with MA Cross indicating reversal for next leg up, repeating pattern
Expected peak in late Jan/Early Feb followed by retracement then pattern repeats

TheGraph Again- i will add a link in comments to my older GRT analyse where we got a rejection around 1$.
- To make it quick. GRT is reaching a buy Zone, but like always you have to check TheKing Movements.
------------------------------------------------------------------
Trading Parts :
------------------------------------------------------------------
Buy Zone 1 : 0.65 ( Now ) (not all in)
Buy Zone 2 : 0.55 (All in)
TP1 : 1.2$
TP2 : 2.2$ (only if we have a strong breakout)
------------------------------------------------------------------
Stop : 0.45$
------------------------------------------------------------------
- Personally i don't set Any Stop Loss in Cryptos, i rebuy more coins/tokens at lower price, cryptos are terribly fast, sometimes just with a fast "Dip Wick ", you could lose money that you could win back in few Hours / Days, everything is depending on your own strategy.
- Stay Safe and invest wisely.
Happy Tr4Ding !

Long Hold on GRTLike a lot of altcoins, $GRT seems to be looking for a longer term bounce here, if RSI breaks white trendline upside should be confirmed and test those various fib levels. I think in the coming months GRT will definitely retest ATH. Short term, it all depends on how BTC behaves for now. We might experience a dip below triangle trendline (bear trap?) prior to price increase.

GRT floating on bottomIt's easy to pick a bottomed coin/token nowaday, basically most of them are but what isn't easy it's to pick the right project. I think GRT is one of the good one to hold for long as long as several L1s because it basically does something the cryptoverse needs.
Now, since BTC hasn't done a proper reversal yet I wouldn't reccomend you to go 100% in but at current level I think a 25-30% buy it's safe. After that you might keep an eye on this as it's clear that if weekly candle closes like this it'll make a lower low which is never a good thing. Notice that if history repeats itself we'll have a +100% in the next month and a half.
Good luck

GRT The Graph: Downside SupportHello friends, today I am completing a technical analysis on the 1D linear scale chart for The Graph ( GRTUSD ), an altcoin cryptocurrency. Please review the chart and analysis below carefully as there are many trendlines.
#CryptoPickk notes the following:
1) The Graph price had an all time high in February 2021 and since that point, the price has only came down.
2) Recently due to the #cryptocrash, the price dropped significantly breaking a multi-month bottom trendline (in yellow color).
3) A Trend-Based Fibonacci Retracement is shown with two areas to note - 0.236 and 0.382 level ($0.34-$0.45 area)
4) Both of these area are also support areas shown in the green color lines.
5) The Volume Profile (VPVR) is also heavy around these two areas.
6) The RSI (relative strength index) is about to touch the oversold region and the Stochastic RSI (Stoch RSI) is in the oversold region).
7) There may be a point of consolidation or short-term price increase before prices may come down further. Stay a bit cautious as the economy and market are fragile right now.
What are your opinions on this?
If you enjoy my ideas, feel free to like it and drop in a comment. I love reading your comments below.
Disclosure: This is just my opinion and not any type of financial advice. I enjoy charting and discussing technical analysis. Don't trade based on my advice. Do your own research! #cryptopickk

technical must be the mirror of fundamental!crab harmonic pattern:
X=$51
AB=0.61 XA
BC=0.38 AB
1.6 BC=$9.98
0.78 XA=$10.31
2 BC=$21
0.88 XA=$21.78
2.24 BC=$33.5
2.6 BC=$70
1.13 XA=$134
1.27 XA=$389
3.61 BC=$491
1.41 XA=$1091
4.23 BC=$1636
1.6 XA=$5163

GRT The Graph Bottom Trendline Re-testHello friends, today I am reviewing the 1D linear scale chart for The Graph (GRT), a cryptocurrency alt coin.
In the chart I noted:
1) GRT price has been in a long-term triangle pattern since Jan-Feb 2021. The price is approaching the apex.
2) The price recently tested the top trendline of the triangle and got rejected and may possibly re-test the bottom of the triangle again, resulting in a 20% price drop to around $0.70-$0.72.
3) The Ichimoku Cloud is showing green and the price has stayed above the cloud since the end of October 2021. If the price drops, it may only be a very quick wick down for the re-test.
4) The RSI (relative strength index) tested the bottom support trendline and could be re-testing it again forming a double bottom to help push the prices higher.
5) The Volume has not gained much momentum since March 2021 but has not significantly decreased either.
6) The VPVR (Volume Profile) shows support and resistance at the current price levels as well as the potential price drop area. If GRT can manage to break upwards out of the triangle, there is limited resistance above.
What are your opinions on this?
If you enjoy my ideas, feel free to like it and drop in a comment. I love reading your comments below.
Disclosure: This is just my opinion and not any type of financial advice. I enjoy charting and discussing technical analysis. Don't trade based on my advice. Do your own research! #cryptopickk

GRAPH has potential fundamentally and technically Fibo levels:
1.6 BC=$1.75
2 BC=$2.82
2.24 BC=$3.8
2.6 BC=$6.1
3.6 BC=$21

GRTUSDT -> Looks like it's going to fall a littleEverything is on the chart. Of course, as always, it is not investment advice. Shared for practice and note-taking. But in my opinion, I can't see any tiny signal that could increase the price of GRT...

resistances in the way of $9.42AB=0.61 X-A
BC=1.6 AB=$9.42
fibo levels:
1.6 bc=$1.55
2 bc=0.78 3-4=$1.92
2.24 bc=$2.21
0.88 AB=$2.33
2.6 bc=$2.75
1.13 AB=$3.71
3.6 bc=$4.85
1.41 AB=$6.31
1.6 AB=$9.42

GRT The Graph is looking nice in a simple uptrend tunnel!! GRT The Graph is another crypto on my watchlist that I believe will do even better as time goes on. Currently it has been on an uptrend since the end of June. The price action has formed a nice uptrend tunnel/large broadening wedge that looks like it should continue. Next major area of resistance is around the 1.7 range. I will be monitoring GRT and I hope it finds success in the future.

#GRT The Graph 1D - Big Move Coming!I did a deep dive on GRT to figure out if we are in a possible next leg up. GRT was in a symmetrical triangle on this chart but inside that triangle it was in a falling wedge pattern until it broke out recently. GRT is above the ichimoku clouds and over the 21 ema on the daily now. I noted a few resistance areas along with showing a fractal from the prior pump.
RSI and Stoch RSI show the possible move up is ready.
Market Cypher shows a green dot.
There is a nice double bottom formation on the trend line that was formed since May 2021.
My biggest concern at the moment is if BTC hits the ATH and creates a double top pattern and starts to move down. This would not be good for GRT or any other crypto.
What are your thoughts? Comment below, hit the like and follow me. Thank you!
Disclosure: This is just my opinion and not any type of financial advice. I enjoy charting and discussing technical analysis . Don't trade based on my advice. Do your own research! #cryptopickk #bitcoin #altcoins

start your bullish journey!$3.7 is the target of the flag pattern. the Graph has more potential than $3.7.

Graph: When Web3 hype come to this blue chip?GRTUSDT is drawing a giant symmetrical triangle on log scale, as well as a cup and handle pattern. It is stablized above 3D 21EMA. When it breaks out we are expecting a new ATH then 15-20usd by the end of this cycle.
Fundamentally, the Graph is an infrastructure really needed by blockchain world and Web3 era. It's like chainlink to the DeFis.
After play2earn and metaverse, Web3 hype will surely come. Don't miss the train.

#GRT The Graph 1D Chart Breakout ready?The Graph (GRT) is one of the top 100 cryptos but it has been on a downward trend within a triangle pattern for many months. It seems we are near the apex of the triangle.
Taking the flagstaff from the last pump and moving it to the breakout area, it seems that the 1.618 fib may be reachable.
Also considering the fractal pattern from when GRT launched, we may be able to see massive gains.
Coinmarketcap on GRT: coinmarketcap.com
What are your thoughts? Comment below and hit the like please. Thank you!
Disclosure: This is just my opinion and not any type of financial advice. I enjoy charting and discussing technical analysis . Don't trade based on my advice. Do your own research! #cryptopickk #bitcoin #altcoins

