Options Blueprint Series [Intermediate]: Lunar Timing and ThetaIntroduction
This edition of the Options Blueprint Series focuses on gold futures and micro gold futures, using an iron condor options structure to explore how time decay (theta) can be positioned in an environment where signals conflict rather than agree.
Gold has been trading at elevated levels, attracting strong participation from momentum-driven traders while simultaneously showing signs of short-term exhaustion. This creates a valuable learning environment for options traders, particularly those interested in non-directional strategies that rely more on time and range behavior than outright price direction.
This article is presented as a case study. All tools, indicators, and trade structures discussed are used for educational purposes only. Lunar timing, in particular, is included as a belief-based analytical lens used by some market participants, not as a predictive mechanism.
Market Context: Gold at Elevated Levels
Gold futures have experienced a powerful rally since the reopening of U.S. Sunday evening trading hours, extending an already strong longer-term uptrend. Price is now operating at new all-time highs, a condition that often amplifies emotional behavior among trend followers.
In such environments, markets frequently display two competing forces:
Continued upside pressure driven by momentum and fear of missing out
Short-term vulnerability driven by overextension, crowding, and mean-reversion dynamics
Rather than attempting to resolve which force will dominate, this Options Blueprint explores how options structures can be used to frame uncertainty itself.
Analytical Inputs Used in This Case Study
This framework combines multiple analytical perspectives. None are presented as definitive signals; instead, they are used to illustrate how diverse inputs can shape options structure selection.
Lunar Timing (Moon Phases Indicator)
The chart highlights waxing and waning moon phases:
Waxing moons are displayed in blue
Waning moons are displayed in gray
The current market condition coincides with a waxing moon phase, which some traders interpret as a potentially bearish timing window. It is important to stress that lunar analysis is belief-based, not empirically causal. Its inclusion here is intentional for educational diversity and contextual layering, not validation.
Bollinger Bands® on Multiple Timeframes
Two Bollinger Bands® sets are applied:
One based on the daily timeframe
One based on the weekly timeframe
Price is approaching, and in some instances penetrating, the upper bands on both timeframes simultaneously. This alignment often signals volatility expansion and late-stage trend behavior, increasing the probability of range stabilization or consolidation, even if the broader trend remains intact.
RSI and Divergence
The Relative Strength Index is set to standard parameters: Length = 14
A bearish divergence is visible, where momentum fails to confirm new price highs. Notably, the
RSI length coincides numerically with half of a lunar cycle. This coincidence is observational only and does not imply a functional relationship.
Structural Support Below Price: UFO Context
Below current price, the chart highlights UFOs (UnFilled Orders) clustered near 4,527. These represent areas where prior price discovery was incomplete, often acting as zones of liquidity and structural interest.
This region introduces an important counterbalance:
While short-term indicators lean bearish
Structural market mechanics suggest potential downside cushioning
This combination reinforces the idea of a bounded market environment, rather than a clean directional thesis.
Why an Iron Condor Fits This Environment
When markets present conflicting directional evidence, strategies that benefit from price containment and time decay become particularly relevant.
An iron condor:
Does not require a bullish or bearish forecast
Defines risk in advance
Benefits from theta as time passes
Allows strike placement around known volatility and structure zones
In this context, the iron condor serves as a framework for uncertainty, not a directional expression.
Iron Condor Structure (Illustrative Example)
This case study uses a January 27 expiration within the GCG contract cycle.
Call Side
Short 4,850 call
Long 4,900 call
Put Side
Short 4,500 put
Long 4,450 put
The strikes are positioned at approximately equal distance from current price, with the downside aligned near known UFO structural support.
Key Characteristics
Net theoretical credit: approximately 10.3 points
Theoretical maximum risk: approximately 39.7 points
Lower break-even: near 4,490
Upper break-even: near 4,860
As long as price remains within this range through expiration, the structure benefits from time decay. If price exits the range, losses are predefined and limited.
Theta: Time as the Primary Variable
In short-option structures, theta becomes the dominant driver of performance when price remains stable.
Key educational takeaways:
Theta accelerates as expiration approaches
Time decay is not linear
Volatility changes can amplify or offset theta
Direction matters less than location and pace
This structure highlights how patience and risk definition often matter more than directional conviction.
Managing an Iron Condor
There are many ways traders manage iron condors as conditions evolve. Without going into procedural detail, common approaches include:
Rolling positions forward in time
Adjusting strikes to rebalance risk
Reducing exposure on one side of the structure
Management decisions depend on price behavior, remaining time, volatility, and individual risk tolerance.
Contract Specifications: GC vs MGC
Gold Futures (GC)
Contract size: 100 troy ounces
Tick size: 0.1
Tick value: $10
Outright margin: $22,900
Micro Gold Futures (MGC)
Contract size: 10 troy ounces
Tick size: 0.1
Tick value: $1
Outright margin: $2,290
Both contracts follow the same structural logic, allowing traders to scale exposure while maintaining identical analytical frameworks.
Margin requirements for futures and futures options are dynamic rather than fixed, meaning they may vary over time in response to changes in market volatility, price levels, and risk conditions as determined by exchanges and clearing firms.
Depending on the broker and clearing arrangements, the specific margin requirement for an iron condor is frequently set near the position’s maximum theoretical risk; in this illustrative case study, that risk is approximately 39.7 points ($397), though margin treatment can vary.
Risk Management Considerations
Even defined-risk strategies carry meaningful risk. Key principles include:
Position sizing relative to account equity
Awareness of gap and volatility risk
Understanding assignment and expiration mechanics
Options limit risk by design, but do not eliminate uncertainty.
Final Thoughts
This Options Blueprint demonstrates how lunar timing, volatility structure, RSI behavior, and UFO context can coexist within a single framework, without requiring directional certainty.
The iron condor is not presented as a solution, but as a lens through which uncertainty can be structured, with time decay acting as the central variable.
Markets rarely offer clarity. Options allow traders to respond to that reality with structure, discipline, and predefined risk.
Data Consideration
When charting futures, the data provided could be delayed. Traders working with the ticker symbols discussed in this idea may prefer to use CME Group real-time data plan on TradingView: www.tradingview.com - This consideration is particularly important for shorter-term traders, whereas it may be less critical for those focused on longer-term trading strategies.
General Disclaimer
The trade ideas presented herein are solely for illustrative purposes forming a part of a case study intended to demonstrate key principles in risk management within the context of the specific market scenarios discussed. These ideas are not to be interpreted as investment recommendations or financial advice. They do not endorse or promote any specific trading strategies, financial products, or services. The information provided is based on data believed to be reliable; however, its accuracy or completeness cannot be guaranteed. Trading in financial markets involves risks, including the potential loss of principal. Each individual should conduct their own research and consult with professional financial advisors before making any investment decisions. The author or publisher of this content bears no responsibility for any actions taken based on the information provided or for any resultant financial or other losses.
Theta

Options Blueprint Series [Advanced]: Structuring Long VolatilityWhy Long Volatility Matters in Euro FX Right Now
Euro FX futures offer a clean and highly liquid way to observe how macro forces, relative growth expectations, and monetary policy differentials express themselves through price. While directional narratives often dominate discussion, options markets frequently reveal a different story — one centered on volatility pricing rather than directional certainty.
This Options Blueprint focuses on Euro FX futures (6E) and Micro EUR/USD futures (M6E) during a period when implied volatility is historically compressed, while price structure suggests an elevated probability of expansion. The purpose of this case study is not to anticipate direction, but to explore how options structures can be engineered to respond to range resolution risk when price compression and technical conflict coexist.
This article is strictly educational and illustrative, designed to demonstrate principles of volatility analysis, options structure design, and risk management.
Volatility Context: Reading Implied Volatility with CVOL
Implied volatility reflects the market’s collective expectation of future price variability. When implied volatility is elevated, options tend to price in larger potential moves. When it is compressed, options reflect an assumption of relative calm.
In this case, the CVOL index for Euro FX futures is observed at relatively low levels compared to its behavior earlier in the year. While CVOL is not predictive, it provides valuable context: the market is currently assigning a lower probability to large price swings than it has at other times.
Periods of compressed implied volatility are noteworthy because price expansion often follows periods of contraction, particularly when price structure begins to show signs of instability. This does not guarantee movement, but it shifts the analytical focus toward strategies that can benefit from expansion rather than stagnation.
Technical Landscape: A Market at an Inflection Point
From a structural perspective, Euro FX futures present a rare but important configuration: conflicting continuation and reversal patterns.
A bullish flag has developed following an impulsive advance, suggesting the potential for trend continuation.
Simultaneously, a double top formation has emerged, introducing the possibility of a downside resolution.
When viewed in isolation, each pattern offers a directional narrative. When viewed together, they create directional ambiguity but expansion risk clarity. In other words, the market may not be signaling where it intends to go — but it is signaling that remaining stagnant may be increasingly difficult.
This type of structural conflict is often where volatility-focused strategies become more relevant than directional trades.
Mapping Price Targets to Market Structure
Technical patterns are most useful when they provide reference points, not predictions. In this case, both patterns generate projected levels that act as structural guideposts.
The bullish flag projects an upside objective near 1.2116, which also aligns with a clearly defined UFO resistance zone.
The double top projects a downside objective near 1.1618, aligning with a well-defined UFO support zone.
These levels form a structural range boundary. Price acceptance beyond either boundary would represent meaningful resolution of the current compression phase. For options traders, these projected zones are valuable because they provide logical strike selection reference points when designing volatility structures.
Strategy Foundation: The Role of a Long Straddle
A traditional long straddle involves purchasing both a call and a put at the same strike, typically near the current price. This structure is directionally neutral and benefits from large price movements in either direction.
The strength of a long straddle lies in its convexity. Its primary weakness lies in time decay, particularly when implied volatility is low and price remains range-bound.
In compressed volatility environments, a pure long straddle can be inefficient if price takes time to resolve. This is where structure refinement becomes essential.
Strategy Evolution: Structuring an Asymmetric Long Volatility Approach
Instead of relying on a textbook long straddle, this Options Blueprint explores an asymmetric volatility structure designed to reflect the underlying technical landscape.
The structure begins with a long at-the-money straddle, capturing core volatility exposure:
Long 1.175 Call
Long 1.175 Put
To refine the payoff and reduce exposure to time decay, options are sold at technically
meaningful projected targets:
Short 1.21 Call
Short 1.16 Put
This transforms the strategy into a defined-risk, asymmetric volatility structure.
Key educational concepts illustrated by this construction:
The long options capture expansion risk near the current price.
The short options align with projected structural boundaries.
The payoff becomes skewed, favoring upside expansion while still allowing for limited downside participation.
Theta exposure is reduced compared to a pure long straddle.
The goal is not optimization, but intentional payoff shaping based on structure.
Risk Profile Analysis: Understanding the Payoff Diagram
The resulting risk profile highlights several important principles.
Maximum risk occurs if price remains trapped between the short strikes into expiration.
Upside expansion toward the upper projected level produces the most favorable outcome.
Downside expansion produces a smaller, but still positive, outcome.
Both risk and reward are defined, removing uncertainty around extreme scenarios.
This structure favors movement over stagnation, reflecting the belief that expansion risk outweighs the likelihood of prolonged consolidation — without requiring directional conviction.
Contract Specifications
Euro FX futures are available in both standard and micro formats.
o 6E (Euro FX Futures)
Larger notional exposure
Suitable for accounts with higher margin tolerance
o M6E (Micro EUR/USD Futures)
One-tenth the size of the standard contract
Greater flexibility for position sizing
Often useful for testing or scaling strategies
Both contracts reference the same underlying market structure, allowing the same analytical framework to be applied across different risk profiles.
Margin requirements vary and are subject to change, making position sizing and risk definition essential considerations when selecting between standard and micro contracts.
Euro FX futures (6E) have a tick size of 0.000050 per Euro increment = $6.25 tick value and currently require roughly ~$2,700 in margin per contract, while Micro EUR/USD Futures (M6E) use a 0.0001 tick size per euro = $1.25 tick value and margin closer to ~$270.
Risk Management Considerations
Options strategies are not defined solely by payoff diagrams — they are defined by how risk is managed over time.
Key considerations include:
Sizing positions so that the maximum loss is acceptable within the broader portfolio context.
Understanding how time decay accelerates as expiration approaches.
Recognizing that volatility expansion does not occur on a fixed schedule.
Accepting predefined loss zones as part of the structure rather than reacting emotionally.
Risk management is not about avoiding losses; it is about controlling exposure to uncertainty.
Key Takeaways from This Options Blueprint
Implied volatility provides context, not direction.
Conflicting chart patterns often increase expansion risk.
Options structures can be shaped to reflect technical asymmetry.
Modifying classic strategies can improve alignment with market conditions.
Defined risk and intentional design matter more than prediction.
This case study demonstrates how volatility, structure, and risk management intersect — without requiring directional forecasts.
Data Consideration
When charting futures, the data provided could be delayed. Traders working with the ticker symbols discussed in this idea may prefer to use CME Group real-time data plan on TradingView: www.tradingview.com - This consideration is particularly important for shorter-term traders, whereas it may be less critical for those focused on longer-term trading strategies.
General Disclaimer
The trade ideas presented herein are solely for illustrative purposes forming a part of a case study intended to demonstrate key principles in risk management within the context of the specific market scenarios discussed. These ideas are not to be interpreted as investment recommendations or financial advice. They do not endorse or promote any specific trading strategies, financial products, or services. The information provided is based on data believed to be reliable; however, its accuracy or completeness cannot be guaranteed. Trading in financial markets involves risks, including the potential loss of principal. Each individual should conduct their own research and consult with professional financial advisors before making any investment decisions. The author or publisher of this content bears no responsibility for any actions taken based on the information provided or for any resultant financial or other losses.

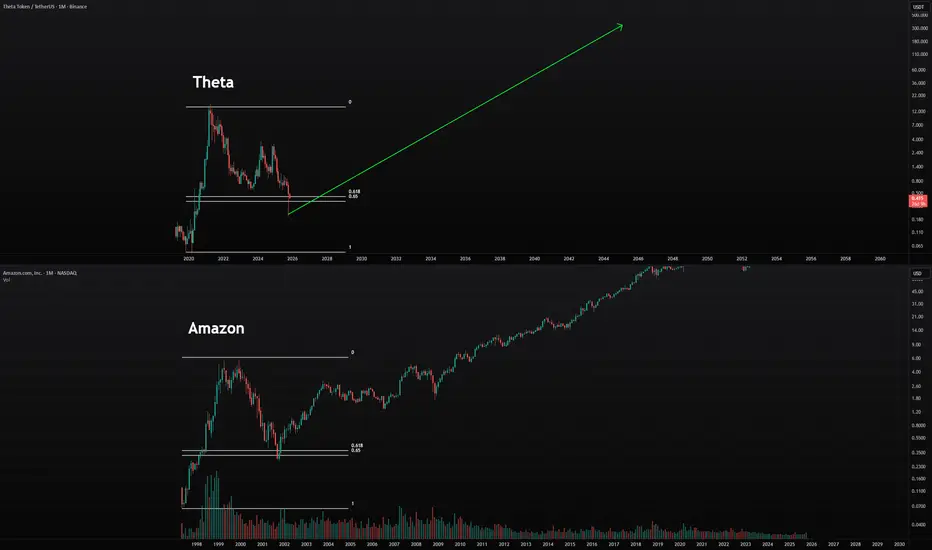
Theta long-term analysis.Today, I take a look at a long-term analysis of Theta, comparing it to Amazon. I believe Theta will perform very well in the big picture. I see it following a major upward trend similar to Amazon’s. However, it could happen much faster than shown on this chart—be ready for big things in this market.
As always, stay profitable.
– Dalin Anderson
Get Ready for a Strong Recovery on Theta in the Near Future! I believe Theta will see a strong recovery very soon based on this ABC correction, the same pattern BCH experienced. This will lead to a sharp recovery and a strong bullish move in the near future. It could be very profitable and mark the beginning of a massive run for this coin in the bigger picture. Theta is heavily undervalued and ready for big things.
As always, stay profitable.
– Dalin Anderson

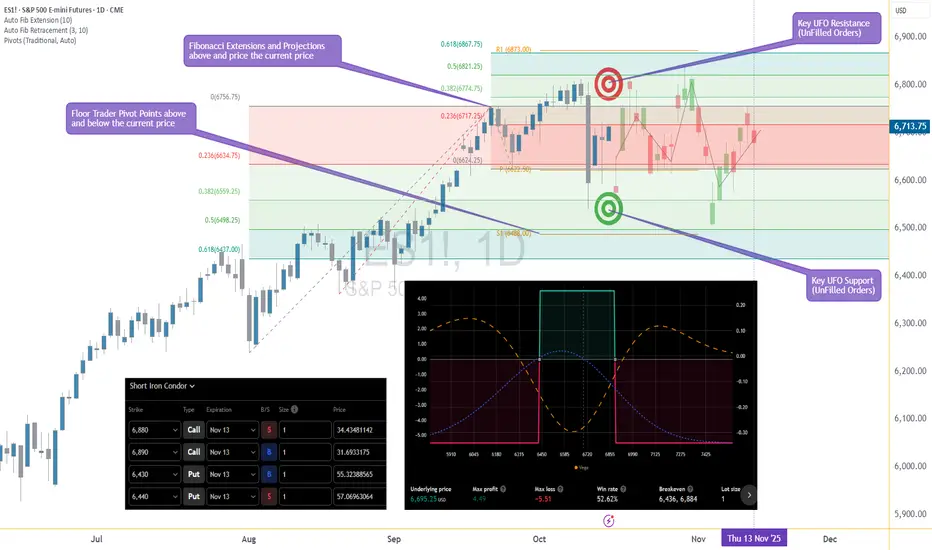
Options Blueprint Series [Intermediate]: ES Condor in the Clouds1 — The Market in a Cloud Layer
The S&P 500 (E-mini and Micro E-mini) futures have recently been caught in a curious atmospheric pattern — not of weather, but of price action. After a strong sell-off shook the market a few days ago, both Fibonacci extensions and retracement zones now cluster densely above and below the current price. When these are joined by multiple Floor Trader Pivot Points and Unfilled Order (UFO) zones sitting in similar regions, a clear message emerges: this market is potentially trapped in a range.
Resistance has been repeatedly observed near 6,873, while the lower boundary around 6,437 continues to attract buyers. The index seems to be trapped between Fibs — a typical post-volatility consolidation phase.
For traders who understand that sideways markets can be just as valuable as trending ones, this environment presents an opportunity. Instead of chasing direction, the goal becomes to capture time decay while staying within defined risk limits.
2 — The Strategy: Short Iron Condor Fundamentals
A Short Iron Condor combines two credit spreads:
A short call spread above current price
A short put spread below current price
Together, they create a “no-fly zone” for the underlying — a region where the trader earns maximum profit if price remains between the inner strikes.
This position benefits from:
Stable or neutral price movement
Time decay (theta)
Declining implied volatility
The Iron Condor offers defined risk and defined reward, making it a powerful candidate for range-bound markets like the current ES setup. While the maximum gain is limited to the net premium collected, the maximum loss is also capped, making this a risk-defined non-directional strategy.
Because this structure has both call and put spreads, it offers low Vega exposure — meaning it’s not overly sensitive to volatility shocks. For intermediate traders, this makes it a comfortable way to step beyond simple single-leg strategies and into the world of multi-leg, theta-driven structures.
3 — The Setup: Building the ES Condor
For this idea, we’re looking at the ES (E-mini S&P 500 Futures) options expiring on November 13.
The structure is built as follows:
Sell 6880 Call @ 34.43
Buy 6890 Call @ 31.69
Buy 6430 Put @ 55.32
Sell 6440 Put @ 57.07
This results in a net credit, generating the potential for a maximum profit of 4.49 points (per spread), while the maximum risk stands at -5.51 points. The reward-to-risk ratio comes to approximately 0.8:1, with a statistical win rate of 52.6% based on the current volatility surface, and the Breakeven points: 6,436 and 6,884.
As long as the ES price remains between these levels by expiration, the structure will achieve profitability. The Iron Condor works best when volatility remains stable or contracts — a condition currently supported by the post-drop equilibrium visible in implied volatility readings across near-term expirations.
4 — Chart Context: Technical Landscape Supporting the Range
The chart of the E-mini S&P 500 Futures (ES) reveals a tight compression zone forming between Fibonacci extensions and retracement levels above @ 0.618 (≈6,868) and below @ 0.618 (≈6,437). This overlap with Floor Trader Pivots — specifically R1 at 6,873 and S1 at 6,488 — paints a classic range structure. This setup can be the natural habitat for an Iron Condor.
While directional traders may feel frustrated by sideways movement, option sellers can see this as a period of controlled opportunity — where theta decay compensates for the market’s hesitation.
In other words, as long as ES continues to “hover in the clouds,” the Condor quietly collects premium.
5 — CME Product Specifications and Margins
Understanding the underlying contracts is essential when selecting between E-mini S&P 500 Futures (ES) and Micro E-mini S&P 500 Futures (MES) for this options setup.
E-mini S&P 500 (ES) Futures
Tick Size: 0.25 = $12.50 per tick
Trading Hours: Nearly 24 hours (Sunday–Friday, CME Globex)
Margin (approx.): $21,000 per contract
Micro E-mini S&P 500 (MES) Futures
Contract Size: 1/10 of ES
Tick Size: 0.25 = $1.25 per tick
Margin (approx.): $2,100 per contract
(Margins may vary slightly depending on volatility and broker policies.)
For smaller accounts or for traders looking to practice scaling and hedging, the MES provides a highly capital-efficient alternative to ES.
When executing the Short Iron Condor, traders may also consider margin offsets if the structure is risk-defined — a benefit when using portfolio margin accounts. However, margin usage will vary by broker and account type.
6 — Risk Management: Keeping the Condor in the Clouds
Every Iron Condor begins with a disciplined approach to risk.
Here’s how it can be managed:
Position Sizing: Determine exposure based on the maximum loss, not the credit received. For instance, risking 1–2% of account equity per structure keeps risk contained even during volatility spikes.
Exit Before Expiration: Avoid gamma risk in the final days. Closing the trade when 50–60% of the maximum profit is achieved can reduce time risk while locking in gains.
Adjustments: If price nears a breakeven zone (6,436 or 6,884), traders can consider rolling the threatened side further away or closing half of the position to reduce delta exposure.
Volatility Awareness: A volatility spike can temporarily pressure the mark-to-market value.
Because the Iron Condor is short Vega, it benefits from a calm or contracting volatility regime.
When markets are calm, this strategy works beautifully; when storms approach, it’s time to bring the Condor to the ground.
When charting futures, the data provided could be delayed. Traders working with the ticker symbols discussed in this idea may prefer to use CME Group real-time data plan on TradingView: www.tradingview.com - This consideration is particularly important for shorter-term traders, whereas it may be less critical for those focused on longer-term trading strategies.
General Disclaimer:
The trade ideas presented herein are solely for illustrative purposes forming a part of a case study intended to demonstrate key principles in risk management within the context of the specific market scenarios discussed. These ideas are not to be interpreted as investment recommendations or financial advice. They do not endorse or promote any specific trading strategies, financial products, or services. The information provided is based on data believed to be reliable; however, its accuracy or completeness cannot be guaranteed. Trading in financial markets involves risks, including the potential loss of principal. Each individual should conduct their own research and consult with professional financial advisors before making any investment decisions. The author or publisher of this content bears no responsibility for any actions taken based on the information provided or for any resultant financial or other losses.
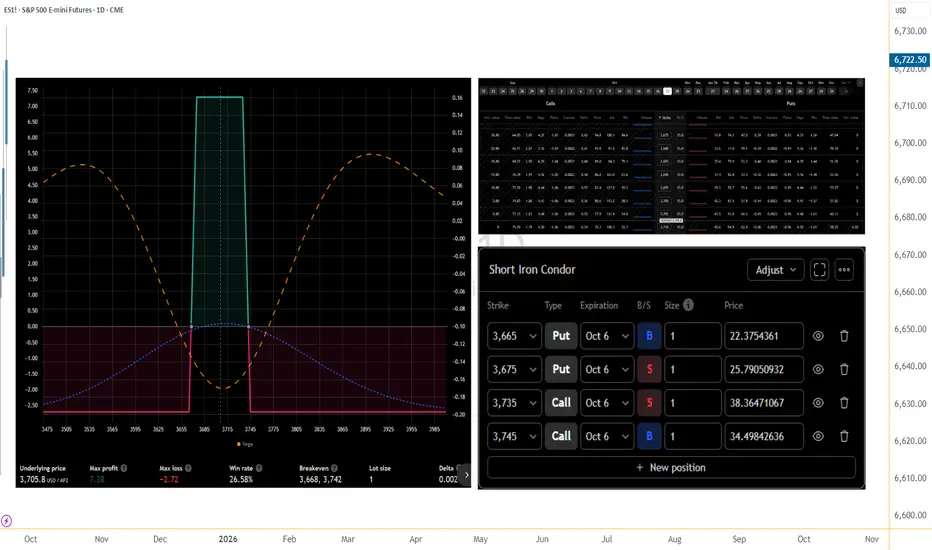
When the Yen Fell Out of Bed — And Time Picked It Up1. Yen Drama at the Open 🎭
The Japanese Yen Futures (6J) woke up after the weekend and immediately faceplanted into the lower Bollinger Band®. Big gap, lots of noise — the classic “what just happened?” moment.
Now, that gap around 0.0068 might just invite a mean reversion, because markets love to clean up after their weekend messes. Instead of chasing direction, we’ll let time do the heavy lifting.
2. The Strategy — A Time-Based Power Nap 😴
We’re running a Horizontal Call Spread (Calendar Spread) — same strike, different expiration dates:
Buy Nov 7 Call @ 0.00680
Sell Oct 24 Call @ 0.00680
You’re basically saying: “Hey, Yen, take your time — but drift a little upward, okay?”
If price chills near 0.0068, theta decay works for us. If it crashes again, we lose just our debit. Simple, elegant, zen.
3. Quick Specs (Because You’re Smart) 💡
Contract size: 12,500,000 Yen
Tick value: $6.25 (0.0000005)
Margin: ≈ $2,800 (outright futures)
Calendar Spread Risk = $237.50 debit
Setup target: gap-fill near 0.0068+
Risk is capped, reward potential roughly 3:1, and all you need is a calm market — not a hero move.
4. The Trader’s Zen Moment 🧘
This setup wins if price stabilizes and time passes — that’s it.
You’re not fighting the market; you’re getting paid for waiting.
While others panic, you’re sipping tea, letting theta do the work.
5. Takeaway 🍵
Gaps often fill.
Time spreads love calm markets.
Less stress, more logic.
Sometimes, the best move in trading is to stop anticipating — and start aging gracefully with your positions.
Want More Depth?
If you’d like to go deeper into the building blocks of trading, check out our From Mystery to Mastery trilogy, three cornerstone articles that complement this one:
🔗 From Mystery to Mastery: Trading Essentials
🔗 From Mystery to Mastery: Futures Explained
🔗 From Mystery to Mastery: Options Explained
When charting futures, the data provided could be delayed. Traders working with the ticker symbols discussed in this idea may prefer to use CME Group real-time data plan on TradingView: www.tradingview.com - This consideration is particularly important for shorter-term traders, whereas it may be less critical for those focused on longer-term trading strategies.
General Disclaimer:
The trade ideas presented herein are solely for illustrative purposes forming a part of a case study intended to demonstrate key principles in risk management within the context of the specific market scenarios discussed. These ideas are not to be interpreted as investment recommendations or financial advice. They do not endorse or promote any specific trading strategies, financial products, or services. The information provided is based on data believed to be reliable; however, its accuracy or completeness cannot be guaranteed. Trading in financial markets involves risks, including the potential loss of principal. Each individual should conduct their own research and consult with professional financial advisors before making any investment decisions. The author or publisher of this content bears no responsibility for any actions taken based on the information provided or for any resultant financial or other losses.

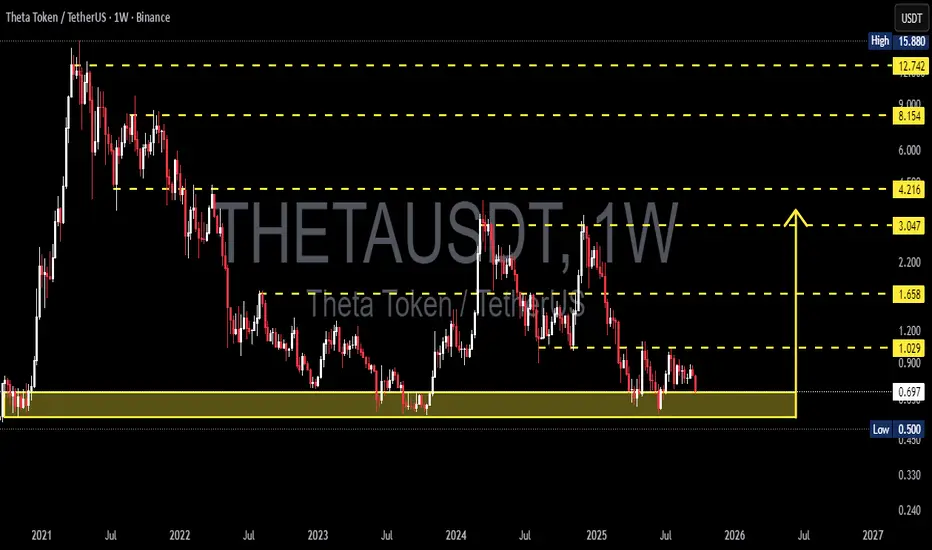
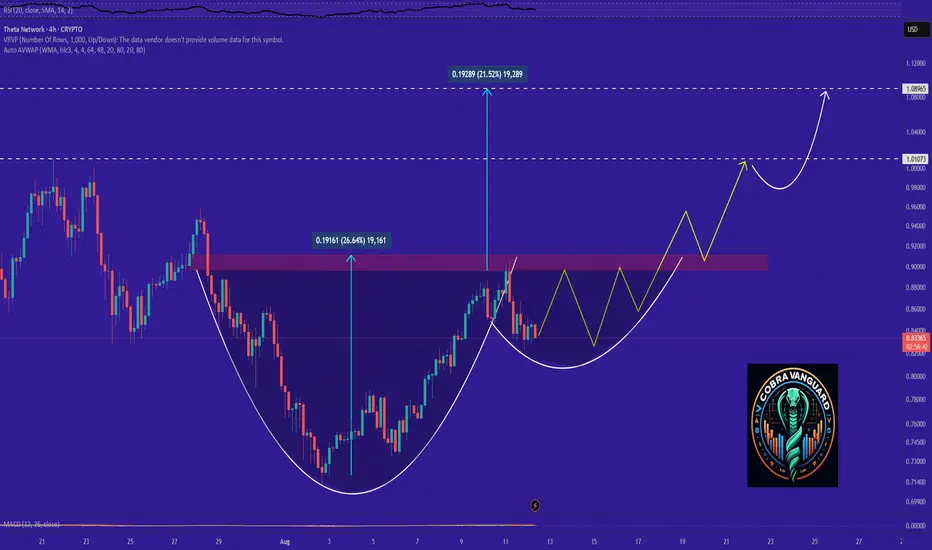
THETA/USDT — Demand Zone Retest: Strong Rebound or Breakdown?📌 Overview
THETA is currently trading at a critical decision point, sitting right inside the multi-year demand zone of $0.50–$0.75, with the price hovering around $0.694. This area has acted as a strong base since 2021, and the next move will determine whether THETA is gearing up for a major rebound or facing another leg down in its prolonged bearish trend.
---
🔹 Structure & Pattern Analysis
Macro Trend: Since hitting the all-time high of $15.88 in 2021, THETA has consistently formed lower highs, showing a dominant bearish structure.
Key Demand Zone: The $0.50–$0.75 range has acted as a long-term floor for more than 3 years.
Chart Pattern: The structure resembles a descending triangle (flat support with lower highs), a pattern that usually favors breakdowns — though invalidation remains possible with a confirmed breakout to the upside.
Accumulation Hints: Decreasing sell volume during each retest of the demand zone suggests seller exhaustion and potential long-term accumulation.
---
🔹 Bullish Scenario
1. Strong Rebound From Demand Zone
If THETA holds above $0.50–$0.75 and prints a strong bullish weekly candle (hammer or engulfing), it may signal accumulation strength.
2. First Confirmation:
A weekly close above $1.03 (immediate resistance) → signals that buyers are regaining control.
3. Upside Targets:
Target 1: $1.66
Target 2: $3.05
Target 3: $4.22
Breaking higher could extend toward $8.15 – $12.74, and possibly retest the ATH at $15.88 in the long run.
4. Momentum Validation:
RSI reclaiming >50 + MACD bullish cross would strengthen the bullish case.
---
🔹 Bearish Scenario
1. Confirmed Breakdown Below $0.50
A weekly close below $0.50 would confirm a bearish continuation and invalidate the demand zone.
2. Failed Retest:
If the price retests $0.50–$0.55 and fails to reclaim, it could trigger accelerated selling pressure.
3. Downside Targets:
Target 1: $0.33
Target 2: $0.24 (multi-year bottom)
4. Risk:
A breakdown below $0.50 may cause capitulation, with long-term holders potentially exiting positions.
---
🔹 Trading Strategy & Risk Management
Long-Term Investors (DCA): Gradual accumulation within $0.50–$0.75, with a conservative stop loss below $0.45.
Swing Traders: Enter long after a confirmed breakout and weekly close above $1.03, targeting $1.66+.
Bearish Traders: Short setups become valid if weekly closes below $0.50, with targets toward $0.33–$0.24.
Risk Control: Always apply stop losses. Maintain a minimum risk-to-reward ratio of 1:2 before entering.
---
🔹 Conclusion
THETA is standing at a make-or-break zone.
As long as it holds above the $0.50–$0.75 demand zone, the potential for a major rebound remains alive, especially if $1.03 is broken to the upside.
However, a weekly close below $0.50 would confirm a bearish continuation, opening the path to new lows.
The upcoming weekly closes will be decisive — the next candles could shape THETA’s direction not just for months, but potentially for years.
---
#THETA #Crypto #Altcoin #TechnicalAnalysis #PriceAction #SupportResistance #Breakout #Breakdown #CryptoTrading
From Mystery to Mastery: Options ExplainedIntroduction: Why Options Feel Complicated
Options are perhaps the most misunderstood instruments in trading. To the untrained eye, they seem like an impossible puzzle: strange terminology, an overwhelming options chain filled with numbers, and payoff diagrams that bend in multiple directions. Many traders dismiss them as “too complex,” or worse, confuse them with gambling.
But options are not about chance — they are about choice. Each contract offers the trader a way to shape risk, control exposure, and adapt to unique market conditions. While this flexibility comes with greater sophistication, it also unlocks a toolkit that no other instrument can match.
The visuals you can see at the top of this publication — an options risk profile with multiple legs and a snapshot of an options chain — illustrate this dual nature. At first glance, the visuals are busy, packed with strikes, expirations, premiums, and curved payoff lines. Yet these are the very tools that make options versatile. They can be combined to express bullish, bearish, neutral, or volatility-driven views with precision.
The goal of this article is to take the mystery out of options and highlight why their complexity is worth understanding. Step by step, we’ll explore how they work, how the Greeks shape outcomes, how different strategies can be structured, and why they play such a vital role when layered onto futures trading.
What Are Options?
At their simplest, options are contracts that give the buyer the right, but not the obligation, to buy or sell an asset at a predetermined price within a specific time period. That asset may be a stock, a futures contract, or even an index.
Two Building Blocks
Call Options: Give the right to buy the underlying at the strike price. Traders buy calls when they expect the underlying to rise.
Put Options: Give the right to sell the underlying at the strike price. Traders buy puts when they expect the underlying to fall.
The Price of an Option: The Premium
Option buyers pay a premium, while option sellers collect it. This premium reflects the market’s assessment of risk and probability, and it changes constantly with price, volatility, and time.
Intrinsic vs. Extrinsic Value
Intrinsic Value: The amount an option would be worth if it were exercised immediately. For example, a call with a strike below the current price has intrinsic value.
Extrinsic Value: The “time value” built into the premium — compensation for the uncertainty of where price may go before expiration.
Why Options Matter
Unlike buying or selling the underlying directly, options allow traders to shape their exposure: define maximum risk, set conditional payoffs, or even profit from time decay and volatility changes.
The above options chain screenshot illustrates how layered this world can be. Rows of strikes, bid-ask quotes, open interest, and implied volatility may look daunting at first. But each piece of data contributes to building strategies that fit specific objectives.
The Greeks Made Simple
If the options chain is the menu, then the Greeks are the ingredients that determine how a position behaves. Each Greek measures a different sensitivity, helping traders understand not just what they are trading, but how it will move as conditions change.
Delta (Δ)
Measures how much an option’s price will change for a one-point move in the underlying asset.
A delta of 0.50 means the option should gain about 0.50 units if the underlying rises by 1.
Traders often use delta as a proxy for probability of finishing in the money.
Gamma (Γ)
Tracks how much delta itself will change as the underlying moves.
High gamma means delta can shift rapidly, often near at-the-money strikes close to expiration.
This makes gamma a key driver of volatility in option prices.
Theta (Θ)
Represents time decay — the amount an option loses each day, all else equal.
Options are wasting assets; as expiration approaches, time value shrinks faster.
Option sellers often seek to benefit from theta, while buyers must overcome it.
Vega (ν)
Measures sensitivity to changes in implied volatility (IV).
A higher vega means the option’s value rises more when volatility increases.
Since IV often spikes in uncertain times, vega is crucial for traders who position around events.
Rho (ρ)
Tracks sensitivity to interest rate changes.
While less relevant in low-rate environments, rho matters for longer-dated options.
Why the Greeks Matter
Taken together, the Greeks form a multidimensional risk profile. A trader isn’t just long or short — they are exposed to directional risk (delta), acceleration (gamma), time decay (theta), volatility (vega), and interest rates (rho).
The earlier options risk profile diagram illustrates how these forces combine in multi-leg positions. Each curve on the graph reflects the complex interplay of the Greeks, showing why mastering them is essential for managing sophisticated strategies.
Core Options Strategies
Options can be as simple or as sophisticated as a trader chooses. At their core, all strategies are built from just two instruments — calls and puts — yet when combined, they create a vast range of payoff structures.
Directional Strategies
Long Calls: Buying a call gives upside exposure with limited downside (the premium paid).
Long Puts: Buying a put provides downside exposure with limited risk.
These are straightforward but carry the burden of time decay (theta).
Income Strategies
Covered Calls: Holding the underlying asset while selling a call against it. This generates premium income but caps upside.
Cash-Secured Puts: Selling a put while holding cash collateral. If assigned, the trader buys the underlying at the strike price.
Risk-Defined Spreads
Vertical Spreads: Buying one option and selling another at a different strike in the same expiration. This defines both maximum risk and reward.
Iron Condors: A combination of spreads that profits if the underlying stays within a range. Risk and reward are defined upfront.
The above iron condor risk profile chart shows exactly how this works: profit is maximized in the middle range, while losses are capped outside the wings.
Why Structure Matters
Each strategy has its strengths and weaknesses, but the true value of options lies in their flexibility. Traders can design positions to fit directional views, volatility expectations, or income objectives — all with defined risk.
Options strategies are like tools in a kit: the more you understand their mechanics, the more precisely you can shape your market exposure.
Options on Futures
Most traders first encounter options through stocks, but options on futures open the door to even broader applications. While the mechanics are similar, there are key distinctions worth noting.
Underlying Differences
Stock options are tied to shares of a company.
Options on futures are tied to futures contracts — which themselves already embed leverage and expiration.
This layering adds both flexibility and complexity. A trader is essentially trading an option on a leveraged instrument.
Practical Use Cases
Hedging Commodity Risk: An airline might use crude oil futures to lock in prices, then overlay options to cap extreme scenarios while reducing hedging costs.
Speculating with Defined Risk: A trader bullish on gold can buy a call option on gold futures. The maximum loss is the premium, but the upside tracks leveraged futures moves.
Volatility Plays: Futures options often respond strongly to shifts in implied volatility, especially around key reports or geopolitical events.
Why They Matter
Options on futures give traders the ability to fine-tune exposures. Instead of committing to full futures leverage, a trader can scale in with options, controlling downside while keeping upside potential open.
They also broaden the range of strategies available. Futures already expand diversification; adding options introduces an entirely new layer of flexibility.
Index Options
Among the most widely traded options in the world are those based on equity indexes, such as the S&P 500 or Nasdaq-100. These instruments serve as essential tools for institutions and active traders alike.
Why Index Options Are Popular
Portfolio Hedging: Instead of hedging each stock individually, investors can use index puts to protect an entire portfolio.
Exposure Without Ownership: Index options allow participation in market moves without holding any individual company shares.
Liquidity and Depth: Index options often trade with deep volume and open interest, making them attractive for both large and small participants.
Volatility and the Options Surface
A key feature of index options is their relationship with volatility. The chart below — an implied volatility surface/skew diagram — shows how options with different strikes and maturities carry different implied volatilities.
Volatility Skew: Out-of-the-money puts often trade with higher implied volatility, reflecting demand for downside protection.
Term Structure: Near-term expirations may reflect event risk (such as earnings or Fed meetings), while longer maturities capture broader market uncertainty.
Why It Matters
Index options aren’t just directional bets. They are also instruments for trading volatility, sentiment, and risk itself. Institutions rely on them to hedge, while traders use them to capture shifts in implied volatility across strikes and expirations.
By understanding how skew and surfaces behave, traders can better interpret market expectations — not just where prices may go, but how uncertain participants feel about the path forward.
Risk Management with Options
Options provide unmatched flexibility — but that flexibility can tempt traders into overcomplicating positions or underestimating risk. Mastery comes from structuring trades with risk control at the core.
Defined vs. Undefined Risk
Defined-Risk Trades: Spreads and combinations such as verticals or iron condors cap both upside and downside. Maximum loss is known from the start.
Undefined-Risk Trades: Selling naked calls or puts exposes traders to potentially unlimited risk. While these strategies may generate steady premiums, one large adverse move can wipe out months or years of gains.
Managing Volatility Exposure
Volatility can shift rapidly, especially around earnings reports, central bank decisions, or geopolitical events.
A long option position benefits from rising implied volatility but suffers if volatility collapses.
A short option position gains from falling volatility but risks severe losses if volatility spikes.
Theta Decay and Time Management
Time decay (theta) erodes option premiums every day.
Buyers must ensure their directional or volatility edge is strong enough to overcome this drag.
Sellers must balance the benefit of theta decay against the risk of sharp, unexpected price moves.
Position Sizing Still Matters
Even defined-risk strategies can compound losses if oversized. Options’ leverage allows traders to control significant exposure with relatively small premiums, making discipline in sizing just as important as with futures.
The Core Principle
Options don’t eliminate risk — they reshape it. Effective risk management means choosing strategies where the risk profile matches your conviction, market conditions, and tolerance for uncertainty.
Common Mistakes New Options Traders Make
Options open powerful opportunities, but without structure, beginners often fall into predictable traps. Recognizing these mistakes is the first step to avoiding them.
Chasing Cheap Out-of-the-Money Options
Many new traders are attracted to options with very low premiums, believing they offer “lottery ticket” potential. While the payoff looks appealing, the probability of expiring worthless is extremely high.
Ignoring Implied Volatility
Price direction isn’t the only driver of option value. A trader might buy a call, see the underlying rise, yet still lose money because implied volatility dropped. Treating options as simple directional bets ignores one of their most critical dimensions.
Overusing Undefined-Risk Positions
Naked calls and puts can seem attractive because of the steady income from premium collection. But without defined risk, these trades can expose traders to devastating losses when markets move sharply.
Mismanaging Time Decay
Theta works against buyers, and new traders often underestimate how fast options lose value near expiration. Buying short-dated options without accounting for theta can erode capital even when the underlying moves in the expected direction.
Forgetting the Exercise and Assignment Process
Options on futures and equities alike can be exercised or assigned. New traders often overlook the obligations that come with short positions, leading to unexpected futures or stock exposures.
Takeaway
Every mistake above comes from misunderstanding what options truly are: instruments shaped not only by direction, but also by time, volatility, and structure. Avoiding these pitfalls is what separates those who dabble from those who progress toward mastery.
Conclusion: From Complexity to Clarity
Options may seem intimidating at first glance. The crowded options chain, the curved payoff diagrams, and the alphabet soup of Greeks can overwhelm even experienced traders. Yet within this complexity lies unmatched versatility.
Options allow traders to:
Define risk with precision.
Express bullish, bearish, or neutral views.
Trade volatility and time as independent variables.
Hedge portfolios against unexpected events.
The charts in this article — from the iron condor risk profile to the volatility skew surface — highlight the breadth of possibilities. They show why options are not a single strategy, but a toolkit that adapts to any market condition.
The challenge is not to memorize every strategy, but to understand how the pieces fit together: calls, puts, Greeks, spreads, volatility, and time. Once these elements stop being a mystery, options transform from a confusing maze into a structured path toward mastery.
This article completes our From Mystery to Mastery trilogy. We began with Trading Essentials, laying the foundation. We advanced into Futures Explained, exploring leverage and diversification. Now, with Options Explained, we’ve reached the most versatile and sophisticated layer of trading.
The journey doesn’t end here. Futures and options will always evolve with markets, offering new challenges and opportunities. But with a structured process, disciplined risk management, and the mindset of continuous learning, traders can move confidently — from mystery to mastery.
From Mystery to Mastery trilogy:
Options add a powerful layer of flexibility to trading, whether used for directional plays, income strategies, or hedging. Since many actively traded options are written on futures contracts listed on CME Group exchanges, it’s important to note that chart data can sometimes be delayed. For those who wish to analyze these products in real time on TradingView, a CME Group real-time data plan is available: www.tradingview.com . Traders focused on short-term options strategies, where timing and volatility shifts matter most, will find real-time access particularly valuable.
General Disclaimer:
The trade ideas presented herein are solely for illustrative purposes forming a part of a case study intended to demonstrate key principles in risk management within the context of the specific market scenarios discussed. These ideas are not to be interpreted as investment recommendations or financial advice. They do not endorse or promote any specific trading strategies, financial products, or services. The information provided is based on data believed to be reliable; however, its accuracy or completeness cannot be guaranteed. Trading in financial markets involves risks, including the potential loss of principal. Each individual should conduct their own research and consult with professional financial advisors before making any investment decisions. The author or publisher of this content bears no responsibility for any actions taken based on the information provided or for any resultant financial or other losses.
THETA – Resistance Rejection, Targeting Accumulation Rang LowTHETA is currently showing signs of rejection at resistance from a lower high, indicating a potential move to the downside. This pullback could drive the price toward the bottom of its current accumulation range, where stronger support may be found.
📌 Trade Setup:
• Entry Zone: $0.70 – $0.75
• Take Profit Targets:
o 🥇 $0.95 – $1.00
o 🥈 $1.60 – $1.72
o 🥉 $2.13 – $2.25
• Stop Loss: Below ~$0.50

Why THETA Remains Bullish and Its Next Potential Move !It appears that the price is forming a cup and handle pattern, and if this occurs, it could push the price above $0.90.
Best regards CobraVanguard.💚
THETA Bounces Off Key Support – Eyes on Resistance!After months of holding above the key support zone, MYX:THETA is finally showing some strength.
Price is bouncing off the lows and heading toward a minor S/R zone.
If the bulls can break through this level, there’s a good chance we’ll see a move all the way up to the upper resistance line.
DYOR, NFA

THETA Long Swing Setup – Accumulation Phase Near BreakoutTHETA is still consolidating in a range, but momentum is quietly building. A break above $1.07 followed by a higher low would confirm structural reversal. We’re eyeing the $0.95–$1.00 zone for a clean entry on retest, offering solid risk-reward if support holds.
📌 Trade Setup:
• Entry Zone: $0.95 – $1.00
• Take Profit Targets:
o 🥇 $1.60 – $1.70
o 🥈 $2.10 – $2.20
• Stop Loss: Daily close below $0.90

Is #THETA Ready For a Major Reversal or Another Fakeout ahead?Yello, Paradisers! Is this breakout the beginning of a bullish reversal for #THETA or just a setup to trap the herd before a sharp dump? Let’s break down the setup of #ThetaNetwork:
💎After weeks of slow bleeding inside a falling wedge, #THETAUSDT has broken out of this pattern. The price is currently hovering around $0.718, and it’s the first time in weeks we’re seeing real bullish momentum starting to build. The volume is slowly picking up, so the probability of a bullish push is higher.
💎A clean breakout above the descending resistance now opens the door toward moderate resistance at $0.999. That’s the next key hurdle where we expect sellers to show up. If bulls are strong enough to clear that zone, we’re targeting the strong supply level at $1.284, where significant distribution will likely begin.
💎Why this setup matters: The support zone between $0.60 and $0.66 has acted as strong demand for multiple weeks now for #THETAUSD. Price wicked into it again recently and got bought up quickly, forming a potential higher low. This kind of accumulation behavior often precedes a strong leg up if volume confirms the move.
💎However, if price loses the key support at $0.60, and more importantly breaks below the setup invalidation level at $0.439, we’ll treat this as a failed breakout and expect a deeper correction. That would bring us back into the lower demand zones, and we’ll sit on our hands until the next proper high-probability entry appears.
Stay patient, Paradisers. Let the breakout confirm, and only then do we strike with conviction.
MyCryptoParadise
iFeel the success🌴

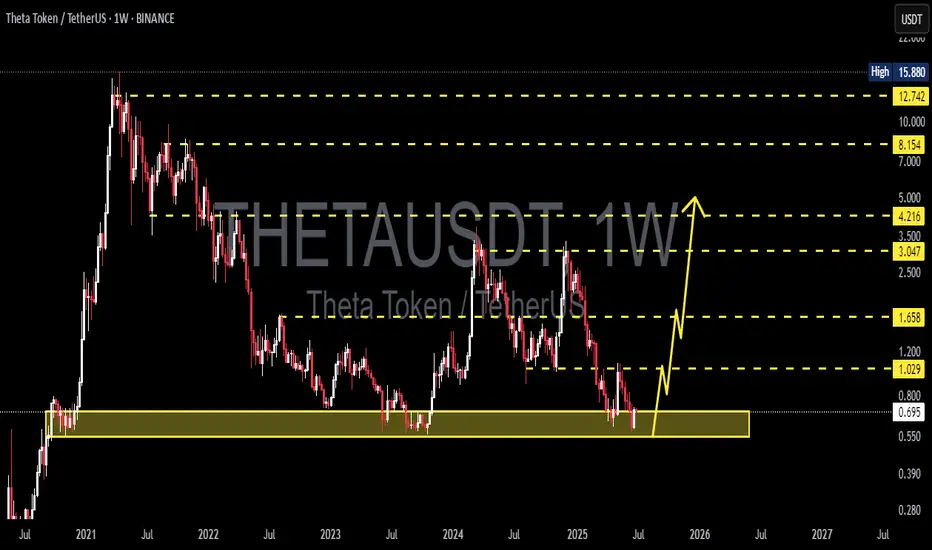
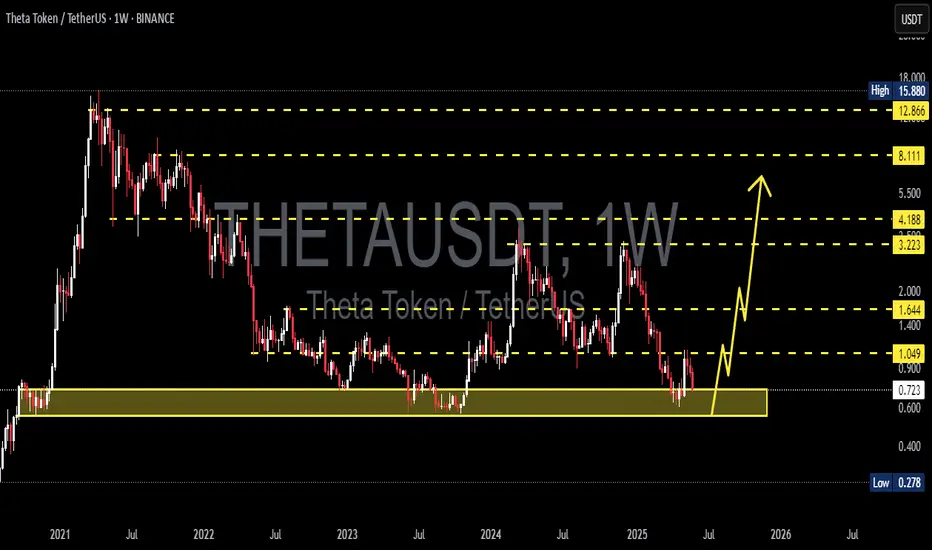
THETA Holding the Line – A Hidden Gem Before the Next Altseason?
🔍 Chart Structure and Key Zones:
Timeframe: 1W (Weekly)
Major Historical Support: The yellow zone between $0.55 - $0.70 has been tested multiple times since 2021.
The current price is once again retesting this strong support area, showing signs of a potential bullish bounce.
📈 Bullish Scenario:
If the support at $0.696 holds and triggers a reversal:
Potential short-term targets are:
$1.029 as the first minor resistance
Breakout above $1.658 could lead to a rally toward:
$3.047
$3.50
$4.216
If bullish momentum sustains, long-term targets include:
$8.154
$12.742
And possibly a retest of the all-time high at $15.880
> This price action suggests the formation of a potential Double Bottom pattern — a classic bullish reversal signal on higher timeframes.
📉 Bearish Scenario:
If price breaks below the support zone of $0.696 – $0.55:
The bullish setup becomes invalidated.
There is little significant support below $0.55, which could lead to an aggressive selloff.
This would indicate a possible final capitulation phase before a true macro bottom is formed.
📊 Chart Pattern Insight:
Potential Double Bottom forming in a high-confluence support zone
Signs of accumulation structure with long lower wicks (indicating buyers stepping in)
Bullish impulse projection is marked if a breakout confirms
🔖 Conclusion:
The $0.55 - $0.70 zone is a critical turning point for THETA.
If held, this could mark the beginning of a long-term trend reversal.
The current setup offers a favorable risk-reward ratio for swing and long-term traders, though caution is needed if the support fails.
#THETAUSDT #THETA #CryptoAnalysis #TechnicalAnalysis #CryptoBreakout #BullishReversal #AltcoinSeason #SupportAndResistance #DoubleBottom #SwingTrade
Theta Is Ready for a Strong Recovery Soon!Looking at Theta, I see strong potential for a recovery very soon. We just completed a classic ABC correction, very similar to what Amazon experienced back in the day. I expect a big bullish move on this coin shortly. We are primed for a strong reversal here.
Theta is undervalued on both the higher and lower time frames, and with such strong project fundamentals, I see this as a major mover in the upcoming altcoin bull market. There’s potential for insane gains on the larger time frames and a strong recovery on the smaller ones.
Don’t focus on the news or media—crypto is ready for big things. As always, stay profitable.
— Dalin Anderson

THETAUSDT: Weak Buyers & Your Short Opportunity in the Red BoxAlright everyone, with a critical update on THETAUSDT. Here’s the stark truth: buyers, in general, are weak. This isn't a market signaling strong demand, and it's a mistake to think otherwise.
Most traders get trapped by false signals. But you? You need a clear, confirmed path to profit. My strategy for THETAUSDT is precise: I absolutely will not take a short without clear confirmation from the red box. This isn't about guessing; it's about making calculated moves where the market reveals its true intent.
Look at the chart. That red box I've identified? That's your critical zone for potential short entries. When price engages with this area, we're not just watching; we're hunting for specific signals:
Volume Footprint: I'll be meticulously checking the volume footprint within that red box. Are sellers truly overwhelming buyers? Is there genuine distribution happening, not just a momentary pause?
CDV (Cumulative Delta Volume): Watch for CDV to turn definitively negative or show strong bearish divergences. This tells you the sellers are gaining true control, not just a fleeting advantage.
LTF Breakdowns: On the low timeframes (LTF), I need to see clear, decisive breakdowns. We're looking for price to fail, retest the red box as new resistance, and then continue its move lower. This is your confirmation.
Why does this matter? My focus is exclusively on assets showing a sudden and significant increase in volume. While THETAUSDT might not be seeing a bullish volume surge, understanding the volume dynamics within its weakness is how we pinpoint high-probability short setups.
Keep a very close eye on that red box. If the bearish confirmations line up, you'll uncover a clear, strategic short entry. Don't be surprised if THETAUSDT's price action confounds the masses; this is where smart, confirmed decisions are made.
📌I keep my charts clean and simple because I believe clarity leads to better decisions.
📌My approach is built on years of experience and a solid track record. I don’t claim to know it all but I’m confident in my ability to spot high-probability setups.
📌If you would like to learn how to use the heatmap, cumulative volume delta and volume footprint techniques that I use below to determine very accurate demand regions, you can send me a private message. I help anyone who wants it completely free of charge.
🔑I have a long list of my proven technique below:
🎯 ZENUSDT.P: Patience & Profitability | %230 Reaction from the Sniper Entry
🐶 DOGEUSDT.P: Next Move
🎨 RENDERUSDT.P: Opportunity of the Month
💎 ETHUSDT.P: Where to Retrace
🟢 BNBUSDT.P: Potential Surge
📊 BTC Dominance: Reaction Zone
🌊 WAVESUSDT.P: Demand Zone Potential
🟣 UNIUSDT.P: Long-Term Trade
🔵 XRPUSDT.P: Entry Zones
🔗 LINKUSDT.P: Follow The River
📈 BTCUSDT.P: Two Key Demand Zones
🟩 POLUSDT: Bullish Momentum
🌟 PENDLEUSDT.P: Where Opportunity Meets Precision
🔥 BTCUSDT.P: Liquidation of Highly Leveraged Longs
🌊 SOLUSDT.P: SOL's Dip - Your Opportunity
🐸 1000PEPEUSDT.P: Prime Bounce Zone Unlocked
🚀 ETHUSDT.P: Set to Explode - Don't Miss This Game Changer
🤖 IQUSDT: Smart Plan
⚡️ PONDUSDT: A Trade Not Taken Is Better Than a Losing One
💼 STMXUSDT: 2 Buying Areas
🐢 TURBOUSDT: Buy Zones and Buyer Presence
🌍 ICPUSDT.P: Massive Upside Potential | Check the Trade Update For Seeing Results
🟠 IDEXUSDT: Spot Buy Area | %26 Profit if You Trade with MSB
📌 USUALUSDT: Buyers Are Active + %70 Profit in Total
🌟 FORTHUSDT: Sniper Entry +%26 Reaction
🐳 QKCUSDT: Sniper Entry +%57 Reaction
📊 BTC.D: Retest of Key Area Highly Likely
📊 XNOUSDT %80 Reaction with a Simple Blue Box!
📊 BELUSDT Amazing %120 Reaction!
📊 Simple Red Box, Extraordinary Results
📊 TIAUSDT | Still No Buyers—Maintaining a Bearish Outlook
📊 OGNUSDT | One of Today’s Highest Volume Gainers – +32.44%
📊 TRXUSDT - I Do My Thing Again
📊 FLOKIUSDT - +%100 From Blue Box!
📊 SFP/USDT - Perfect Entry %80 Profit!
📊 AAVEUSDT - WE DID IT AGAIN!
I stopped adding to the list because it's kinda tiring to add 5-10 charts in every move but you can check my profile and see that it goes on..

#THETA 1D. Swing High Rejected – What's Next? 06/11/25We are currently in a consolidation range. After updating the swing high, price immediately faced seller pressure from the top of the structure.
Why did this happen?
Many participants were stuck in losses for a long time and decided to exit at breakeven as soon as price gave them the chance — totally understandable.
Key levels for the setup:
Yellow lines – potential entry points.
Red lines – stop-loss levels, depending on your risk appetite (marked two options).
Green lines – target areas.
Whether you go with spot or futures — the setup is there. Choose your strategy accordingly.
DYOR.

THETAUSDT 1D Analysis THETA ~ 1D Analysis
#THETA Buy after successfully breaking this resistance line with large volume. Minimum target 10%+, Long term target $3

THETAUSDT 1W AnalysisTHETA ~ 1W Analysis
#THETA Buy gradually from here if you still have confidence in this coin with a short term target of at least 20%+ from here.
THETA - Incoming ReversalSaw a rejection on the wave 4 level. Looking to gain a 5th wave reversal here.

THETAUSDT 1D Analysis THETA ~ 1D Analysis
#THETA Buy after successfully breaking this resistance line with a short term target of at least 10%+ from here.

#THETA/USDT#THETA
The price is moving within a descending channel on the 1-hour frame and is expected to break and continue upward.
We have a trend to stabilize above the 100 moving average once again.
We have a downtrend on the RSI indicator that supports the upward move with a breakout.
We have a support area at the lower limit of the channel at 0.899, which acts as strong support from which the price can rebound.
Entry price: 0.903
First target: 0.941
Second target: 0.966
Third target: 0.998

THETAUSDT Bounce from Demand ZoneTHETAUSDT has once again respected its long-term support zone, . This area has acted as a reliable demand zone multiple times in the past, leading to strong upward moves. The recent bounce from this level indicates continued buyer interest and potential for a bullish reversal.
If the current momentum sustains, we could see a move toward the $2.00–$2.50 range in the coming months. As long as THETA holds above the support zone, the bias remains bullish.
