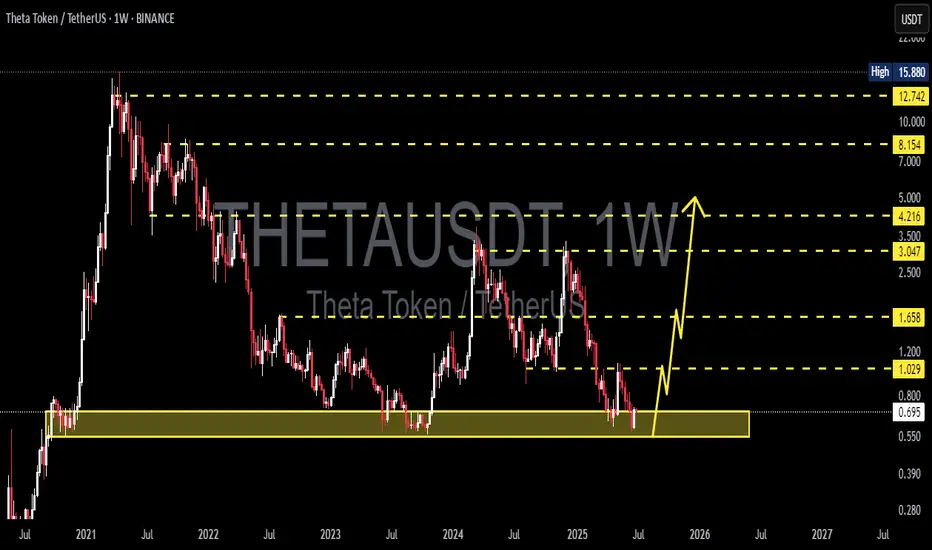
THETA Holding the Line – A Hidden Gem Before the Next Altseason?
🔍 Chart Structure and Key Zones:
Timeframe: 1W (Weekly)
Major Historical Support: The yellow zone between $0.55 - $0.70 has been tested multiple times since 2021.
The current price is once again retesting this strong support area, showing signs of a potential bullish bounce.
📈 Bullish Scenario:
If the support at $0.696 holds and triggers a reversal:
Potential short-term targets are:
$1.029 as the first minor resistance
Breakout above $1.658 could lead to a rally toward:
$3.047
$3.50
$4.216
If bullish momentum sustains, long-term targets include:
$8.154
$12.742
And possibly a retest of the all-time high at $15.880
> This price action suggests the formation of a potential Double Bottom pattern — a classic bullish reversal signal on higher timeframes.
📉 Bearish Scenario:
If price breaks below the support zone of $0.696 – $0.55:
The bullish setup becomes invalidated.
There is little significant support below $0.55, which could lead to an aggressive selloff.
This would indicate a possible final capitulation phase before a true macro bottom is formed.
📊 Chart Pattern Insight:
Potential Double Bottom forming in a high-confluence support zone
Signs of accumulation structure with long lower wicks (indicating buyers stepping in)
Bullish impulse projection is marked if a breakout confirms
🔖 Conclusion:
The $0.55 - $0.70 zone is a critical turning point for THETA.
If held, this could mark the beginning of a long-term trend reversal.
The current setup offers a favorable risk-reward ratio for swing and long-term traders, though caution is needed if the support fails.
#THETAUSDT #THETA #CryptoAnalysis #TechnicalAnalysis #CryptoBreakout #BullishReversal #AltcoinSeason #SupportAndResistance #DoubleBottom #SwingTrade
Thetausdtidea
THETAUSDT 1D Analysis THETA ~ 1D Analysis
#THETA Buy after successfully breaking this resistance line with large volume. Minimum target 10%+, Long term target $3

THETAUSDT 1W AnalysisTHETA ~ 1W Analysis
#THETA Buy gradually from here if you still have confidence in this coin with a short term target of at least 20%+ from here.
THETAUSDT 1D Analysis THETA ~ 1D Analysis
#THETA Buy after successfully breaking this resistance line with a short term target of at least 10%+ from here.

THETAUSDT 1WTHETA ~ 1W Analysis
#THETA Buy gradually from here with a short -term target of at least 20%+ from here.

THETAUSDT Analysis: Is the Bullish Momentum About to Fade?Yello, Paradisers! Are we witnessing a decisive move for THETA, or is the market setting us up for a breakdown? Let’s break it down.
💎THETA has shown a solid rebound upon touching its support zone, but the key lies in its next move. The 2.10 resistance level holds the deciding power. A daily close above this level would confirm a bullish continuation, potentially driving the price upward toward our target zones.
💎However, if THETA fails to reclaim 2.10, we could see a rejection that pulls the price back toward the 1.73–1.60 support area. Should this support hold, a rebound could occur, and we’ll be closely watching for a double bottom formation, which could signal a recovery.
💎The critical concern arises if the 1.73–1.60 support zone fails to hold. This area coincides with the support trendline, so a breakdown here would be a bearish signal, potentially driving the price downward toward the demand area.
💎Now, the demand zone near 1.16 is a vital level for THETA to maintain any bullish prospects. Historical rebounds in this zone are limited, so its importance cannot be overstated. A close below 1.16 would invalidate the bullish thesis and confirm a bearish trend.
Stay focused, trade smart, and remember—it's the disciplined traders who win the long game.
MyCryptoParadise
iFeel the success🌴

THETAUSDTTHETA ~ 1W
#THETA Currently it is forming a descending pattern on the 1W Time frame.
If you still have Conviction on this coin,. You can buy into these support blocks in stages. with a short term target of 20%+

THETAUSDT 1DTheta ~ 1D
#Theta The need to get out of this downward channel.
A good decision for this Token, Buy it when it breaks through the resistance line of this descending pattern.

THETAUSDT 1DTHETA ~ 1D
#THETA Bullish will be in control again after successfully breaking through the resistance line of this pattern. Minimum target 10%+

THETAUSD 1DTHETA ~ 1D
#THETA Make a purchase after successfully breaking through the resistance line of this pattern, with a minimum target of 15%+. Watch and wait for this pattern to be successfully broken.

Theta Usdt Forecast / Idea After the downtrend movement and hitting the 4-H support line, started an uptrend movement towards the resistance zone around 1.500, and then the next target is daily resistance at 1.630, which is in the 1.5 Fibonacci range.

THETAUSDT Head & Shoulder Pattern.!#THETAUSDT Looking for Sell trade setup as I mentioned in the Chart.!
Keep Supporting LIKE, COMMENT And FOLLOW.!
ThankYou.!

THETAUSDT AnalysisHello friends.
Please support my work by clicking the LIKE button(If you liked).Thank you!
Everything on the chart.
open pos: market and lower
target: 8 - 10 - 11
after first target reached move ur stop to breakeven
stop: under 4.7 (depending of ur risk). ALWAYS follow ur RM .
risk/reward 1 to 3.5
risk is justified
Good luck everyone!
Follow me on TRADINGView, if you don't want to miss my next analysis or signals.
It's not financial advice.
Dont Forget, always make your own research before to trade my ideas!
Open to your questions or suggestions.
