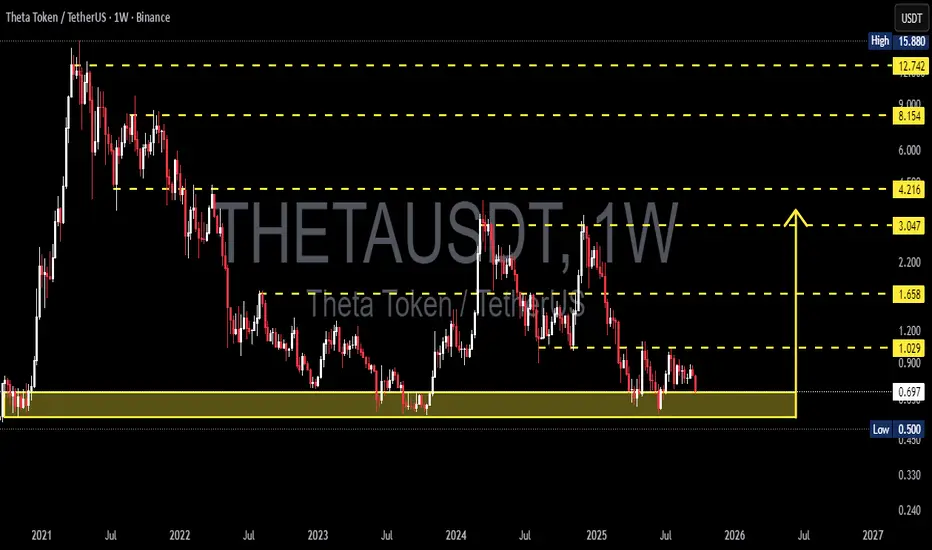
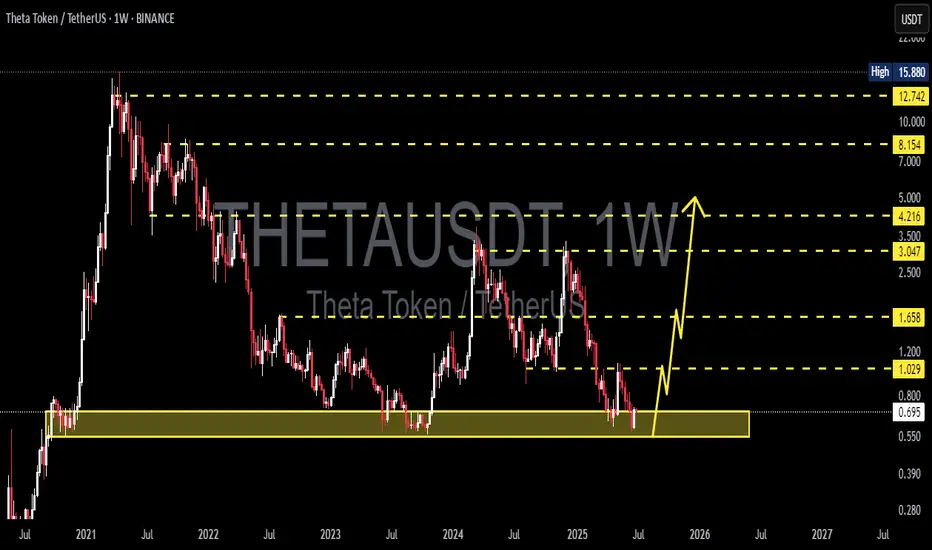
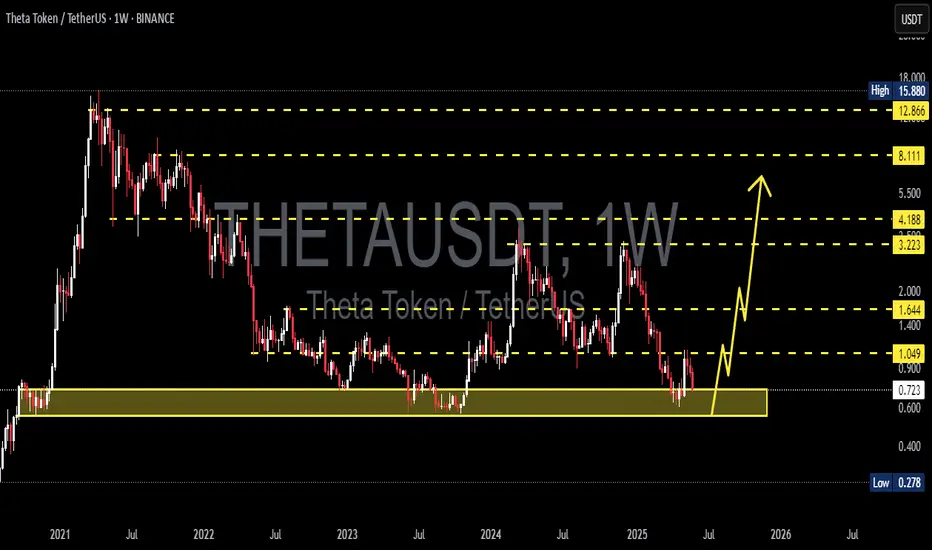
THETA/USDT — Demand Zone Retest: Strong Rebound or Breakdown?📌 Overview
THETA is currently trading at a critical decision point, sitting right inside the multi-year demand zone of $0.50–$0.75, with the price hovering around $0.694. This area has acted as a strong base since 2021, and the next move will determine whether THETA is gearing up for a major rebound or facing another leg down in its prolonged bearish trend.
---
🔹 Structure & Pattern Analysis
Macro Trend: Since hitting the all-time high of $15.88 in 2021, THETA has consistently formed lower highs, showing a dominant bearish structure.
Key Demand Zone: The $0.50–$0.75 range has acted as a long-term floor for more than 3 years.
Chart Pattern: The structure resembles a descending triangle (flat support with lower highs), a pattern that usually favors breakdowns — though invalidation remains possible with a confirmed breakout to the upside.
Accumulation Hints: Decreasing sell volume during each retest of the demand zone suggests seller exhaustion and potential long-term accumulation.
---
🔹 Bullish Scenario
1. Strong Rebound From Demand Zone
If THETA holds above $0.50–$0.75 and prints a strong bullish weekly candle (hammer or engulfing), it may signal accumulation strength.
2. First Confirmation:
A weekly close above $1.03 (immediate resistance) → signals that buyers are regaining control.
3. Upside Targets:
Target 1: $1.66
Target 2: $3.05
Target 3: $4.22
Breaking higher could extend toward $8.15 – $12.74, and possibly retest the ATH at $15.88 in the long run.
4. Momentum Validation:
RSI reclaiming >50 + MACD bullish cross would strengthen the bullish case.
---
🔹 Bearish Scenario
1. Confirmed Breakdown Below $0.50
A weekly close below $0.50 would confirm a bearish continuation and invalidate the demand zone.
2. Failed Retest:
If the price retests $0.50–$0.55 and fails to reclaim, it could trigger accelerated selling pressure.
3. Downside Targets:
Target 1: $0.33
Target 2: $0.24 (multi-year bottom)
4. Risk:
A breakdown below $0.50 may cause capitulation, with long-term holders potentially exiting positions.
---
🔹 Trading Strategy & Risk Management
Long-Term Investors (DCA): Gradual accumulation within $0.50–$0.75, with a conservative stop loss below $0.45.
Swing Traders: Enter long after a confirmed breakout and weekly close above $1.03, targeting $1.66+.
Bearish Traders: Short setups become valid if weekly closes below $0.50, with targets toward $0.33–$0.24.
Risk Control: Always apply stop losses. Maintain a minimum risk-to-reward ratio of 1:2 before entering.
---
🔹 Conclusion
THETA is standing at a make-or-break zone.
As long as it holds above the $0.50–$0.75 demand zone, the potential for a major rebound remains alive, especially if $1.03 is broken to the upside.
However, a weekly close below $0.50 would confirm a bearish continuation, opening the path to new lows.
The upcoming weekly closes will be decisive — the next candles could shape THETA’s direction not just for months, but potentially for years.
---
#THETA #Crypto #Altcoin #TechnicalAnalysis #PriceAction #SupportResistance #Breakout #Breakdown #CryptoTrading
Thetausdtlong
THETA Breakout Retest Done – Eyeing 20% Pump!
THETA has successfully broken out of its descending trendline (purple) and completed a clean retest. Price is now consolidating above the breakout zone, indicating strength and buyer control.
If this level holds, we could see a 15–20% upside move in the short term, with momentum possibly pushing towards the \$0.075–\$0.080 zone.
Key Points:
* ✅ Trendline breakout confirmed
* ✅ Retest completed successfully
* 📈 Bullish structure forming on lower timeframes
* 🎯 Short-term target: +15–20% from current levels
Trading Plan:
* Entry: Above breakout & retest level ($0.056–$0.058)
* SL: Below retest zone ($0.054–$0.055)
* TP1: $0.070
* TP2: $0.078–$0.080
Note: Maintain risk management and trail stop-loss as price moves in your favor.

THETA Holding the Line – A Hidden Gem Before the Next Altseason?
🔍 Chart Structure and Key Zones:
Timeframe: 1W (Weekly)
Major Historical Support: The yellow zone between $0.55 - $0.70 has been tested multiple times since 2021.
The current price is once again retesting this strong support area, showing signs of a potential bullish bounce.
📈 Bullish Scenario:
If the support at $0.696 holds and triggers a reversal:
Potential short-term targets are:
$1.029 as the first minor resistance
Breakout above $1.658 could lead to a rally toward:
$3.047
$3.50
$4.216
If bullish momentum sustains, long-term targets include:
$8.154
$12.742
And possibly a retest of the all-time high at $15.880
> This price action suggests the formation of a potential Double Bottom pattern — a classic bullish reversal signal on higher timeframes.
📉 Bearish Scenario:
If price breaks below the support zone of $0.696 – $0.55:
The bullish setup becomes invalidated.
There is little significant support below $0.55, which could lead to an aggressive selloff.
This would indicate a possible final capitulation phase before a true macro bottom is formed.
📊 Chart Pattern Insight:
Potential Double Bottom forming in a high-confluence support zone
Signs of accumulation structure with long lower wicks (indicating buyers stepping in)
Bullish impulse projection is marked if a breakout confirms
🔖 Conclusion:
The $0.55 - $0.70 zone is a critical turning point for THETA.
If held, this could mark the beginning of a long-term trend reversal.
The current setup offers a favorable risk-reward ratio for swing and long-term traders, though caution is needed if the support fails.
#THETAUSDT #THETA #CryptoAnalysis #TechnicalAnalysis #CryptoBreakout #BullishReversal #AltcoinSeason #SupportAndResistance #DoubleBottom #SwingTrade
THETAUSDT 1D Analysis THETA ~ 1D Analysis
#THETA Buy after successfully breaking this resistance line with large volume. Minimum target 10%+, Long term target $3

THETAUSDT 1W AnalysisTHETA ~ 1W Analysis
#THETA Buy gradually from here if you still have confidence in this coin with a short term target of at least 20%+ from here.
THETAUSDT 1D Analysis THETA ~ 1D Analysis
#THETA Buy after successfully breaking this resistance line with a short term target of at least 10%+ from here.

#THETA/USDT#THETA
The price is moving within a descending channel on the 1-hour frame and is expected to break and continue upward.
We have a trend to stabilize above the 100 moving average once again.
We have a downtrend on the RSI indicator that supports the upward move with a breakout.
We have a support area at the lower limit of the channel at 0.899, which acts as strong support from which the price can rebound.
Entry price: 0.903
First target: 0.941
Second target: 0.966
Third target: 0.998

THETAUSDT Bounce from Demand ZoneTHETAUSDT has once again respected its long-term support zone, . This area has acted as a reliable demand zone multiple times in the past, leading to strong upward moves. The recent bounce from this level indicates continued buyer interest and potential for a bullish reversal.
If the current momentum sustains, we could see a move toward the $2.00–$2.50 range in the coming months. As long as THETA holds above the support zone, the bias remains bullish.

THETAUSDT 1WTHETA ~ 1W Analysis
#THETA Buy gradually from here with a short -term target of at least 20%+ from here.

THETAUSDT 1WTHETA ~ 1W Analysis
#THETA Buy from here if you still have a Conviction on this coin with a minimum target of 20%+.

theta usdt Update"🌟 Welcome to Golden Candle! 🌟
We're a team of 📈 passionate traders 📉 who love sharing our 🔍 technical analysis insights 🔎 with the TradingView community. 🌎
Our goal is to provide 💡 valuable perspectives 💡 on market trends and patterns, but 🚫 please note that our analyses are not intended as buy or sell recommendations. 🚫
Instead, they reflect our own 💭 personal attitudes and thoughts. 💭
Follow along and 📚 learn 📚 from our analyses! 📊💡"

THETAUSDT 1WTHETA Update ~ 1W
#THETA still in a strong bullish trend. If you still have Conviction on this coin,. Buy gradually within this support block,. with a minimum target of 20%++

#THETA/USDT#THETA
The price is moving in a descending channel on the 4-hour frame and is sticking to it very well and is expected to break it upwards and it has already been broken
We have a bounce from a major support area in green at 0.1550
We have a downtrend on the RSI indicator that has been broken upwards which supports the rise
We have a trend to stabilize above the 100 moving average which supports the rise
Entry price 1.20
First target 1.36
Second target 1.50
Third target 1.66

THETAUSDTTHETA ~ 1W
#THETA Currently it is forming a descending pattern on the 1W Time frame.
If you still have Conviction on this coin,. You can buy into these support blocks in stages. with a short term target of 20%+

Theta Cup and Handle!!!Theta Cup and handle has formed. After a very strong wave 1, price has retraced 88% to the top of the Accumulation channel forming a Cup and Handle. Cup and handle formation has a 95% probability of bullish momentum. Target for this swing trade is 19 usd at the final 1.618 extention of wave 3. Theta is currently breaking out of a falling wedge that can be seen on a linear scale chart.
TLong

THETAUSDT 1DTheta ~ 1D
#Theta The need to get out of this downward channel.
A good decision for this Token, Buy it when it breaks through the resistance line of this descending pattern.

THETAUSDT - Great Long Term Buying LevelsBINANCE:THETAUSDT is has retraced in a bullish trend on weekly timeframe. I am expecting the bullish trend to continue and for price to find support to continue the bullish momentum! I am buying at current price with stop loss below major lows on weekly timeframe.

THETAUSDT 1DTHETA ~ 1D
#THETA Bullish will be in control again after successfully breaking through the resistance line of this pattern. Minimum target 10%+

#THETA/USDT
#THETA
The price has been moving in a downward channel since July
This descending channel was broken and the trend is now retested
Moving average 100 was also broken higher
Current price 1.012
The first goal is 1.368
The second goal is 1.63

Theta/USDTMy Simple Analysis for Theta Network
chart looks interesting
DYOR & NFA
Make Sure To make ur stop lost
Targets in chart
Good Luck everyone

THETHA I am watching for a move to the Upside! THETA Looks ready for another move as it is breaking on DAILY timeframe on stochastic. I am looking for 3 Targets, 1st one being more safe!
However, instead of going all in at the first entry, I will try to break my entries into few more!

#THETA/USDT#THETA
The price has been moving in a downward channel since the end of December on a 4-hour frame
Now we are about to break that channel higher
We have stable support below the falling channel
Entry price is 1.12
First goal 1.20
Second goal 1.28
Third goal 1.41

#THETA/USDT | Going Up#THETA
The price is moving in a downward channel on a 1-day frame, and the channel has been broken to the upside
We have a higher stability moving average of 100
We have a positive divergence on the RSI
The entry price is 1.14
The first goal is 1.20
Second goal 1.29
Third goal 1.413
