#TIA/USDT — a Major Decision Point at the Downtrend Line!#TIA
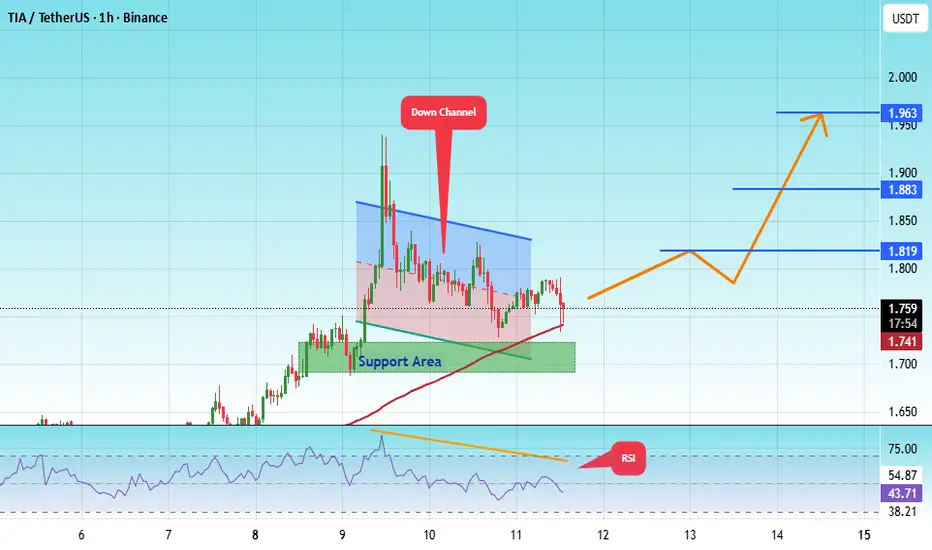
The price is moving within a descending channel on the 1-hour frame, adhering well to it, and is heading for a strong breakout and retest.
We have a bearish trend on the RSI indicator that is about to be broken and retested, which supports the upward breakout.
There is a major support area in green at 1.70, representing a strong support point.
For inquiries, please leave a comment.
We are in a consolidation trend above the 100 Moving Average.
Entry price: 1.75
First target: 1.82
Second target: 1.88
Third target: 1.96
Don't forget a simple matter: capital management.
When you reach the first target, save some money and then change your stop-loss order to an entry order.
For inquiries, please leave a comment.
Thank you.
TIAUSDC
TIA/USDT — a Major Decision Point at the Downtrend Line!🔎 Overview
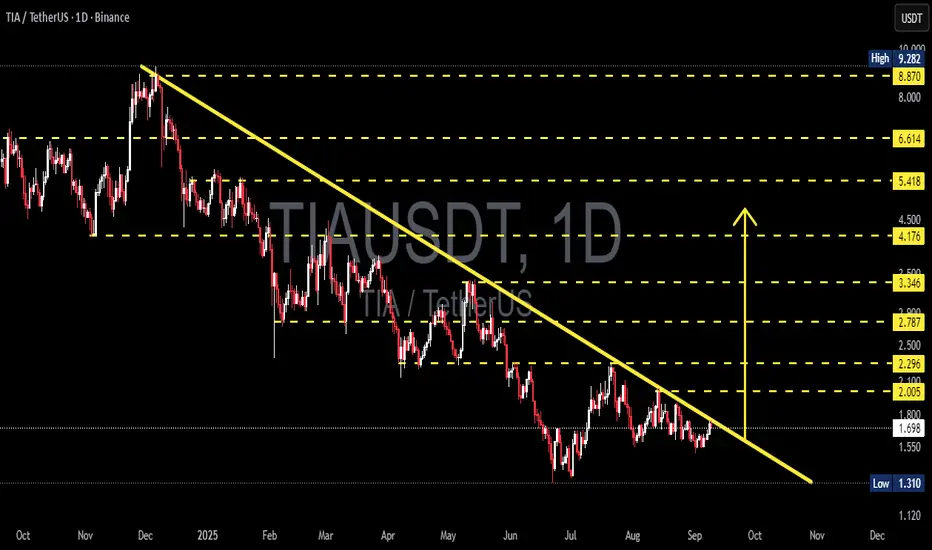
The daily chart (1D) of TIA/USDT shows that price action remains within a clear medium- to long-term downtrend. This is reflected by a series of lower highs & lower lows, all connected by the dominant descending yellow trendline.
Right now, the price is sitting at a critical crossroads — testing the trendline after months of trading below it. This is the moment that will determine whether TIA is ready to begin a bullish reversal or continue its extended bearish cycle.
---
🟢 Bullish Scenario
If TIA manages to break and close above the descending trendline with strong daily volume, the probability of a trend reversal increases significantly.
Step-by-step upside targets (based on chart levels):
2.005 USDT → first psychological resistance.
2.296 USDT → key supply zone, strong seller area.
2.787 USDT → next breakout confirmation zone.
3.346 USDT → mid-term bullish validation.
Breaking above 3.346 could open the path toward 4.176, 5.418, and higher.
Important note: a breakout without volume confirmation is often a false breakout.
---
🔴 Bearish Scenario
On the other hand, if the price fails to break the trendline and faces rejection, sellers will likely regain control.
Downside possibilities:
Price revisits 1.55 – 1.60 USDT zone.
Stronger sell pressure could drag it down to 1.310 USDT (critical support).
A breakdown below 1.310 USDT with heavy volume may trigger a capitulation wave, sending price into deeper lows.
In short: as long as price remains under the descending trendline, the overall trend stays bearish.
---
📐 Pattern & Structure
Main trend → Continuous downtrend since peak around 9.282 USDT.
Pattern → Descending trendline resistance that has rejected every rally attempt.
Critical support zone → 1.310 USDT (structural base).
Potential accumulation area → 1.3 – 1.7 USDT, seen from repeated bounces.
This structure resembles a descending channel with base-building. A breakout would shift momentum from bearish to neutral-bullish.
---
🎯 Conclusion
Bullish case → Trendline breakout + volume → upside targets at 2.0 → 2.3 → 2.7.
Bearish case → Rejection at trendline → downside toward 1.55 → 1.31.
Key focus: market’s reaction at the yellow trendline will dictate the next major move.
We are at a decision point: either TIA breaks out to start a recovery phase, or sellers take control again for another leg down.
---
#TIA #TIAUSDT #CryptoAnalysis #Altcoin #Breakout #Bearish #Bullish #ChartAnalysis #PriceAction #SwingTrade #TechnicalAnalysis #RiskManagement
TIA/USDT Testing Downtrend Line: Reversal or More Downside?Summary:
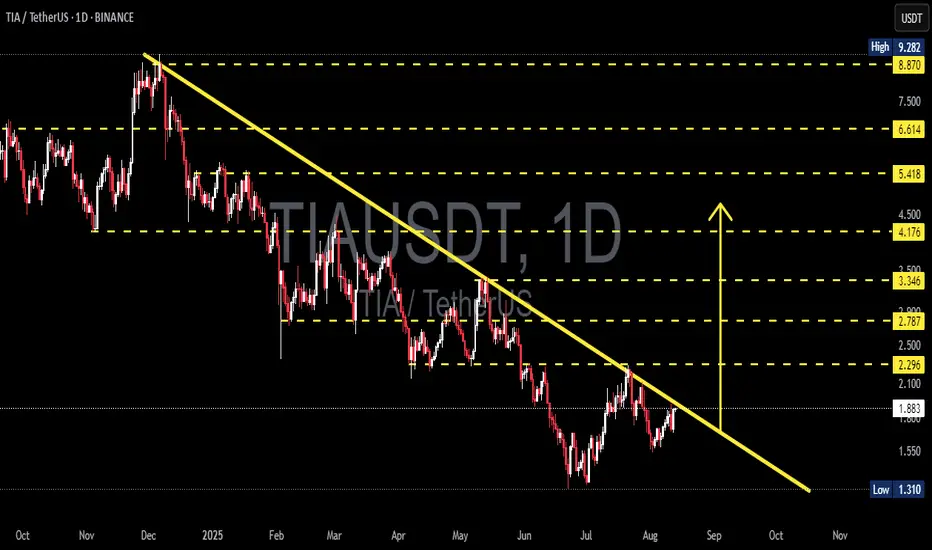
TIA price remains below the main descending trendline (yellow) drawn from the Dec–Jan peak. Price is currently hovering around $1.87–$2.00, right under the key $2.00–$2.10 resistance zone and the trendline. This is a decision zone: a breakout could trigger a reversal, while rejection could extend the bearish trend.
---
Key Structure Levels (from chart)
Support: $1.75–$1.80 (minor), $1.62, $1.31 (major low).
Resistance: $2.00–$2.10, $2.296, $2.787, $3.346, $4.176, $5.418, $6.614, $8.870 (near ATH $9.282)**.
---
Pattern & Context
Daily downtrend still dominant (series of lower highs) with the descending trendline acting as dynamic resistance.
Since mid-July, price has formed higher lows from $1.31 → gradually consolidating toward the trendline.
If $2.10 is treated as a “neckline” of a short-term accumulation, measured move = (2.10 − 1.31) ≈ $0.79 → conservative upside target ≈ $2.90 (aligns with $2.787 level).
---
Bullish Scenario
Trigger:
Daily close above the trendline + $2.10, ideally followed by a retest of $2.00–$2.10 as support.
Step targets:
$2.296 → $2.787 → $3.346 → $4.176.
Structure projection: ≈ $2.90 (around $2.787).
Invalidation / Risk:
Daily close back below $1.80 after breakout, or a failed breakout above $2.10 without follow-through.
---
Bearish Scenario
Trigger:
Strong rejection at the trendline / $2.00–$2.10 with a decisive bearish candle.
Downside targets:
$1.80 → $1.62 → $1.31 (key low).
Break below $1.31 opens deeper bearish territory ($1.20–$1.00 psychological zone).
Invalidation / Risk:
Daily close above $2.10 would cancel the short-term rejection setup.
---
Action Plan (not financial advice)
Bullish: Wait for confirmation above $2.10 with volume/follow-through; target $2.29 / $2.79 / $3.35; manage risk below retest level.
Bearish: Watch for pin bar/engulfing rejection at the trendline/$2.00–$2.10; target $1.80 / $1.62; invalidation if daily closes > $2.10.
#TIA #Celestia #TIAUSDT #CryptoTA #PriceAction #SupportResistance #Trendline #BreakoutWatch #DailyTimeframe #BearishVsBullish
TIAUSDT Bottoming Out?TIAUSDT Technical analysis update
TIAUSDT has been trading within the longest descending channel. The price has once again touched the channel support and also retested the November 2023 support level or bottom. A strong bounce from this zone is likely, and we could potentially see a 100–150% move from the current level.

TIA BULLISH MOVE AHEADTIA is currently trading above upper band of symmetrical triangle, another bullish wave is expected.
