Flag and pole confirmation in TITAN (NSE)? The price action for NSE:TITAN could hit 4500 INR. What do you think?
Titan

Titan Mining Receives $15 Mln to Accelerate U.S Graphite GrowthTitan Mining (TSX:TI) Receives US$15 Million Investment from a leading Institutional Investor to Accelerate U.S Graphite Development in New York.
The investment, together with the previously announced US$5.5 million U.S. EXIM Bank support, positions Titan to fast-track completion of the Kilbourne Graphite Feasibility Study in 2026 and advance the project toward construction.
Highlights
US$15 million strategic investment by way of private placement of Special Warrants from a leading institutional investor at US$2.25/C$3.10 per Special Warrant (the “Offering”).
Accelerates feasibility and development of one of the most advanced U.S. natural graphite projects
Technical Outlook
As of the time of writing, Titan Mining stock ( NSE:TI ) is up 12% in Friday's premarket trading with the RSI at 51 the stock is set to break out of a bullish flag pattern with eyes on the $10 resistant albeit market conditions.
About Titan Mining
Titan Mining Corporation, a natural resource company, acquires, explores, develops, produces, and extracts mineral properties. The company explores for zinc and graphite, as well as iron-oxide copper gold deposits. Its principal asset is the Empire State Mine project covering an area of approximately 80,000 acres located in the Balmat– Edwards mining district in northern New York.

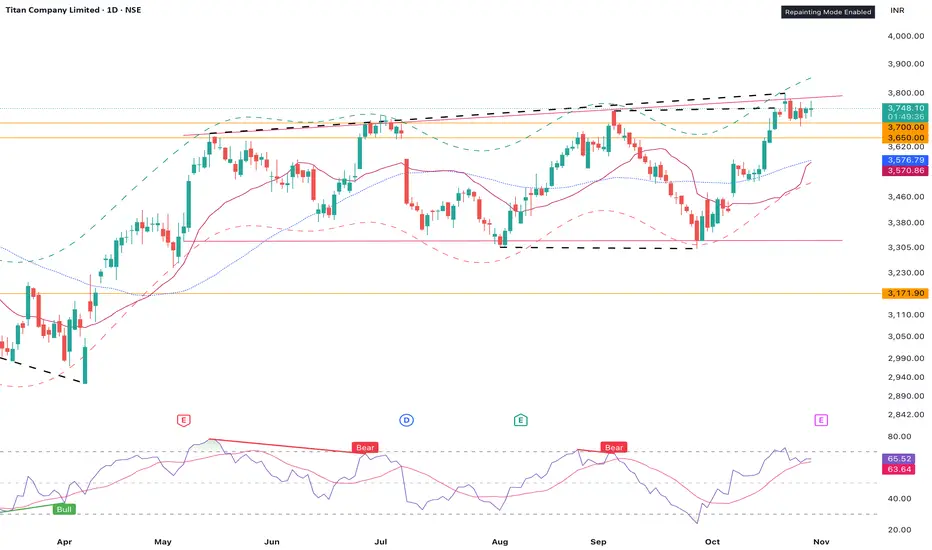
TITAN COMPANY LIMITED – SELL CALL (Equity/Futures)🔻 TITAN COMPANY LIMITED – SELL CALL (Equity/Futures)
Action: SELL
Entry Price: Around ₹3750 (Current Market Price)
Targets:
🎯 Target 1: ₹3700
🎯 Target 2: ₹3650
Stop Loss: ₹3785 (Closing Basis)
Analysis Insight:
Titan is facing strong resistance near ₹3750–₹3760 levels with visible profit-booking on higher time frames. Price structure indicates weakness, and momentum oscillators are turning bearish, suggesting a short-term correction.
Trading View:
• Suitable for short-term traders and intraday players.
• Risk–Reward setup remains attractive near CMP.
• Breakdown below ₹3735 can accelerate selling pressure toward 3700 and 3650.
📉 Trend: Bearish Bias
💡 Idea: “Shine fading from Titan — short the sparkle!” 💎
Titan Company Ltd.*Titan Company Ltd.*
P&F on Yearly Basis.
*W* on Monthly Basis.
Incremental RSI on comparative TFs.
Financially sound & Tata Group Co.
Sector gaining traction with Titan present in Eyewear, watches, Jewellery.
Trail SL with Upside.
Book Profit as per your Risk Appetite.
Do your own research. This is an opinion .
*Happy Investing* 🤓
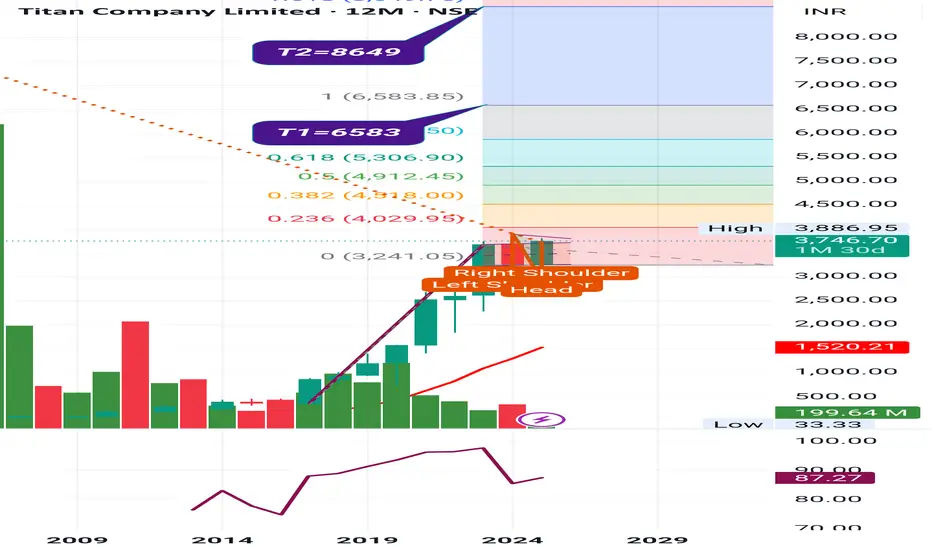
Titan – 2-Year Breakout LoadingStock has been in a time-based consolidation for around 2 years, and the pattern now suggests the correction phase is complete. This setup aligns with historical cycle behavior — after every long correction phase, a fresh uptrend usually begins.
Past major corrections:
Oct 2007 – Mar 2009: ~62% correction | 560 days (Global Financial Crisis)
Nov 2012 – Jan 2014: ~35% correction | 441 days
Jul 2019 – Mar 2020: ~47% correction | 315 days (COVID Crash)
Oct 2021 – Jun 2022: ~35% correction | 252 days
Jan 2024 – Oct 2025: ~25% correction | 616 days (Time-based correction completing)
Now the stock is showing a Head & Shoulder neckline breakout with strong momentum.
Last 4 consecutive bullish candles have closed with above-average volume, confirming renewed buying interest.
Entry: Enter with 50% capital Above 3800 (Neckline breakout confirmation)
Re-entry: Around 50% retracement of breakout move (if retest occurs)
Stop Loss: Below 3500
Target: 5600
Risk–Reward Ratio: 1: 5

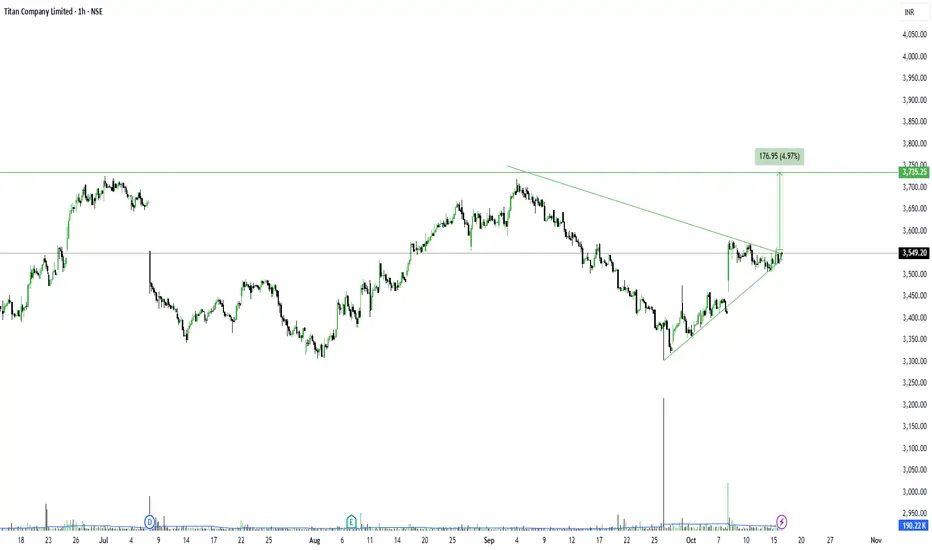
Titan – Symmetrical Triangle Breakout on the Hourly ChartTitan Company Ltd – Symmetrical Triangle Breakout on the Hourly Chart
NSE:TITAN
📈 Pattern & Setup:
Titan is forming a clean symmetrical triangle pattern on the hourly chart after a corrective phase. The price has started compressing within tighter highs and higher lows, indicating reduced volatility before a potential expansion.
Now, the stock is approaching the apex of the triangle near 3550 levels — a zone that often precedes a decisive breakout. A breakout above 3560–3570 could trigger a sharp rally, targeting previous swing highs around 3730+.
The structure suggests quiet accumulation with energy being stored for the next impulsive leg.
📝 Trade Plan:
✍Entry: Above 3570 (breakout confirmation)
🚩Stop-Loss: 3470 (below trendline support)
🎯Targets:
Target 1 → 3660
Target 2 → 3750 (5% potential move)
💡 Pyramiding Strategy:
1. Enter 60% position above 3570
2. Add 40% more above 3600 on volume expansion
3. Trail stop-loss to 3520 once price sustains above 3660
🧠 Logic Behind Selecting this Trade:
After a steady retracement from 3800+, Titan has found base support and is now compressing near breakout levels. The converging structure hints at a potential trend reversal on shorter timeframes, aligning with sectoral strength in consumer discretionary.
A breakout here could also mark a continuation of Titan’s long-term bullish trend from the weekly chart.
Keep Learning. Keep Earning.
Let’s grow together 📚🎯
🔴Disclaimer:
This analysis is for educational purposes only. Not a buy/sell recommendation. Please do your own research or consult your financial advisor before trading.
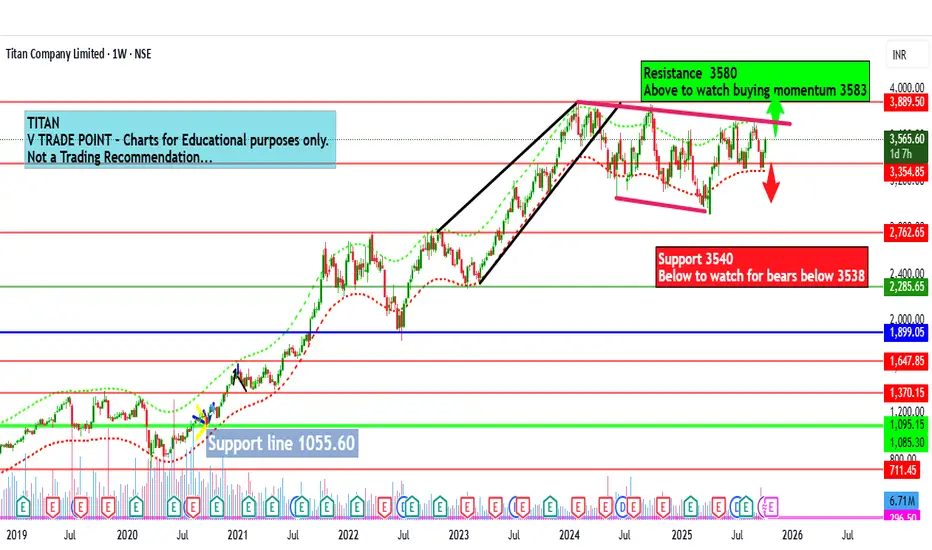
Titan Co. Ltd for 9th Oct #TITAN Titan Co. Ltd for 9th Oct #TITAN
Resistance 3580 Watching above 3583 for upside momentum.
Support area 3540 Below 3540 gnoring upside momentum for intraday
Watching below 3538 for downside movement...
Above 3580 gnoring downside move for intraday
Charts for Educational purposes only.
Please follow strict stop loss and risk reward if you follow the level.
Thanks,
V Trade Point
TITAN Reversing from Support ZoneNSE:TITAN is reversing from Support Zone. Below are the Targets and Stoploss. Once you achieved the 1st Target, if you are waiting for the next Targets, kindly use Trailing Stop Loss.
You can Buy at the current value.
!st Target - 3600
2nd Target - 3650
3rd Target - 3700
4th Target - 3800
Stop Loss - 3370

Titan Target ₹12,000 in 3 yearsTitan is silently building a generational setup.
3 powerful cups.
Smart money is loading.
💸 Buy ₹2,500–₹3,600
🎯 Target ₹12,000 in 3 years
One of the most reliable compounding stories in India.
#Titan #Nifty50 #BreakoutStocks #IndiaInvesting #LongTermWealth #TATAGroup

Technical Analysis Confirms Titan’s Bullish TrendTitan continues to attract the interest of both investors and the broader market, showcasing an impressive performance on stock exchanges and reporting strong financial results for the first nine months of 2024. With its stock price closing at €39.80, marking a 2.71% increase, the company confirms its robust momentum.
Technical Analysis: Steady Upward Momentum
The technical outlook of Titan’s stock highlights a solidifying upward trend. Exponential Moving Averages (EMAs) across various timeframes (20, 50, 100, and 200 days) support the positive perspective. The current stock price is notably above these averages (EMA 20: €36.44, EMA 50: €34.68, EMA 100: €33.15, EMA 200: €30.41), indicating strong buying activity.
The MACD indicator (12, 26, 9) reinforces this momentum, with a positive divergence between the MACD Line (1.582) and the Signal Line (1.151) and a Histogram value of 0.4312. Pivot Points also indicate the stock approaching the first resistance level (R1: €41.25), with strong potential to breach higher levels (R2: €43.80) if the upward momentum persists.
Key Moving Averages (EMAs)
The EMA indicators signal a clear upward trend:
EMA 20: €36.44
EMA 50: €34.68
EMA 100: €33.15
EMA 200: €30.41
The stock price remains substantially above all these averages, underscoring the strength of its long-term bullish trajectory.
MACD (12, 26, 9)
The MACD indicator confirms the upward dynamics:
MACD Line: 1.582
Signal Line: 1.151
Histogram: 0.4312
This positive divergence suggests sustained buyer interest.
Pivot Points and Key Levels
Pivot Point calculations outline support and resistance levels as follows:
R1: €41.25
R2: €43.80
S1: €34.25
S2: €29.80
The proximity of the price to the first resistance level (R1) signals a potential breakout towards higher levels if the upward momentum continues.
Titan Cement’s technical outlook reveals strong upward momentum, supported by moving averages and MACD. The stock’s position relative to Pivot Points suggests increased demand, potentially targeting the €41.25 level.
Strong 9-Month Financial Results
Titan Group reported positive results for the first nine months of 2024, with all geographic sectors contributing to growth. Sales increased by 4.9% to €1.985 billion, while EBITDA rose by 14.6%, reaching €455 million. Improved selling prices, enhanced operational efficiency, and reduced fuel costs boosted profit margins.
Notably, net profits rose by 20% to €238 million, while earnings per share stood at €3.19. S&P’s credit rating upgrade to “BB+” and the reduction of the net debt-to-EBITDA ratio to 1.1x underscore the company’s financial stability.
Strategic Initiatives and Growth
The Group continues to invest in strategic initiatives with a focus on sustainable growth. The acquisition of quarries and concrete plants enhances production capacity. Simultaneously, the advancement of the carbon capture project IFESTOS in Greece highlights the Group’s commitment to environmental sustainability.
The planned listing of Titan America’s operations on the New York Stock Exchange, expected in Q1 2025, is set to further boost the company’s expansion strategy in the U.S.
Outlook: Robust Performance Amid Challenges
Despite global economic challenges, including inflationary pressures and geopolitical uncertainties, Titan Group remains focused on growth. Demand for cement is expected to remain strong, especially in the U.S. and Europe, driven by public infrastructure projects and private investments.
In Greece, the economy shows resilience, with private sector investments and EU funds fueling growth. Meanwhile, Balkan countries and Egypt display mixed results, with long-term prospects depending on local economic stability.
Titan’s stock appears attractive for investors seeking stable returns in a high-uncertainty environment. With strong technical and fundamental indicators, a potential breakout above €41.25 could pave the way for further gains. The anticipated Wall Street listing and commitment to sustainable development enhance the stock’s long-term value.
Titan is poised to continue its growth trajectory, supported by strong performance, green development strategies, and international opportunities. With current dynamics, 2024 is shaping up to be a milestone year for the Group in both sales and profitability.

Titan Company Ltd. Technical AnalysisTitan has been trading within a consolidation phase recently, suggesting that buyers and sellers are in balance. Let’s look deeper at the technical levels and indicators that might guide us in the coming sessions:
1. Support and Resistance Zones:
Key Resistance Levels: The immediate resistance sits around ₹3,452.50 and further up at ₹3,557.05. These levels could act as barriers if the stock attempts a breakout from current levels.
Key Support Levels: Titan has notable support at ₹3,233.95. A drop below this could signal further downside pressure.
2. Trendline Analysis:
A descending trendline has been in place, connecting recent lower highs. If Titan breaks above this trendline with sustained volume, it could indicate a potential bullish reversal.
Meanwhile, a smaller, rising support line (forming a wedge pattern) offers a bullish signal if the price manages to hold above it in the short term.
3. MACD Indicator:
The MACD is currently in negative territory, indicating that the stock is under some bearish momentum. However, if we see a crossover above the signal line soon, it could hint at a possible bullish shift.
3. Volume Insights:
Volume has remained relatively stable, showing no major spikes that would suggest a strong trend continuation or reversal. A rise in volume, especially near support or resistance levels, may validate any potential breakout or breakdown.
Conclusion: Titan appears to be in a consolidation phase, with the possibility of a breakout in either direction. Traders might look for confirmation at key levels, such as a break above the ₹3,452.50 resistance for bullish momentum or a fall below ₹3,233.95 support for bearish sentiment. Monitoring the MACD signal line crossover and volume trends will be crucial to anticipate the next movement.

TITAN READY SHINING AGAIN... NSE:TITAN trade at 3680 level. you can watch for an upside move at 4200-4300.

Titan has formed a trendline breakoutTitan NSE:TITAN has formed a trendline breakout. Wave 3 is getting formed and you can buy above 3625 and Target would be 3960. This is a Very short target as Wave has already gine 1.618% and so we shoud expect only 1.00%

Titan Upside Breakout LevelsHi,
As per my analysis, here are NSE:TITAN upside breakout levels. Trend is still bullish.
Note: This is my personal analysis, only to learn stock market behavior. Kindly do your own analysis/research to take any trade.
Thanks


Blackberry 2024Ladies and Gentlemen,
Today, we stand on the brink of a remarkable transformation, driven by a company that has redefined itself with vision and resilience. That company is BlackBerry. Once known for its iconic smartphones, BlackBerry has boldly transitioned into new territories, emerging as a leader in cybersecurity, the Internet of Things (IoT), and advanced automotive technology. This journey is nothing short of inspiring, and it sets the stage for a bright and prosperous future.
BlackBerry’s story is one of relentless innovation and strategic reinvention. By shifting focus from hardware to software, BlackBerry has positioned itself in the heart of two booming industries: cybersecurity and IoT. In a world where cyber threats are ever-evolving, the demand for robust, intelligent security solutions has never been higher. BlackBerry, with its acquisition of Cylance, is at the forefront of this battle, delivering AI-driven cybersecurity solutions that protect organizations worldwide. This commitment to security not only safeguards data but also builds trust and confidence among customers and partners.
Moreover, BlackBerry’s QNX software is revolutionizing the automotive industry. As we move towards a future of connected and autonomous vehicles, QNX stands as a cornerstone of this technological evolution. From in-car systems to advanced driver-assistance systems, BlackBerry’s software ensures safety, reliability, and innovation on the roads. This isn't just about technology; it's about shaping the future of transportation and making our roads safer for everyone.
The Internet of Things represents a vast landscape of opportunities, and BlackBerry is ready to seize them. With the proliferation of IoT devices across various sectors—healthcare, industrial automation, smart cities—BlackBerry’s secure solutions are essential for managing and protecting these interconnected systems. The growth potential here is immense, and BlackBerry is uniquely positioned to lead the charge.
Financial strength and strategic acquisitions have further solidified BlackBerry’s foundation. These moves are not just about expanding capabilities; they are about investing in a future where BlackBerry continues to lead and innovate. Partnerships with technology giants like Amazon Web Services enhance our technological prowess and market reach, driving us forward into new frontiers.
As we look ahead, the future shines brightly for BlackBerry. The expanding cybersecurity market, the evolution of autonomous vehicles, the explosive growth of IoT, and the increasing need for enterprise security all point to a horizon filled with promise and potential. BlackBerry’s unwavering commitment to innovation and excellence ensures that we are not just keeping pace with change but driving it.
So, let us embrace this journey with confidence and determination. Let us celebrate BlackBerry’s resilience and vision. Together, we are part of a story that continues to inspire and innovate, a story that promises a brighter, safer, and more connected future. With BlackBerry leading the way, the possibilities are boundless, and the future is ours to shape.
Thank you.

TITAN--Trendline Support??I am sharing the important levels of Support and Resistance. These levels plays a crucial role in trading decisions, as they act as reliable markers of price movements.
------>>Support levels are price points where an asset tends to find buying interest, preventing it from falling further.
---->Resistance levels, on the other hand, are points where selling pressure typically prevents the asset from rising higher.
Take a look at these levels and trade accordingly. Recognizing and respecting these support and resistance levels can help traders make informed decisions and manage risk effectively. They serve as key reference points for technical analysis and are vital tools in successful trading strategies.
Trade safe...Thank you guys for your support

Titan long setup Titan long setup 3400 Target
Titan Bullish view
Educational purpose only do your own research
Titan Company shares are trading higher, extending gains after analysts at Macquarie raised their target price to ₹3300-3400

Time to be cautious on Titan (neutral)We are close to all time high for titan share and a big resistance is out there. I would book profit here and wait for the trend confirmation.
Two big probabilities:
1. Open and close above resistance means long.
2. Open and close below resistance is good chance to short.

Titan couldnt push higher as guessed. Expecting a pull back nowSince the titan couldnt go pass resistance this is my game plan. Pull back to 2500 ish and then long till 3100 ish. Come on bears short this to 2500. This is cancelled if there is a weekly close above the resistance as shown in the plan.

Should book profit in Titan
It seems current swing high has been touched and profit booking may start in Titan anytime now.

TITAN--Demand @2670 ??the stock is trending upwards.
the price is broken the previous resistance but not able to sustain above resistance, witness a strong fall observed.
we have a demand zone @2670 range, may price again move upwards from here.
one interesting fact is price after consolidation and moved strongly to above levels,
consolidation is observed at 2560 levels,which is a base.stronger than demand zone.
demand zone will take you to the resistance level only,but this will take above resistance.
Look at Consolidation + strong move.
keep track this instrument.
Use alerts @ every place, we cannot track each and every stock daily,
if you use alert system provided by trading view, which will alert you when the stock is near its demand or supply zone.
Use alert few points above demand or supply, you will aware when its coming towards your levels.

Titan Ascending triangle on weekly chartTitan weekly chart making ascending triangle chart pattern.
Closely observe for the buying opportunity
