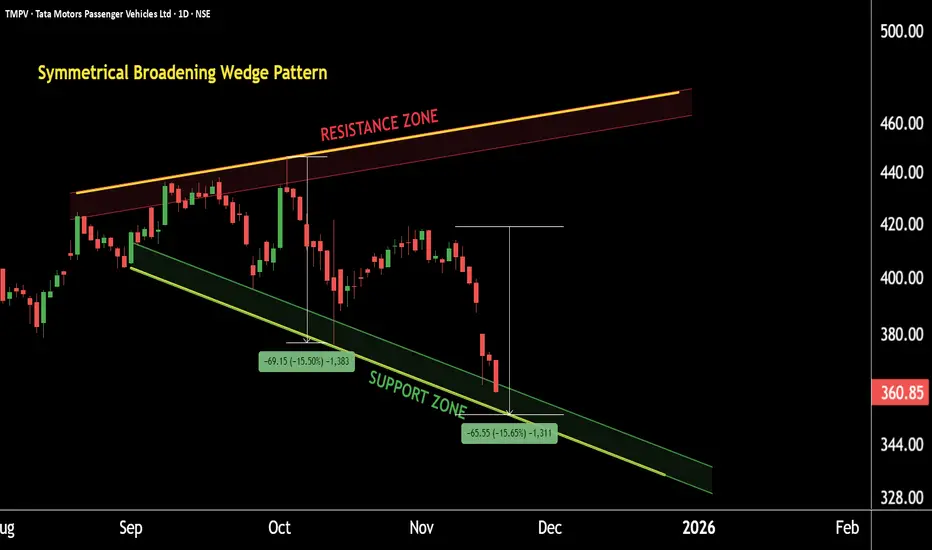
Tata Motors PV: A Big Pattern is Taking ShapeThis is the daily timeframe chart of TMPV.
TMPV is forming a Symmetrical Broadening Wedge Pattern with a key support zone near the 345–350 range.
The stock is also developing an AB=CD harmonic pattern within the broader structure, and the CD leg is completing near the same 350 support zone.
If the price continues to sustain above this support region, we may see higher levels like 400 and pattern price in TMPV in the coming sessions.
Thank you.
Tmpv
Tata Motors Passenger Vehicles Ltd – Long-Term ChartTata Motors Passenger Vehicles Ltd – Long-Term Elliott Wave Count
(Weekly Timeframe)
This chart represents a detailed Elliott Wave analysis of Tata Motors Passenger Vehicles Ltd (NSE: TATAMOTORS). The labeling attempts to capture the long-term market structure as accurately as possible.
The larger degree Wave I and II completed in 2008–2009.
The subsequent impulse, Wave III, is unfolding, and within it, we can observe multiple sub-waves:
Primary Wave ① and ② completed around 2020-21.
The current progression suggests that Primary Wave ③ is underway, with intermediate Waves i–ii–iii–iv–v in play.
A short-term correction (Wave 4) may still develop before the next impulsive leg toward the upper targets (₹950–₹1,200).
The chart also highlights alternating corrective structures (W–X–Y) and impulse sub-divisions for clarity.
This projection remains probabilistic, not predictive — the wave count will evolve as new market data emerges.
Disclaimer:
This analysis is purely educational and reflects a personal interpretation of Elliott Wave theory. It should not be considered financial advice or a recommendation to buy or sell any securities. Always conduct your own analysis or consult a qualified financial advisor before making investment decisions.

TMPV Breakout Loading | 17% Swing & 53% Intrinsic PotentialBias: 🔵 Bullish – breakout accumulation phase ( opportunity for anticipation )
Volatility Trigger: Nov 14th Results Day
Potential: 17% swing | 53% intrinsic upside
After months of sideways action, Tata Motors Passenger Vehicles Ltd (TATAMPV) is finally showing signs of strength.
The stock has formed a rounding bottom + triangle consolidation — a classic Cup & Handle structure — with the worst likely behind as we head into results on Nov 14th.
Q2 results on Nov 14 are expected to bring volatility, but the setup indicates accumulation and base formation are complete.
Margins may stabilise, and the PV segment strength could trigger a breakout before or immediately after results.
This structure suggests volatility = opportunity.
A strong close above ₹440 can open the gates for the next leg toward ₹490 and later ₹640+ as the full pattern plays out.
