TMUS – Trendline Break & Bounce From Support Zone🔍 Quick Summary
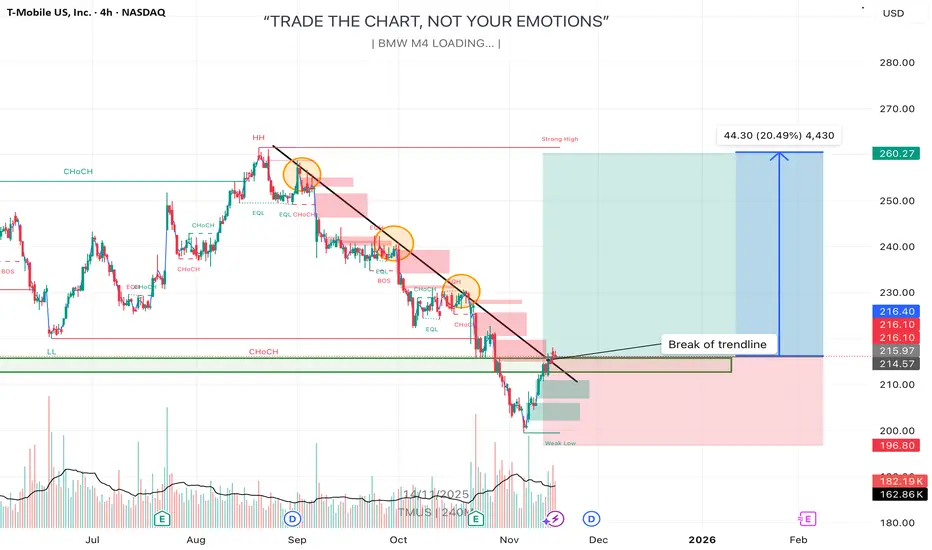
I’m seeing T‑Mobile US, Inc. (TMUS) break a long-term descending trendline and bounce off a key support region. The chart suggests a breakout scenario where I expect price to push toward the strong high near $260 (≈ +20% upside).
⸻
📊 Deep Analysis
• On the 4-hour timeframe, TMUS formed a clear down-sloping trendline that has held resistance on multiple touches (three orange circles). Each successive rejection appears weaker, indicating bearish momentum is fading.
• The price recently broke above the trendline and found support again in the green zone around $214-$216, which aligns with past structure (a strong demand region).
• The big projected move (~$44 to $260) corresponds to previous swing highs and structural liquidity. That aligns with typical “liquidity above weak high” mechanics.
• From a fundamental angle: T-Mobile has delivered strong results — in Q4 it beat earnings and subscriber growth expectations and raised guidance for 2025, which supports a bullish bias.  Also, it launched a new fibre service with a 5-year price lock and is expanding its satellite messaging offering, which strengthens future growth potential. 
• Since the chart shows a low risk (stop-loss) around the support zone and big reward potential toward the strong high, this setup meets favourable risk-reward criteria.
⸻
🎯 Trade Idea Scenario
Bullish Scenario
• Entry: Around ~$214–$216 support zone (preferably on confirmation of trendline retest or bullish price action)
• Target 1: ~$245–$250 (intermediate structure)
• Target 2: ~$260 (strong high liquidity zone)
• Stop-Loss / Invalidation: Below ~$202-$200 (if price breaks below support, setup invalidated)
Bearish Scenario
• If price fails to hold support and closes below ~$202-$200, risk opens toward ~$180 or lower support regions. In that case, bearish momentum resumes and the upside target no longer valid.
⸻
📌 What I’m Watching Next
• Candlestick reaction around the trendline retest: a strong bullish close would validate breakout.
• Volume: higher volume on breakout confirms strength; low volume may signal a fake.
• Support break below ~$202-$200 would cancel the bullish case and shift focus to downside.
• Fundamentals: any new update on fibre rollout, satellite service, or earnings could trigger acceleration.
⸻
⚠️ Disclaimer
This is my personal analysis and not financial advice. Please do your own research and manage your risk carefully. 📉📚
TMUS
TMUS T-Mobile US Options Ahead of EarningsIf you haven`t bought TMUS before the rally:
Now analyzing the options chain and the chart patterns of TMUS T-Mobile US prior to the earnings report this week,
I would consider purchasing the 227.5usd strike price Puts with
an expiration date of 2025-7-25,
for a premium of approximately $3.50.
If these options prove to be profitable prior to the earnings release, I would sell at least half of them.
Disclosure: I am part of Trade Nation's Influencer program and receive a monthly fee for using their TradingView charts in my analysis.

My View On Longing the $NASDAQ:TMUS NASDAQ:TMUS
always increase the 20% share equity at the best time, when it is cheap.

T-Mobile: Volatile!The TMUS stock has been volatile over the past two weeks, moving sharply in both directions. After a strong uptrend, it saw a pullback last Friday. We continue to view the price as entering the final stage of the green wave (5), which still holds significant expansion potential.

T-Mobile US (TMUS) Long Daily 14/10/24Asset Class: Stocks
Income Type: Daily
Symbol: TMUS
Trade Type: Long
Trends:
Short Term: Up
Long Term: UP
Set-Up Parameters:
Entry: 211.71
Stop: 210.78
TP1 211.71 (1:1)
TP2 213.58 (2:1)
TP3 214.5 (3:1)
TP4 215.45 (4:1)
Trade idea:
1H fresh demand zone formed by a drop-base-rally at the breakout level, with a Fair Value Gap above and a 1:4 risk-reward ratio. The stock has been in an uptrend channel since September 23.
!!Be aware of pending Economic Reports. If price is within 20 pips of proximal value at time of major impact report, then Confirmation entry.
Trade management:
**When price hits 1:1 or T1, consider moving stop to entry in case of pullback.
**Disclaimer**:
The trading strategies, ideas, and information shared are for educational and informational purposes only. They do not constitute financial advice or a recommendation to buy or sell any securities, currencies, or financial instruments. You should do your own research or consult with a licensed financial advisor before making any trading decisions. The author assumes no responsibility for any losses incurred from following these trading ideas.

TMUS T-Mobile US Options Ahead of EarningsIf you haven`t bought TMUS before the previous earnings:
Then analyzing the options chain and the chart patterns of TMUS T-Mobile US prior to the earnings report this week,
I would consider purchasing the 155usd strike price Puts with
an expiration date of 2024-11-15,
for a premium of approximately $4.30.
If these options prove to be profitable prior to the earnings release, I would sell at least half of them.

T-Mobile US: Downhill ⛷️TMUS was able to pull out of its green Target Zone ($168.80 - $161.69) on the downside. As we consider the high of the green wave (B) to be already established, we now expect a pronounced sell-off to below the support at $154.38. Our 37% probable alternative scenario, on the other hand, calls for a slightly different development. If the Zone is overshot, it will lead to a higher high of the green wave alt.(B).

T-Mobile US: Almost done 👀T-Mobile US in our dark green Target Zone, which extends between $161.69 and $168.80 on the chart. We assume that a bearish trend reversal will soon set in here and that the stock will then initially fall below the support level of $154.38. Primarily, we give the current wave (B) some room to make a new high in our Zone. The probability of our alternative scenario, which envisages an already deposited high with the wave alt(B), is 35%.

Controlled Large Lot Selling Pattern: TMUSTelecom Industry stocks hit the wall of Market Saturation some time ago. NASDAQ:TMUS has a pattern that indicates a controlled selling mode of larger lots before the earnings report. There has been more volume to the downside and money is flowing out of the stock while the price action develops a narrow sideways range. Risk for a breakout to the downside is high.

T-Mobile US: Destination reached 📍✅In line with our expectations, the TMUS share has since risen further and in the process also reached our dark green Target Zone (coordinates: $161.69 - $168.80). Basically, we now expect a bearish trend reversal in that price range after the top of wave (B) in dark green. This top could already be imminent, but we have to concede that the price can rise even higher in our Zone to this end and utilise the entire price range accordingly. Once the high is in, however, it should go lower again.

T-Mobile's Strategic Moves Breed New Opportunities for Investors
In the fast-paced world of telecommunications, T-Mobile ( NASDAQ:TMUS ) stands out as a company making strategic moves that position it for significant growth in 2024 and beyond. Recent developments, including the acquisition of midband spectrum and a stock buyback from SoftBank, have removed overhangs on the stock, making it an appealing choice for investors seeking long-term opportunities in the evolving 5G landscape.
Midband Spectrum Acquisition:
T-Mobile's recent legislative win, securing additional midband spectrum through the 5G Spectrum Authority Licensing Enforcement (SALE) Act, has set the stage for the company to enhance its 5G network across rural areas, covering approximately 81 million people. The ability to deploy this spectrum quickly and efficiently gives T-Mobile a competitive edge, and CEO Mike Sievert's statement about activating the spectrum for 50 million people within two days underscores the company's readiness to capitalize on this strategic move.
Stock Buyback and SoftBank Resolution:
A significant development for T-Mobile occurred on December 22, 2023, as its stock registered a weighted volume average above $150 per share for 45 days, triggering a stock transfer worth around $7.6 billion to SoftBank. This transaction not only boosted SoftBank's internal rate of return on its Sprint investment but also removed a longstanding overhang on T-Mobile's stock. As a result, the share price surged, signaling positive momentum and renewed investor confidence.
Financial Strength and Market Performance:
T-Mobile's financial resilience and market performance further contribute to its attractiveness as an investment option. The company reported third-quarter earnings that exceeded analyst estimates, with wireless subscriber additions surpassing expectations. In 2023, T-Mobile outperformed the S&P 500, gaining nearly 21%, showcasing its ability to weather market fluctuations and deliver value to shareholders.
Strategic Initiatives and 5G Spectrum Edge:
T-Mobile's commitment to maintaining its 5G spectrum edge is evident in its proactive approach to securing additional spectrum. The company's purchase of 5G airwaves from Comcast further solidifies its position in the evolving 5G landscape, opening up new avenues for growth.
Positive Outlook and Future Prospects:
The positive outlook for T-Mobile revolves around factors such as Sprint merger synergies, robust free cash flow growth, and expectations for a substantial share buyback. With the removal of the SoftBank-related overhang, T-Mobile's stock is poised for further appreciation, offering investors an opportunity to participate in the company's continued success.
Conclusion:
T-Mobile's recent strategic moves, including the acquisition of midband spectrum and the resolution of the SoftBank-related stock transfer, have positioned the company for a promising future.

T-Mobile: Already reached the summit? ⛰️The share price of T-Mobile has come very close to our dark green Target Zone (coordinates: $161.69 - $168.80) in the past weeks, but has turned around underneath it. In the context of an alternative count, it is now 35% likely that we have already seen the top with the wave alt.(B) in dark green, which would mean that we are now already seeing a sell-off to below the support at $142.84. Primarily, however, we assume that the course of the regular wave (B) in dark green will prevail and thus lead to the scheduled top in our Target Zone, which, by the way, potentially offers itself as a short opportunity.

Looking Bearish on TMUS.
As you can see here we are sitting on a support line I drew on the 1 hour chart. We have formed a double top on the daily chart. I am looking to either gap below this level or breakthrough, retest and buy puts on the 15-minute chart with high volume. The bottom green demand zone would be my profit target.

20% ROI potential on TMUST-Mobile US Inc. (TMUS) presently breaking through key resistance.
A weekly settlement above this resistance would place (TMUS) into a buy-signal with potential gains of 5% - 10% over the next 1 - 2 months for short-term traders, and gains of 20% expected over the next 6 - 8 months for long-term investors.
Inversely, failing to close above this resistance level on a weekly basis keeps (TMUS) susceptible to falling back to key support.

T-MOBILE 1st Bullish Break-out signalT-Mobile US (TMUS) broke today above the Lower Highs trend-line of April, the long-term Resistance and will most likely close the first 1D candle above the 1D MA50 (blue trend-line) since August 16. This is the first bullish break-out signal of this pattern. The second will be if the price breaks above the 1D MA200 (orange trend-line) / 1W MA50 (red trend-line) which are trading on the exact same spot.
If we get a 1D candle close above them, we will buy the first break of Resistance 1 (142.85) and target 150.00, which will be a +14.33% rise from the bottom, same as the July 25 peak.
-------------------------------------------------------------------------------
** Please LIKE 👍, FOLLOW ✅, SHARE 🙌 and COMMENT ✍ if you enjoy this idea! Also share your ideas and charts in the comments section below! **
-------------------------------------------------------------------------------
💸💸💸💸💸💸
👇 👇 👇 👇 👇 👇

Can VZ reverse with earnings coming up?VZ on the 2H chart has been in a trend down since July 5 and the fall is accelerating
in the past three trading days. Earnings are a week away. The dual time frame RSI
indicator shows the weakness with RS in the oversold and undervalued zone while
the zero-lag MACD shows hard bearish momentum. Relative selling volumes are
about 3X the mean. Overall considering that price is now three standard deviations
below the mean anchored VWAPs set in March and April I believe that price is now
at or near the bottom. Accordingly I will watch for signs of a reversal on a 30-60
minute time frame from which to consider a long entry. the upcoming earnings
could increase volatility and potential profits if VZW can rally some trader interest.

T-Mobile US: Answer the Call! 📞Slowly but surely, T-Mobile US is answering the call of our dark green target zone between $161.69 and $168.80, heading further upwards. To finally pick up the receiver and complete wave B in dark green, the share should develop a three part upwards movement consisting of waves a, b and c in magenta, which should carry it above the resistance at $154.38. However, there is a 33% chance that T-Mobile US could have already hung up wave alt.B in dark green and thus drop below the support at $124.92.

T-MOBILE hit the 1W MA100 after 7 months. Buy. T-Mobile (TMUS) has been trading within a long-term Channel Down pattern and yesterday started rebounding after hitting the 1W MA100 (red trend-line) for the first time since October 13 2022. That fractal is very similar with the current sequence. This is a buy call and with it we are targeting the 1D MA50 (blue trend-line) at 143.50.
Attention is needed as we are about to see the first 1D Death Cross since October 11 2021. As a result we will only turn bullish on T-Mobile again on the long-term if the price breaks above Resistance 1 (152.25).
-------------------------------------------------------------------------------
** Please LIKE 👍, FOLLOW ✅, SHARE 🙌 and COMMENT ✍ if you enjoy this idea! Also share your ideas and charts in the comments section below! **
-------------------------------------------------------------------------------
💸💸💸💸💸💸
👇 👇 👇 👇 👇 👇

What do we do with this one? $TMUSDecent RR, if stopped out, re entry at the top of the range, in the trade for the last two months so still patiently waiting for this one.

NASDAQ: TMUS - BREAKOUT - MOMENTUMLast week T-MOBILE stock produced a breakout setup and this week retested entry point. Let’s see if this system I put together works on stocks as well!

Trade Idea: TMUS (T-mobile) TMUS is looking very topping heavy on the larger term time frame.
This would align with our thesis that we believe communication and aspects of the tech market are going to see some capital rotation.
If this weekly topping formation is triggered in this chart we will have a high probability trade setup.
Knowing the trend to trade is key.

TMUS- Possible head and shouldersTMUS (T-Mobile US)- a setting head and shoulders. Entry point is a box. Target for 10% gain.

TMUS Earnings WeekOn Wednesday, TMUS reports its quarterly earnings. The last earnings report saw a gap on the surprise earnings, but overall the price did not do much. TMUS's price has remained rangebound between the high and low of the previous earnings week. Looking at the earnings estimate, analysts are predicting an increase in earnings from the prior quarter and the same quarter last year, which could provide the catalyst needed to break out of this range.
TMUS managed to post steady gains over 2022 when the SP500 and the Communications Sector (XLC), the sector in which TMUS is a member, declined. This upward progress shows underlying fundamental strength. The price action leveling off this last quarter could mean a few different things. The response to this earnings report could show it was just price action taking a breath.
Stepping back from the TMUS chart, the SPY marked a significant milestone last week by closing above its resistance line that formed during 2022. We also see that XLC is one of the top-performing sectors YTD.
A surprise on earnings coupled with a break of the previous earnings week high could mark the beginning of a new strong uptrend for TMUS.
