TOKENUSDT — This the Start of Accumulation or Anothe Breakdown?Full Analysis
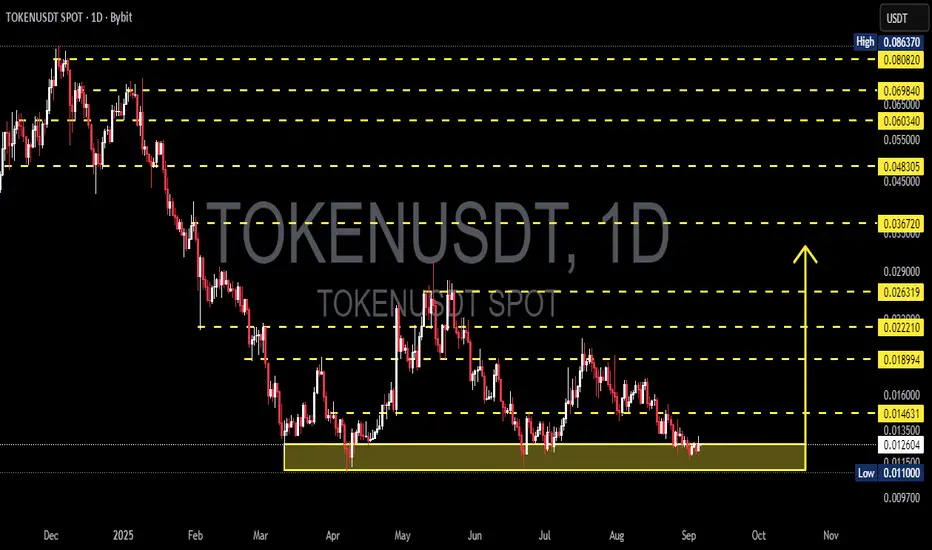
TOKENUSDT is now trading at a decisive area: the major support zone between 0.0110 – 0.0146 USDT (highlighted in yellow). This zone has been tested multiple times since March 2025, making it a crucial demand area. How price reacts here will define the next big move: either a strong rebound or a deep continuation of the downtrend.
Market Structure
Primary trend: still bearish since the peak near 0.086 USDT (early 2025).
Lower highs sequence: sellers remain in control.
Multi-touch support: shows strong tug-of-war between buyers and sellers.
If this support holds, a potential triple bottom / accumulation base could form. But if it breaks, expect further downside.
---
Bullish Scenario 🟢
Confirmation: Daily close above 0.01463 USDT with strong volume.
Potential pattern: Base formation → higher low structure.
Upside targets:
Target 1: 0.01899 USDT (first resistance).
Target 2: 0.02221 USDT (minor supply zone).
Target 3: 0.02632 – 0.03672 USDT (major resistance cluster).
If momentum strengthens across the crypto market, price could extend toward 0.0483 – 0.0603 USDT.
Bullish takeaway: A rebound from this support may mark the start of a medium-term trend reversal.
---
Bearish Scenario 🔴
Confirmation: Daily close below 0.01100 USDT signals breakdown.
Downside targets:
Initial target: 0.00970 USDT (nearest historical low).
Extended target: below 0.009 if sellers dominate.
Bearish takeaway: Losing this critical support could trigger further capitulation and push the market to fresh lows.
---
Key Notes for Traders
1. Volume matters → Breakouts or breakdowns without strong volume often fail.
2. Wait for daily close → Avoid rushing entries based on intraday wicks.
3. Risk management first → Set clear stop loss (below support for longs, above resistance for shorts).
4. Multi-timeframe approach → Use daily for trend, H4/H1 for entry timing.
5. Watch BTC correlation → Altcoins often mirror Bitcoin’s momentum.
---
“TOKENUSDT is at a crossroads! After a prolonged downtrend from early 2025 highs, price is consolidating at the key support 0.0110 – 0.0146 USDT. This is the make-or-break zone: will buyers step in and spark a rebound toward 0.01899 – 0.02221 and beyond? Or will sellers break it down and drag price to 0.00970 USDT?
Volume and daily close confirmation will decide the next big move. Stay disciplined with stop losses and seize the opportunity—because the biggest moves often start at critical levels like this.”
---
#TOKENUSDT #CryptoAnalysis #Altcoin #SupportResistance #TechnicalAnalysis #BullishScenario #BearishScenario #CryptoTrading #SwingTrading
Tokenusd
TOKENFI #TOKEN Trade alertPlay the bounce for a short term target trades from this clear support block with the deviation low already in place.
For long term believers good area to DCA to bring down your average cost.

TOKENUSDT 1D AnalysisTOKEN ~ 1D Analysis
#TOKEN This is the lowest support for now. Buy gradually from here with a short term target of at least 15%+ from this support.

TOKENUSDT 1DTOKEN ~ 1D Analysis
#TOKEN Buy after successfully penetrating this resistant line with a short -term target of at least 10%+ from here.

TOKENUSDT 2DTOKEN ~ 2D Analysis
#TOKEN Buy gradually from here if you still have a Conviction on this coin with a short -term target of at least 15%+.

TOKENUSDT 3DTOKEN ~ 3D Analysis
#TOKEN This is the lowest support for now, Maybe you can consider this support to start buying back from here.

TOKENUSDT 2DTOKEN ~ 2D
#TOKEN In 2D Time Frame, Still maintaining this support block,. Buy from here if you still have Conviction on this coin with a minimum target of 20%+

TOKENUSDT 2DTOKEN ~ 2D
#TOKEN If you still have Conviction on this coin,. This support block would be a good buying spot for now. buy in stages with a minimum target of 20%++

$TOKEN another project from RWA!TOKEN has a good set of investors and market makers who won't miss the opportunity to make money anytime soon. From a technical point of view we expect an upward reaction after 5 Elliot waves! This is confirmed by the consolidation above the 50 EMA. The target for fixation is 1.618 Fibonacci level.
Best regards, Horban Brothers!

TOKENUSDTTOKEN ~ 2D
#TOKEN This coin is in the LSE:RWA sector. Currently it continues to move in this descending pattern. However, selling pressure has weakened.if you have Conviction on the coin,. This support block is a very good place to start buying again. with a minimum target of 15%++

Will #TOKEN Follow Bitcoin's Relief Rally or Not? Key Levels Yello! Are we about to witness a major bullish rally for #TOKENUSDT, or is a sharp reversal lurking around? Let's dive into the detailed analysis of #TokenFi:
💎#TOKENUSDT is currently showing promising signs of a bullish continuation, holding firm at a critical support level around $0.0455. We've been closely monitoring #TokenFi's progress within a Descending Broadening Wedge pattern, and it's now attempting to break above the descending resistance line.
💎If $TOKEN maintains strength at this level, we could be on the brink of a significant rally, echoing past bullish trends. A clean breakout above the key resistance zone of $0.068-$0.081 could open the gates for a run toward higher resistance levels and potentially even new highs.
💎But here's the catch: caution is essential. If momentum weakens around this critical support, we could see a pullback to the lower demand area near $0.036.
💎A daily close below this demand area would invalidate our bullish outlook and could indicate further declines ahead.
Stay vigilant, Paradisers, and keep a close eye on #TOKEN's price action.
MyCryptoParadise
iFeel the success🌴

TOKEN looks bearishAccording to the structure of TOKEN, it seems that it is completing a bearish triangle.
We are now in the last wave of this triangle (wave E).
If it reaches the supply range, we will look for sell/short positions.
The targets are clear on the chart.
Closing a daily candle above the invalidation level will violate the analysis
For risk management, please don't forget stop loss and capital management
Comment if you have any questions
Thank You

TOKEN buy setupAccording to the bullish iCH on the chart, according to the price, it is trying to create an internal pullback (upwards).
We are looking for buy/long positions on the demand range
Closing a daily candle below the invalidation level will violate the analysis.
Note that the financial market is risky, so:
Do not enter any position without confirmation and trigger.
Do not enter a position without setting a stop.
Do not enter a position without capital management.
When we reach the first TP, save some profit and try to move the stop continuously in the direction of your profit.
If you have any comments please post them, comments will help us improve our performance
Thanks

TOKEN ANALYSISThe price seems to be inside a large diamond diametrically.
Now, according to price, TOKEN intends to complete the F wave.
After the completion of the F wave, it can drop towards the lower ranges.
Our general view on the TOKEN symbol is as follows.
Closing a daily candle above the invalidation level will violate the analysis.
For risk management, please don't forget stop loss and capital management
Comment if you have any questions
Thank You

TOKEN, a FLOKI coin project. THE RISE will be in sync!This coin is another gem to look out for if you're a fan of the FLOKI ecosystem. The synchronized rise of this alongside it's mother coin is a testament of the future growth prospect of this one. If you're looking at MCAP numbers, you know this one has the multiple 'bagger' potential.
On our technicals, It is currently concluding its correction phase and about to enter a shift. This is preppin another attempt to the upside soon to follow it's parent exponential growth.
It's hard to miss this one with the potential alone and the fundamentals around it.
Spotted at 0.080
TAYOR.
------------------
TokenFi launched on Oct 27, available on Uniswap and PancakeSwap, a multichain token on Ethereum and BSC.
Floki community approved TokenFi, resulting in a surge of $100M+ in market capitalization.
TokenFi aims to target the global asset tokenization market with a launch on five networks.
Token supply is 10 billion TOKEN, split evenly between Ethereum and BNB Chain; strategies are in place to counter sniping activities.
TokenFi Staking Program offers substantial rewards for participants staking FLOKI tokens, with flexible claiming options and penalty fees for early unstaking.

TOKEN UPDATE (6H)This analysis is an update of the analysis that you can see at the bottom of this page, in the related analysis section
With the buying pressure created in altcoins, our diametric wave D has developed.
Wave a-D and wave b consists of D and now it looks like we are now in wave c-D.
We specified the targets on the chart. It can continue to climb by maintaining the green range.

TOKEN ANALYSIS (4H)By checking the TOKEN waves, it seems that we have a diametric on the chart that we are now in the middle of the E wave.
We are expected to move from the red supply box to the targets.
We have specified the targets on the chart and
We also specified the invalidation level. Closing a daily candle above this level will violate the analysis
For risk management, please don't forget stop loss and capital management
When we reach the first target, save some profit and then change the stop to entry
Comment if you have any questions
Thank You

TOKENFI LOOKS INTERESTING! 50% profit?TOKENUSDT, a nice pullback between 0.036 - 0.039 will take me into play!
Entry: 0.03885
TP1: 0.045
TP2: 0.058
SL: 0.033

Simple Ripple-Another LookHello all,
Down and Dirty!
1) 1.15 or 1.155ish is important because a close above that level is good for all tech analysis and marks bullish run.
2) XRP is trying hard to get there. BTC is breaking to the upside....pretty hard but spillover has not happened yet.
3) If BTC takes a correction that will correlate to XRP and A pullback to the 96-1.06 range.
4) If XRP breaks above 1.15 then expect to move to the higher fib at 1.26. There could be resistance at 1.19 for structure but I would expect a continuation.
5) Earlier in the week, i mentioned a 1.40 target and that is still in play.
6) XRP is forming Higher lows-that is a good sign!
7) Volume is light right now but Its late Friday in the US and Early Sat everywhere else. Especially-All of Asia-Happy New Year!!!
8) The MACD is slowly heading to the upside. A crossover will signal a buy.
WATCH 1.15ish A close above that is bullish!!
