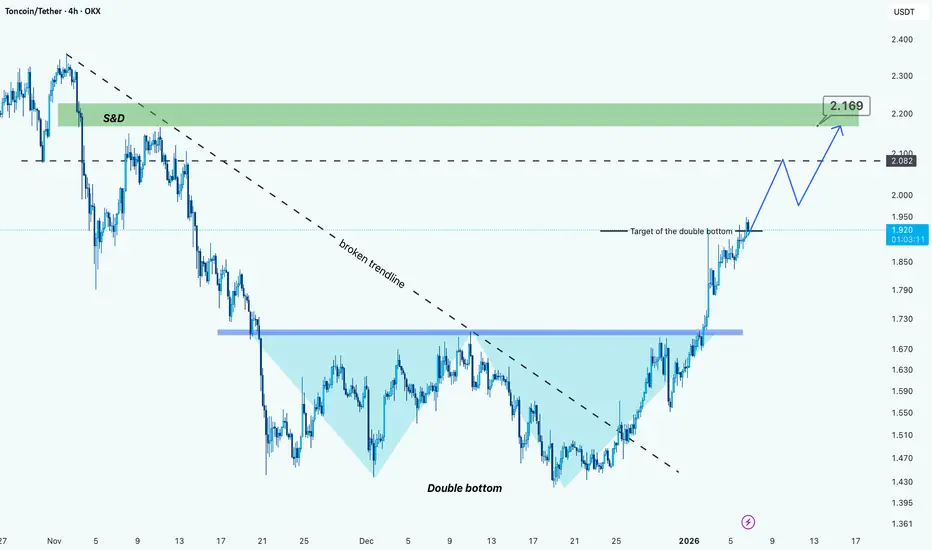
TON/USDT: Double Bottom BreakoutHi
TON formed a clear double bottom, signaling a potential trend reversal.
Price has now broken above the descending trendline, confirming a shift in market structure.
The former resistance zone is acting as support, which strengthens the bullish case. As long as price holds above this level, upside continuation remains likely.
Targets:
• 1.08 → internal resistance
• 2.16 → Major supply & demand zone
A short consolidation or pullback is possible, but the overall structure favors bullish continuation.
TON
TON/USDT | TON Coin Rallying Over 20%, Bullish Momentum ContinueCRYPTOCAP:TON has surged from $1.65 to $1.95, delivering over 20% return since our last analysis. Price has held above the key $1.58 level and is now pushing aggressively higher, confirming short-term bullish momentum.
If strength continues, next bullish targets to watch are $2.07, $2.22, $2.38, and $2.60.
Please support me with your likes and comments to motivate me to share more analysis with you and share your opinion about the possible trend of this chart with me !
Best Regards , Arman Shaban

#TON/USDT : Trendline Break & Double Bottom#TON
The price is moving in a descending channel on the 1-hour timeframe. It has reached the lower boundary and is heading towards breaking above it, with a retest of the upper boundary expected.
We have a downtrend on the RSI indicator, which has reached near the lower boundary, and an upward rebound is expected.
There is a key support zone in green at 1.53. The price has bounced from this zone multiple times and is expected to bounce again.
We have a trend towards stability above the 100-period moving average, as we are moving close to it, which supports the upward movement.
Entry price: 1.60
First target: 1.64
Second target: 1.69
Third target: 1.755
Stop loss: Below the support zone in green.
Don't forget a simple thing: capital management.
For inquiries, please leave a comment.
Thank you.

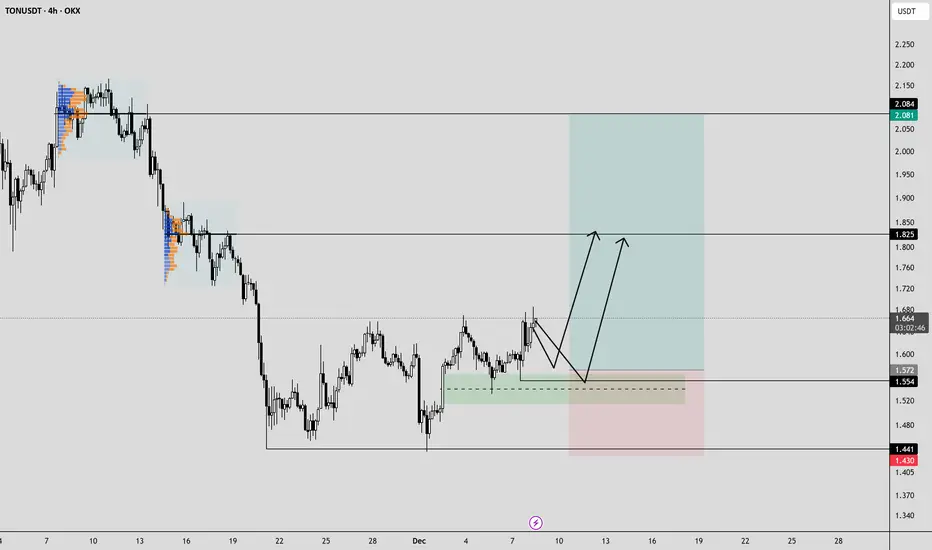
TON: an idea in a day.We have a local long idea for TON up to the upper limit of the range.
We only enter after confirmation and a stop in the long zones. If we fall below that limit, we simply skip it.
BINANCE:TONUSDT.P

TradeCityPro | TON Range Tightens, Breakout Probability Rising👋 Welcome to TradeCity Pro!
In this analysis, I want to review the TON coin for you. One of the popular crypto projects that belongs to the Telegram platform, and with a market cap of $4 billion, it is ranked 26th on CoinMarketCap.
⏳ 4-hour timeframe
This coin has formed a range box on the 4-hour timeframe, and like most altcoins, it is currently ranging.
⚡️ The bottom of the range box is at 1.45 and the top of the box is at 1.68, and for several days now, volume inside this box has been increasing.
📊 This increase in volume indicates the presence of traders in this coin, and if volume continues to increase, the probability of a range breakout will rise.
✔️ Currently, most of the volume is buy volume, and the probability of breaking the 1.681 resistance has increased.
⭐ The higher low that the price has formed is at 1.562, and as long as the price stays above this level, we can expect that if 1.681 breaks, an upward bullish move will start.
🎲 However, if the price gets rejected from 1.681 and moves downward, breaking 1.562, then with the break of 1.45, we can open a short position.
📝 Final Thoughts
Stay calm, trade wisely, and let's capture the market's best opportunities!
This analysis reflects our opinions and is not financial advice.
Share your thoughts in the comments, and don’t forget to share this analysis with your friends! ❤️

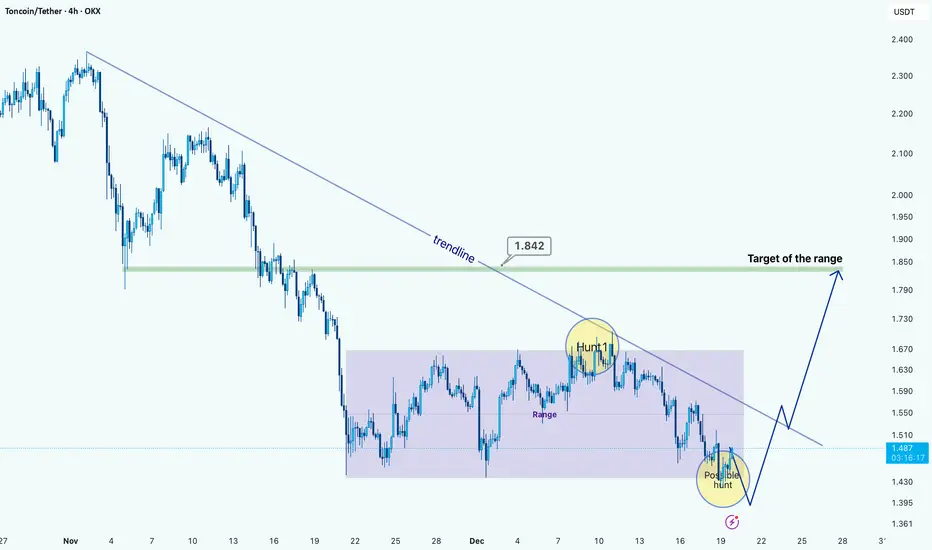
TON/USDT: Range Structure Within a Broader DowntrendHi!
TON is still trading under a well-defined descending trendline, confirming that the higher-timeframe structure remains bearish. After the impulsive sell-off, the price transitioned into a clear consolidation range, highlighted on the chart. This range shows multiple reactions at both extremes, validating it as an accumulation/distribution zone rather than random price action.
A notable liquidity hunt occurred near the upper boundary of the range, where price briefly swept highs and was immediately rejected, aligning with the descending trendline and reinforcing it as dynamic resistance. Currently, price is trading near the lower boundary of the range, where another potential liquidity sweep may occur before a directional move.
Bullish scenario: A downside sweep below the range lows, followed by strong acceptance back inside the range, could trigger a reversal toward the range high near 1.84, which also aligns with the descending trendline and acts as a logical target.
Bearish scenario: Failure to reclaim the range after a breakdown would confirm continuation of the downtrend, exposing lower supports.
TONUSD: Wave Structure in Search of Growth ImpulseTONUSD: Wave Structure in Search of Growth Impulse
TONUSD Wave Overview (D1 and H4)
As a trader who has been practicing wave analysis for over ten years, I note that the current picture for TONUSD shows the end of an extended corrective phase and the potential for a new movement.
D1 Chart: The global structure indicates that the market is gradually breaking out of its sideways range. The wave formation looks like the end of a correction, laying the foundation for the next impulse.
H4 Chart: Local dynamics confirm the first signs of an impulse. Key entry points are forming here, which could mark the beginning of a larger wave.
Main Scenario
After the completion of the corrective phase, a downward impulse sequence is expected to develop. This movement may be accompanied by increased seller activity and a shift in focus to the downside.
Alternative Scenario
If the price holds above local peaks and forms a stable upward impulse structure, the focus will shift to continued growth. In this case, the correction will be considered incomplete, and TONUSD may experience an additional rebound.
Trading Idea
Conservative approach: wait for confirmation of a breakout of key levels and enter with the trend.
Aggressive approach: use local impulses on H4 for earlier entries, but with tight stops.
In both cases, it is important to maintain strict risk management and adjust the plan as new impulses emerge.
Results
TONUSD is at a crossroads between the end of the correction and the beginning of a new impulse. The wave structure on D1 and H4 provides clear guidelines for action: watch for confirmation of the scenario and act with discipline.

TON GOOD FUTURE ONE DAYHi traders!
Seems to be that TON is building huge RUNNING FLAT
When it will be completed IMO we gonna see new cycle development
Stay tuned

TON/USDT — Market StructurePrice has broken down and consolidated below the global channel.
TON remains in a steady downtrend with weak relief bounces.
At the same time, early signs of a potential reversal are emerging:
— a double bottom has formed,
— a bullish divergence is present,
— weekly RSI is at historical oversold levels.
Long entries can be considered at current levels with a stop-loss below the low.
🎯 Primary target: the deviation level and a retest of the channel from below.
Higher targets should be considered only after price reclaims and holds back inside the channel.

#TON/USDT : Trendline Break & Double Bottom#TON
The price is moving in a descending channel on the 1-hour timeframe. It has reached the lower boundary and is heading towards a breakout, with a retest of the upper boundary expected.
We are seeing a bearish trend in the Relative Strength Index (RSI), which has reached near the lower boundary, and an upward bounce is expected.
There is a key support zone in green at 1.39, and the price has bounced from this level several times. Another bounce is expected.
We are seeing a trend towards stabilizing above the 100-period moving average, which we are approaching, supporting the upward trend.
Entry Price: 1.47
First Target: 1.48
Second Target: 1.52
Third Target: 1.57
Remember a simple principle: Money Management.
Place your stop-loss order below the green support zone.
For any questions, please leave a comment.
Thank you.

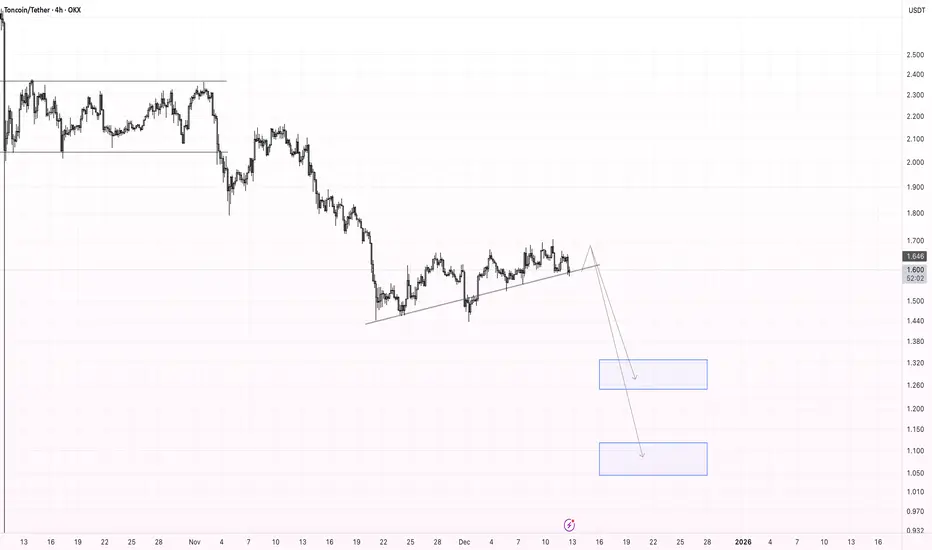
TON Correction Scenario: $1.33 → $1.10 TargetsPrice is breaking below the local ascending trendline, signalling a potential shift in short-term momentum. If the breakdown holds, I expect a continuation to the downside toward the next support zones. My targets are $1.33 as the first demand area and $1.10 as the secondary, deeper target.
TON - Long idea.The TON looks pretty long. The structure is good. I expect another test near the local low. Ideally, we should break through the low and rise!
I've sketched out a rough plan and set up alerts. I'll be watching!
TON Sits at a Critical Turning PointTON continues to trade inside a broad descending structure, but price is now pressing against a key trendline that has rejected every rally for weeks. This compression is creating a decision point.
A zone of demand has formed just beneath price, aligning with the mid-range of the falling wedge. This region has acted as support multiple times, showing that buyers are still defending. At the same time, the upper trendline is steadily guiding price lower and compressing volatility.
If the market holds above this support range and reclaims the short term structure, the next wave of expansion can begin. A clean breakout above the descending trendline would open the path toward the previous imbalance levels and the higher value zones above.
However, a failure to maintain this support may trigger one more downward leg into the lower boundary of the channel before any renewed attempt at recovery.
TON is entering a phase where price will reveal the next directional move. Patience is important as the structure prepares for expansion.

Nothing !!!As you can see, the price is forming two bullish patterns on the 4h timeframe, If my view is correct, TON will rise to $1.9
And if this pattern is correct and breaks, higher targets are possible.

TON : SELL LIMIT
Hello friends
considering the downtrend we are in, the power of sellers is quite clear and it is logical that we also move to the strong side, and in this downtrend, any price increase can be a selling opportunity.
So now, considering the buyers' support of the support area identified with Fibonacci, we need to see whether the sellers will enter again in the identified resistance area or not?
If the buyers weaken again in the resistance area, the price can fall to the specified targets.
This analysis is purely technically reviewed and is not a buy or sell recommendation, so do not act emotionally and observe risk and capital management.
*Trade safely with us*

FireHoseReel | TON’s Last Support of Defense🔥 Welcome to FireHoseReel !
Let’s dive into the analysis of Telegram Coin (TON).
👀 TONUSDT 4H Overview
TON has reached a very critical support zone. A clean break below this level could activate our next short trigger and lead to a deeper drop than many expect.
📊 Volume Analysis
Selling pressure during the formation of this support has been significant. With heavy market FOMO, many traders have already exited their TON positions. If this downside momentum continues, TON could enter a deeper corrective phase.
🔁 TONBTC Prespective
Meanwhile, the TON/BTC pair is also in a bearish structure, indicating that TON’s relative strength against Bitcoin is weakening.
📌 Trading Scenario
At the moment, TON presents one primary scenario, focused on the short side, which you can use alongside your own trading setup.
🔴 Short Scenario
A breakdown below the current support at $1.465, confirmed by a strong increase in sell volume, could trigger a sharp decline in TON.
❤️ Risk Management & Emotional Discipline
Crypto trading is highly risky. Without proper risk management and emotional control, trading is no different from gambling.
Logic must always come before emotions. Learn to manage your trades—and enjoy the process of trading with control and discipline.

Toncoin (TON/USDT): Trendline Break & Double BottomHi!
TON has formed a double-bottom reversal pattern after a sharp decline, signaling early bullish momentum. Price has also broken the minor descending trendline, confirming a short-term shift in structure.
Key Levels
Immediate Resistance: $1.63–$1.68 (first supply zone)
Major Resistance: $1.78–$1.82 (trendline + supply confluence)
Bullish Scenario
A sustained move above $1.63–$1.68 opens the path toward $1.78–$1.82, where the main descending trendline is located. A breakout there would confirm a stronger trend reversal.
Bearish Scenario
Failure to hold above the breakout zone may lead to a retest of $1.50–$1.52, the neckline of the double bottom.

#TON/USDT (TON/USDT): Trendline Break & Double Bottom#TON
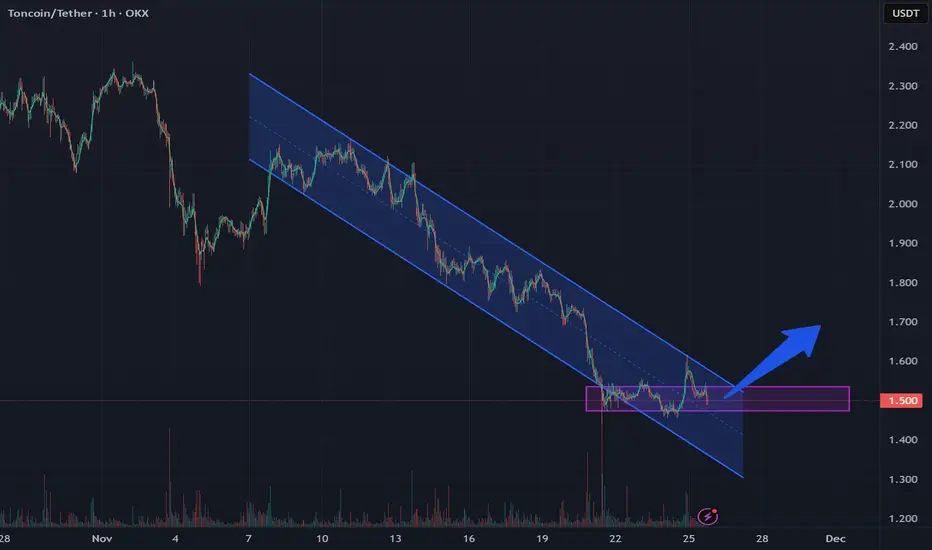
The price is moving within an ascending channel on the 1-hour timeframe and is adhering to it well. It is poised to break out strongly and retest the channel.
We have a downtrend line on the RSI indicator that is about to break and retest, which supports the upward move.
There is a key support zone in green at the price of 1.47, representing a strong support point.
We have a trend of consolidation above the 100-period moving average.
Entry price: 1.50
First target: 1.53
Second target: 1.58
Third target: 1.63
Don't forget a simple money management rule:
Place your stop-loss order below the support zone in green.
Once you reach the first target, save some money and then change your stop-loss order to an entry order.
For any questions, please leave a comment.
Thank you.

FireHoseReel | NOT: 64% Down — Capitulation or Massive Reversal?🔥 Welcome to FireHoseReel !
Let’s explore the latest Notcoin price structure.
🪐 NOTCOIN – Market Structure & Key Levels Update
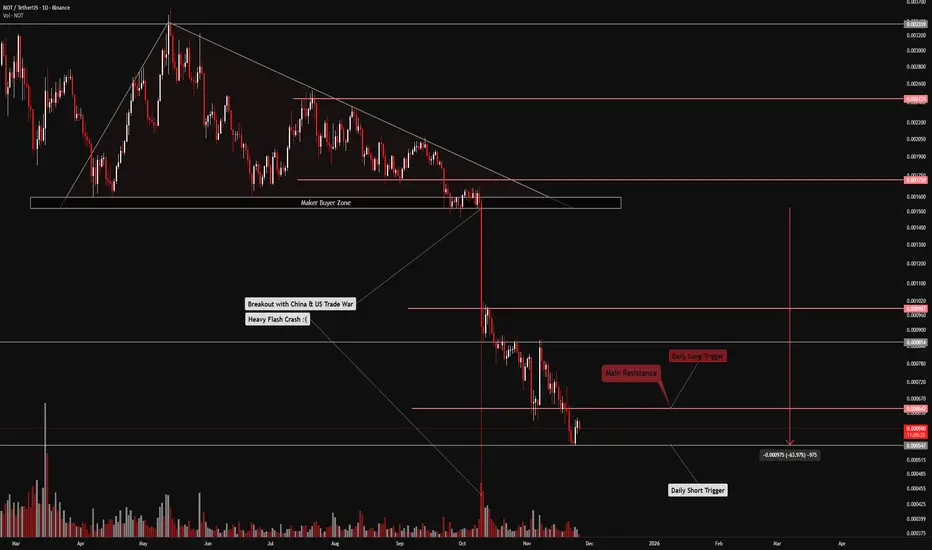
Notcoin has suffered a 64% crash following the flash crash triggered by the US–China trade war, marking one of the most severe declines in its history. Since its launch via a Telegram airdrop, Notcoin has consistently shown fragile price behavior, with repeated sharp corrections. Persistent selling pressure has made each pullback deeper, and the recent price action has even added an extra zero — clearly reflecting the gravity of this drawdown.
✨ Market Structure & Liquidity Outlook
At this stage, Notcoin’s structure has become extremely sensitive. Any additional downside could easily trigger a new corrective wave.
On the bullish side, if capital rotation returns to the TON ecosystem, Notcoin may experience a liquidity-driven upside squeeze. However, this scenario is heavily dependent on TON network performance and Telegram execution.
• Key Price Levels
• Daily resistance: 642
• Major support: 547
A daily close above 642 could activate a high-risk long trigger, best approached through futures trading for better flexibility.
On the other hand, a break below 547 may unleash aggressive selling pressure across Notcoin.
📊 Volume Analysis – The Decisive Factor
Volume remains the most critical metric at this stage.
After the flash crash, overall volume declined, but during multi-timeframe corrections, selling pressure clearly resurfaced, as confirmed by recent volume candles.
So far, strong buy-side volume has been rare, while sell pressure has stayed persistent and dominant.
✅ Trading Scenarios :
🔼 Long Scenario
• Confirmed break above 642
• Accompanied by a strong surge in volume
• This could trigger an upside expansion and support holding airdropped NOT or opening futures long positions.
🔽 Short Scenario
• Breakdown below 547
• Followed by a clear increase in sell pressure
• This would signal distribution risk, possibly forcing whale exits. Losing this support could justify reducing exposure and re-entering at lower levels to control risk.
🛞 Risk Management & Disclaimer
Please remember to always use proper risk management and position sizing. Nothing in this analysis is financial advice. The market can change quickly, so always trade based on your own strategy, research, and risk tolerance. You are fully responsible for your own trades.
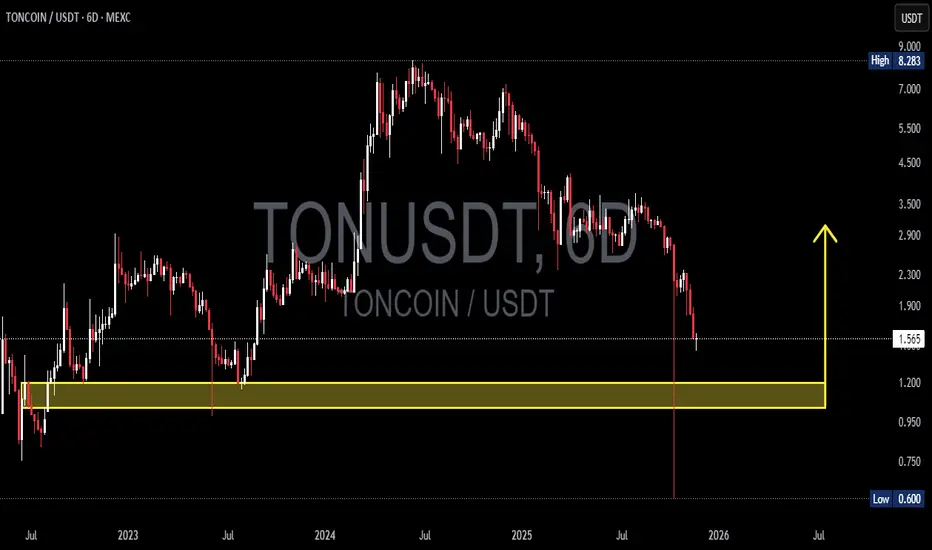
TON/USDT — Reversal Setup or Deeper Breakdown Ahead?On the 6D timeframe, TON has reached its most critical level since 2023. After forming a macro top near 8.28, the market shifted into a clean sequence of lower highs and lower lows, signaling sustained bearish control.
And now… price has landed directly inside the historical accumulation zone at 1.20 – 1.03 — a golden area that has repeatedly dictated long-term trend direction.
This isn’t just another support zone.
This is a psychological battleground, where major buyers stepped in previously and triggered multi-month rallies.
---
🔥 Why the 1.20 – 1.03 Zone Matters So Much
It has served as a macro pivot zone in previous cycles.
Every major uptrend in TON began with accumulation inside this area.
Holding this zone = potential multi-month bullish reversal.
Losing this zone = full transition into a macro bearish cycle.
TON is standing on the edge:
Either it rebounds explosively, or it breaks down toward levels not visited in years.
---
📈 Bullish Scenario — “Rebound from the Sacred Zone”
This scenario gains strength if:
1. Price prints a strong reversal inside 1.03–1.20 (pin bar / bullish engulfing).
2. A 6D candle closes back above 1.20 → confirms demand.
3. Breakout above 1.90–2.30 → confirms a macro trend shift.
If confirmed, upside targets are:
First target: 2.30
Expansion target: 3.50
Mid-cycle target: 5.00+
This could mark the beginning of TON’s next bullish cycle — but only with proper confirmation.
---
📉 Bearish Scenario — “Freefall Toward Extreme Lows”
Bearish continuation becomes likely if:
1. Price fails to hold the 1.03–1.20 support zone.
2. A 6D candle closes below 1.00 → macro support officially broken.
If breakdown confirms, downside targets become:
0.80
And potentially a retest of 0.60 (the previous flash-low wick).
A clean break below the yellow zone signals the end of TON’s multi-year bullish structure and opens the door for deeper corrective moves.
---
TON has entered the most decisive zone of the past two years.
The 1.03–1.20 range will determine whether TON launches a new bullish expansion…
or whether the market continues the strong downtrend toward 0.80–0.60.
The reaction inside this zone will dictate TON’s direction into 2026.
#TON #TONUSDT #CryptoTA #MarketStructure #SupportZone #PriceAction #CryptoTrading #ReversalZone
TON forms a bullish flag pattern with a local liquidity zoneTON has formed a bullish flag pattern, and we've also reached the local liquidity zone we've collected
According to the pattern, an upward rebound is expected
Current price: $1.492
If the price falls below the zone of interest and consolidates below, the movement will continue in a downward corridor within the pattern
TON Spot LONGThe newly formed range indicates local signs of accumulation.
After the deviation of the lower boundary of the range, an upward IOF was born, and with additional manipulation in the POI zone, there will be a great opportunity to open a long position. 📈

Not Yet Done — TON’s Triangle RunI’m slightly adjusting my previous plan, as the current structure made me rethink the pattern.
Earlier, I thought the ABCDE triangle was already complete, but now I’m starting to doubt that.
At the moment, I believe wave E might still need to form — and I see two possible scenarios for how it could unfold:
either along the green path or the purple one.
I’m leaning more toward the purple scenario, but it’s also possible that what we’re seeing now is still part of wave D — meaning yesterday’s low at 2.0959 could be just a portion of that move.
If that’s the case, Tone may first drop toward 1.96 to finish wave D,
then rise again to complete wave E of the triangle before continuing downward.
In that case, the decline could extend well below 1.96, possibly even toward 1.6.
