#TON/USDT : Short Wave Still In Progress#TON
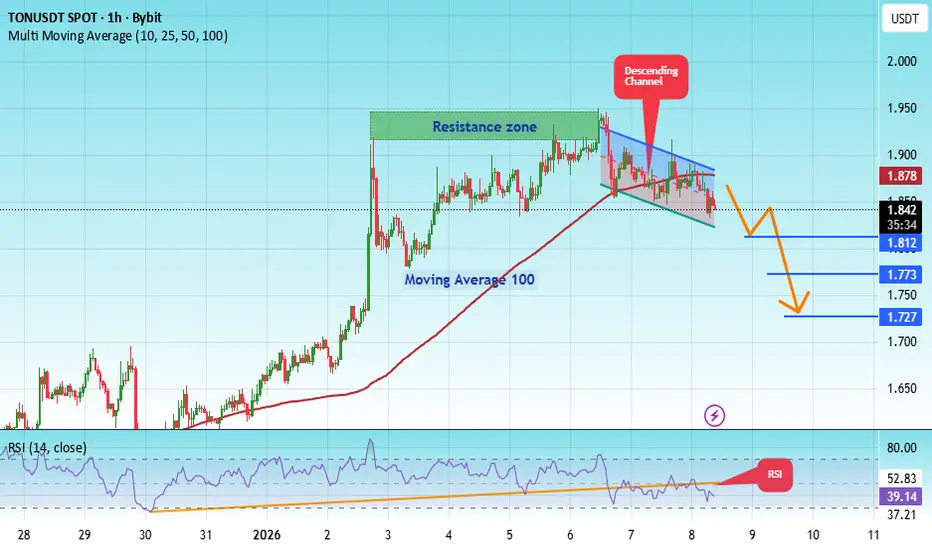
The price is moving in a descending channel on the 1-hour timeframe. It has reached the upper limit and is heading towards breaking downwards, with a retest of the upper limit expected.
We have an upward trend on the RSI indicator, which has reached near the upper limit, and a downward reversal is expected.
There is a major resistance zone in green at 1.94. The price has bounced from this zone multiple times and is expected to bounce again.
We have a trend of consolidation above the 100-period moving average, as we are moving close to it, which supports a downward move towards touching it.
Entry price: 1.84
First target: 1.81
Second target: 1.77
Third target: 1.72
Stop loss: Above the resistance zone in green.
Don't forget a simple thing: money management.
For inquiries, please leave a comment.
Thank you.
TONBTC
#TON/USDT : Trendline Break & Double Bottom#TON
The price is moving in a descending channel on the 1-hour timeframe. It has reached the lower boundary and is heading towards breaking above it, with a retest of the upper boundary expected.
We have a downtrend on the RSI indicator, which has reached near the lower boundary, and an upward rebound is expected.
There is a key support zone in green at 1.53. The price has bounced from this zone multiple times and is expected to bounce again.
We have a trend towards stability above the 100-period moving average, as we are moving close to it, which supports the upward movement.
Entry price: 1.60
First target: 1.64
Second target: 1.69
Third target: 1.755
Stop loss: Below the support zone in green.
Don't forget a simple thing: capital management.
For inquiries, please leave a comment.
Thank you.

#TON/USDT : Trendline Break & Double Bottom#TON
The price is moving in a descending channel on the 1-hour timeframe. It has reached the lower boundary and is heading towards a breakout, with a retest of the upper boundary expected.
We are seeing a bearish trend in the Relative Strength Index (RSI), which has reached near the lower boundary, and an upward bounce is expected.
There is a key support zone in green at 1.39, and the price has bounced from this level several times. Another bounce is expected.
We are seeing a trend towards stabilizing above the 100-period moving average, which we are approaching, supporting the upward trend.
Entry Price: 1.47
First Target: 1.48
Second Target: 1.52
Third Target: 1.57
Remember a simple principle: Money Management.
Place your stop-loss order below the green support zone.
For any questions, please leave a comment.
Thank you.

#TON/USDT (TON/USDT): Trendline Break & Double Bottom#TON
The price is moving within an ascending channel on the 1-hour timeframe and is adhering to it well. It is poised to break out strongly and retest the channel.
We have a downtrend line on the RSI indicator that is about to break and retest, which supports the upward move.
There is a key support zone in green at the price of 1.47, representing a strong support point.
We have a trend of consolidation above the 100-period moving average.
Entry price: 1.50
First target: 1.53
Second target: 1.58
Third target: 1.63
Don't forget a simple money management rule:
Place your stop-loss order below the support zone in green.
Once you reach the first target, save some money and then change your stop-loss order to an entry order.
For any questions, please leave a comment.
Thank you.

#TON/USDT Consolidation Buy After Sell-Off#TON
The price is moving in a descending channel on the 1-hour frame and is expected to break it and continue upward.
We have a trend to stabilize above the 100 moving average again.
We have a downtrend on the RSI indicator that supports the upward move with a breakout.
We have a major support area in green that pushed the price higher at 2.12.
Entry price: 2.15.
First target: 2.16.
Second target: 2.18.
Third target: 2.21.
To manage risk, don't forget stop loss and capital management.
The stop loss is below the support area in green.
When the first target is reached, save some profits and then change the stop order to an entry order.
For inquiries, please comment.
Thank you.

#TON/USDT Consolidation Buy After Sell-Off#TON
The price is moving within a descending channel on the 1-hour frame, adhering well to it, and is heading for a strong breakout and retest.
We have a bearish trend on the RSI indicator that is about to be broken and retested, which supports the upward breakout.
There is a major support area in green at 2.15, representing a strong support point.
We are heading for consolidation above the 100 moving average.
Entry price: 2.30
First target: 2.38
Second target: 2.47
Third target: 2.58
Don't forget a simple matter: capital management.
When you reach the first target, save some money and then change your stop-loss order to an entry order.
For inquiries, please leave a comment.
Thank you.

#TON/USDT : Bullish Wave Still In Progress#TON
The price is moving within a descending channel on the 1-hour frame, adhering well to it, and is heading for a strong breakout and retest.
We have a bearish trend on the RSI indicator that is about to be broken and retested, which supports the upward breakout.
There is a major support area in green at 2.70, representing a strong support point.
We are heading for consolidation above the 100 moving average.
Entry price: 2.76
First target: 2.80
Second target: 2.87
Third target: 2.96
Don't forget a simple matter: capital management.
When you reach the first target, save some money and then change your stop-loss order to an entry order.
For inquiries, please leave a comment.
Thank you.

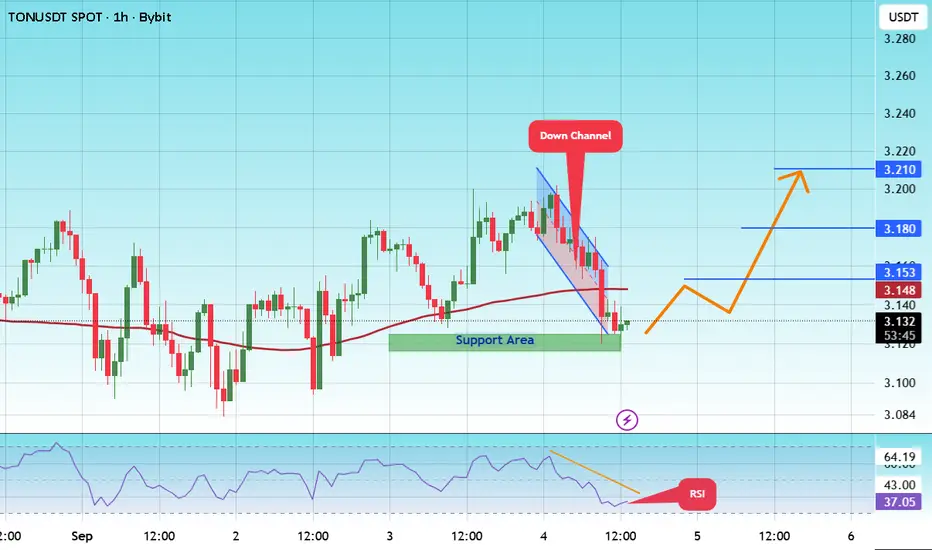
#TON/USDT | TON Testing Wedge Breakout Amid Key Support#TON
The price is moving within a descending channel on the 1-hour frame, adhering well to it, and is heading for a strong breakout and retest.
We have a bearish trend on the RSI indicator that is about to be broken and retested, which supports the upward breakout.
There is a major support area in green at 3.07, representing a strong support point.
We are heading for consolidation above the 100 moving average.
Entry price: 3.14
First target: 3.17
Second target: 3.22
Third target: 3.72
Don't forget a simple matter: capital management.
When you reach the first target, save some money and then change your stop-loss order to an entry order.
For inquiries, please leave a comment.
Thank you.
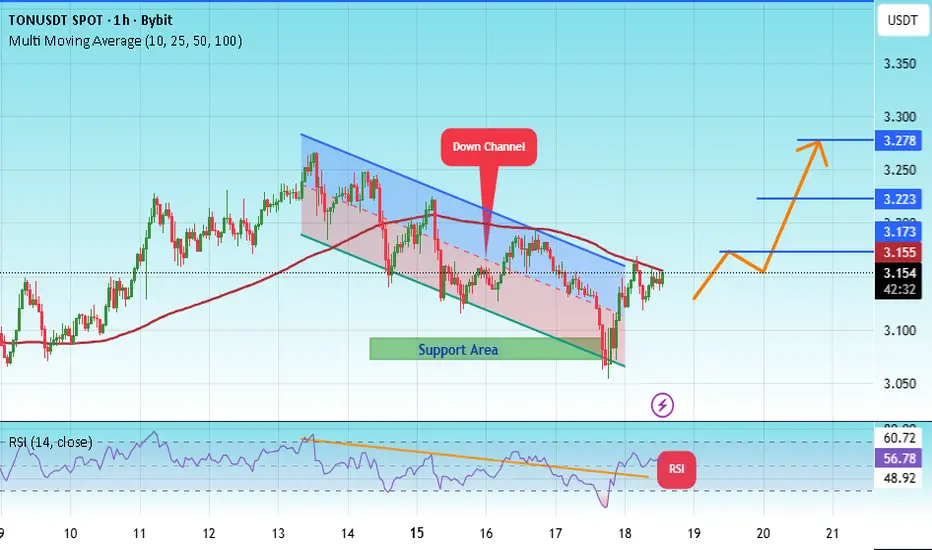
#TON/USDT | TON Testing Wedge Breakout Amid Key Support#TON
The price is moving within a descending channel on the 1-hour frame and is expected to break and continue upward.
We have a trend to stabilize above the 100 moving average once again.
We have a downtrend on the RSI indicator that supports the upward move with a breakout.
We have a support area at the lower boundary of the channel at 3.12, acting as strong support from which the price can rebound.
We have a major support area in green that pushed the price higher at 3.12.
Entry price: 3.12
First target: 3.15
Second target: 3.18
Third target: 3.21
To manage risk, don't forget stop loss and capital management.
When you reach the first target, save some profits and then change the stop order to an entry order.
For inquiries, please comment.
Thank you.
TONUSDTThe chart of OKX:TONUSDT is now break trendline so wait for continue bullish trend.
Support: 3.520 - 3.720
Resistance: 3.190 - 3.020 - 2.925 - 2.670
⚠️ Please control risk management.

#TON/USDT#TON
The price is moving within an ascending channel on the 1-hour frame, adhering well to it, and is on its way to break it strongly upwards and retest it.
We have support from the lower boundary of the ascending channel, at 3.05.
We have a downtrend on the RSI indicator that is about to break and retest, supporting the upside.
There is a major support area in green at 3.03, which represents a strong basis for the upside.
Don't forget a simple thing: ease and capital.
When you reach the first target, save some money and then change your stop-loss order to an entry order.
For inquiries, please leave a comment.
We have a trend to hold above the 100 Moving Average.
Entry price: 3.20.
First target: 3.40.
Second target: 3.53.
Third target: 3.70.
Don't forget a simple thing: ease and capital.
When you reach your first target, save some money and then change your stop-loss order to an entry order.
For inquiries, please leave a comment.
Thank you.

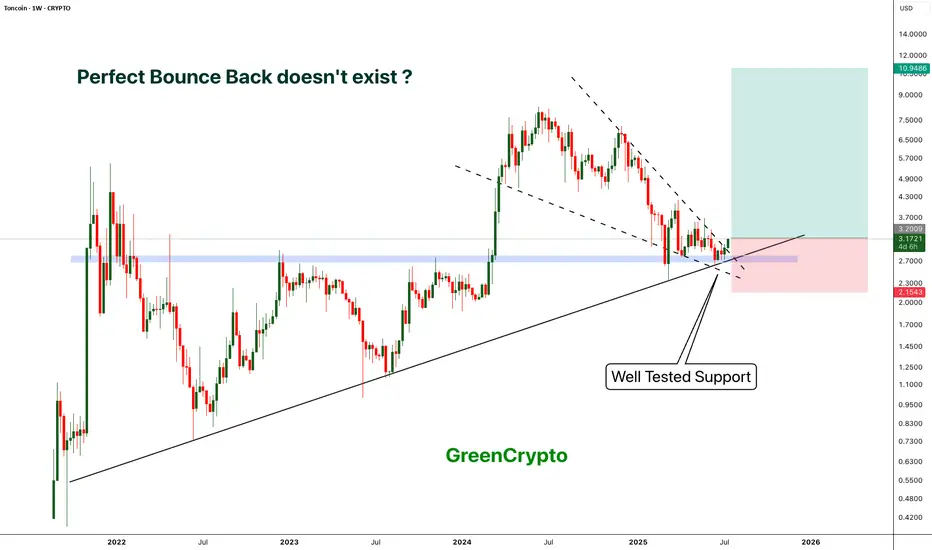
TON - Locked and Loaded for a perfect Reversal- TON is reversing perfectly from its long tested support
- On weekly chart we have clear bounce back and perfect candle.
- This is an excellent opportunity to enter
Entry Price: 3.17
Stop Loss: 2.15
TP1: 4.0796
TP2: 5.2629
TP3: 6.8383
TP4: 8.3298
TP5: 11.0191
Stay tuned for more updates.
Cheers
GreenCrypto
TON New Update (1D)This analysis is an update of the analysis you see in the "Related publications" section
Since we started publishing a series of bearish analyses on TON, the coin has experienced a significant drop | despite the ongoing growth of the Telegram app and its expanding user base.
Before reaching the support zone mentioned in our previous analysis, a strong intermediate demand zone is visible along the way, located just below a notable liquidity pool. A solid bullish reaction is expected from this identified demand area.
Targets are clearly marked on the chart.
A daily candle close below the invalidation level will invalidate this analysis.
For risk management, please don't forget stop loss and capital management
When we reach the first target, save some profit and then change the stop to entry
Comment if you have any questions
Thank You

TONUSDT: Short the Rejection,Buy the Capitulation – A Dual-Level
📉 TONUSDT Technical Analysis – Trending in a Long-Term Descending Channel, Is the Ideal Short Entry Coming?
TONUSDT is currently trading inside a long-term descending channel, with clear bearish momentum dominating the structure.
🔻 Scenario 1 (Early & Risky Entry):
Traders may consider opening a short position from the current level, but this setup carries higher risk, as the price could still push upward toward the upper boundary of the channel.
Stop-loss level is clearly marked on the chart.
🧭 Scenario 2 (Smarter, Low-Risk Entry):
A more calculated approach is to wait for the price to revisit the upper resistance zone of the descending channel (marked as Entry 1 on the chart).
This zone offers a clean low-risk, high-reward short opportunity, with a tight stop-loss and excellent setup.
🎯 Defined Targets in This Analysis:
Target 1: The midline of the descending channel
Target 2: The bottom of the long-term descending channel
💎 Important Insight:
If this bearish scenario completes and the price reaches the bottom of the descending channel, that zone could be a prime buying opportunity for long-term holders.
Technically, it's a major support level and psychologically, it's where smart money often steps in.
⚠️ Disclaimer:
This is not financial advice. This analysis is for educational purposes only. Always wait for confirmation and apply strict risk management when trading.
📩 What’s your opinion on this setup? Do you agree with the short plan, or see another scenario unfolding? 👇

TONUSDT On the @TONUSDT chart, price is currently making a corrective move after reacting to the key support at 2.800. It may rise toward the 3.230 resistance and potentially break higher with a pullback to continue upward. However, if the 2.800 support fails, a deeper drop could follow. ⚠️📉
Resistances:
• 3.230 💥
• 3.371 🔼
• 3.656 🔼
• 3.948 🚀
Supports:
• 2.910 🛡️
• 2.800 🔻
⚠️Contorl Risk management for trades.

#TON/USDT#TON
The price is moving within a descending channel on the 1-hour frame, adhering well to it, and is heading for a strong breakout and retest.
We are experiencing a rebound from the lower boundary of the descending channel, which is support at 3.20.
We are experiencing a downtrend on the RSI indicator, which is about to break and retest, supporting the upward trend.
We are looking for stability above the 100 Moving Average.
Entry price: 3.30
First target: 3.41
Second target: 3.53
Third target: 3.69

TONCOINCRYPTOCAP:TON In the 4-hour timeframe, key support and resistance zones have been identified based on significant highs and lows. The primary resistance area is at $4.070, while the main support level is at $2.860. A descending trendline has been drawn, and the price trading below the 200-period moving average suggests continued bearish momentum in this time horizon. However, if the near-term resistance at $3.590 is broken, a potential upward movement towards the primary resistance at $4.070 could occur. Conversely, a break below the immediate support at $3.000 might lead to a price decrease towards the main support level at $2.860. To confirm bullish or bearish scenarios, monitoring for valid breakouts of these levels along with volume analysis and other technical tools is essential.

#TON/USDT#TON
The price is moving within a descending channel on the 1-hour frame, adhering well to it, and is heading towards a strong breakout and retest.
We are experiencing a rebound from the lower boundary of the descending channel, which is support at 2.97.
We are experiencing a downtrend on the RSI indicator, which is about to break and retest, supporting the upward trend.
We are looking for stability above the 100 Moving Average.
Entry price: 3.02
First target: 3.05
Second target: 3.15
Third target: 3.22

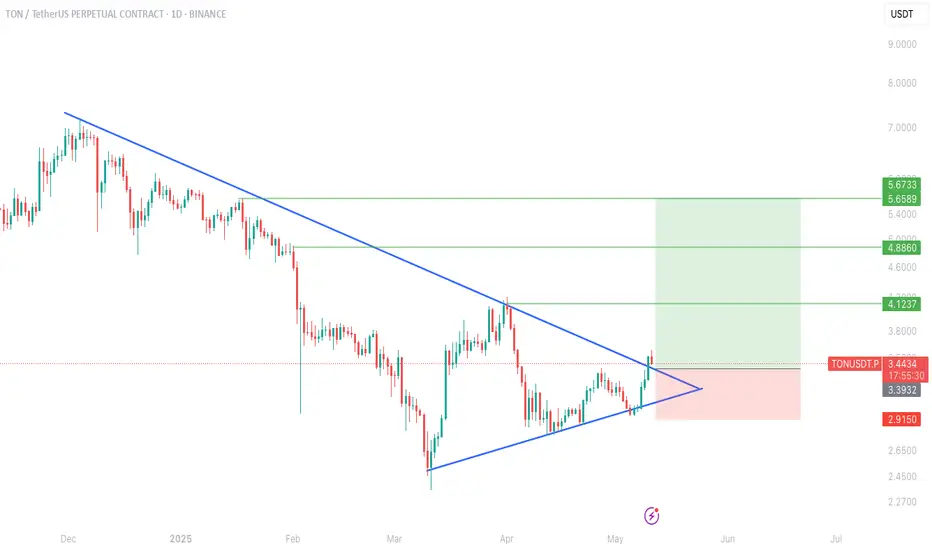
TON breakout alert!!CRYPTOCAP:TON chart Update!
TON has officially broken out of a multi-month symmetrical triangle on the daily chart, signaling a potential trend reversal after a long downtrend.
📈 Clean breakout above descending resistance
🔼 Entry triggered around $3.44
🎯 Targets ahead:
TP1: $4.12
TP2: $4.88
TP3: $5.67
As long as the price stays above the breakout zone, bulls are in control. A successful retest could offer another great entry!
If you find this analysis helpful, please hit the like button to support my content! Share your thoughts in the comments, and feel free to request any specific chart analysis you’d like to see.
Happy Trading!!
#TON/USDT#TON
The price is moving within a descending channel on the 1-hour frame and is expected to continue lower.
We have a trend to stabilize below the 100 moving average once again.
We have a downtrend on the RSI indicator, supporting the upward move with a breakout.
We have a resistance area at the upper limit of the channel at 3.73.
Entry price: 3.69
First target: 3.60
Second target: 3.515
Third target: 3.40

Is a TON Pump Coming?Is a TON Pump Coming? 🚀
TON, the blockchain developed by Telegram’s team, has gained significant attention due to its low transaction fees and strong connection with Telegram. Recent increases in liquidity and demand indicate growing investor interest in this cryptocurrency.
🔹 Technical Analysis:
TON is currently in a short-term uptrend, with $4 acting as a key resistance level. A confirmed breakout above this level could push the price towards $7. However, failure to break this resistance may lead to a price correction toward lower support levels.
🔹 Potential Risks:
A significant portion of TON tokens is held by whales, which could lead to high volatility. Additionally, its unlimited supply poses long-term inflation risks if not managed properly.
🔹 Growth Catalysts:
Recent positive news, such as Telegram’s potential partnership with AI (Grok) and the release of key updates, could drive further demand. If TON sustains its momentum and breaks key resistance levels, it may enter a stronger bullish phase.
📌 Conclusion:
While TON has strong fundamentals and market interest, its long-term stability depends on supply management and investor behavior. Entry at key levels with proper risk management is essential for those looking to trade or invest. 🚀

TONBTC - The 1st TargetAfter a prolonged three-year correction in an irregular ABC zigzag, the cryptocurrency TON has promptly bounced off the bottom and is heading North

TONUSDT TONUSDT Signal 🚀
🔹 Entry: Wait for a complete pullback (Confirm support) 3.154
🔹 Targets:
🎯 3.489 (First resistance)
🎯 3.869 (Key breakout level)
🎯 4.478 (Major resistance)
🎯 4.731 (Final target)
🔹 Stop Loss: 2.731 (Below key support)
🔹 Risk Management: Control your risk before entering
