#TON/USDT : Trendline Break & Double Bottom#TON
The price is moving in a descending channel on the 1-hour timeframe. It has reached the lower boundary and is heading towards breaking above it, with a retest of the upper boundary expected.
We have a downtrend on the RSI indicator, which has reached near the lower boundary, and an upward rebound is expected.
There is a key support zone in green at 1.53. The price has bounced from this zone multiple times and is expected to bounce again.
We have a trend towards stability above the 100-period moving average, as we are moving close to it, which supports the upward movement.
Entry price: 1.60
First target: 1.64
Second target: 1.69
Third target: 1.755
Stop loss: Below the support zone in green.
Don't forget a simple thing: capital management.
For inquiries, please leave a comment.
Thank you.
TONCOINUSD

TON/USDT: Range Structure Within a Broader DowntrendHi!
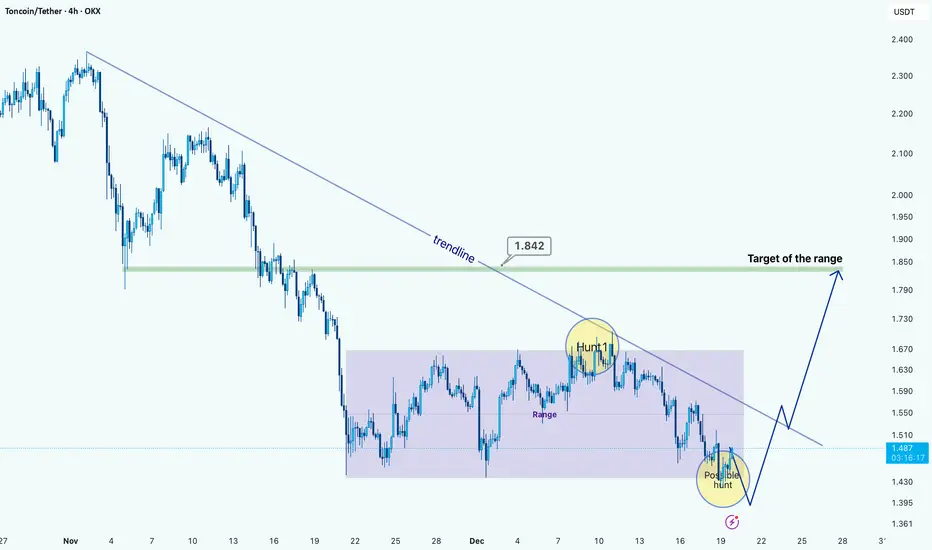
TON is still trading under a well-defined descending trendline, confirming that the higher-timeframe structure remains bearish. After the impulsive sell-off, the price transitioned into a clear consolidation range, highlighted on the chart. This range shows multiple reactions at both extremes, validating it as an accumulation/distribution zone rather than random price action.
A notable liquidity hunt occurred near the upper boundary of the range, where price briefly swept highs and was immediately rejected, aligning with the descending trendline and reinforcing it as dynamic resistance. Currently, price is trading near the lower boundary of the range, where another potential liquidity sweep may occur before a directional move.
Bullish scenario: A downside sweep below the range lows, followed by strong acceptance back inside the range, could trigger a reversal toward the range high near 1.84, which also aligns with the descending trendline and acts as a logical target.
Bearish scenario: Failure to reclaim the range after a breakdown would confirm continuation of the downtrend, exposing lower supports.
TON : SELL LIMIT
Hello friends
considering the downtrend we are in, the power of sellers is quite clear and it is logical that we also move to the strong side, and in this downtrend, any price increase can be a selling opportunity.
So now, considering the buyers' support of the support area identified with Fibonacci, we need to see whether the sellers will enter again in the identified resistance area or not?
If the buyers weaken again in the resistance area, the price can fall to the specified targets.
This analysis is purely technically reviewed and is not a buy or sell recommendation, so do not act emotionally and observe risk and capital management.
*Trade safely with us*

Toncoin (TON/USDT): Trendline Break & Double BottomHi!
TON has formed a double-bottom reversal pattern after a sharp decline, signaling early bullish momentum. Price has also broken the minor descending trendline, confirming a short-term shift in structure.
Key Levels
Immediate Resistance: $1.63–$1.68 (first supply zone)
Major Resistance: $1.78–$1.82 (trendline + supply confluence)
Bullish Scenario
A sustained move above $1.63–$1.68 opens the path toward $1.78–$1.82, where the main descending trendline is located. A breakout there would confirm a stronger trend reversal.
Bearish Scenario
Failure to hold above the breakout zone may lead to a retest of $1.50–$1.52, the neckline of the double bottom.

#TON/USDT (TON/USDT): Trendline Break & Double Bottom#TON
The price is moving within an ascending channel on the 1-hour timeframe and is adhering to it well. It is poised to break out strongly and retest the channel.
We have a downtrend line on the RSI indicator that is about to break and retest, which supports the upward move.
There is a key support zone in green at the price of 1.47, representing a strong support point.
We have a trend of consolidation above the 100-period moving average.
Entry price: 1.50
First target: 1.53
Second target: 1.58
Third target: 1.63
Don't forget a simple money management rule:
Place your stop-loss order below the support zone in green.
Once you reach the first target, save some money and then change your stop-loss order to an entry order.
For any questions, please leave a comment.
Thank you.

#TON/USDT Consolidation Buy After Sell-Off#TON
The price is moving in a descending channel on the 1-hour frame and is expected to break it and continue upward.
We have a trend to stabilize above the 100 moving average again.
We have a downtrend on the RSI indicator that supports the upward move with a breakout.
We have a major support area in green that pushed the price higher at 2.12.
Entry price: 2.15.
First target: 2.16.
Second target: 2.18.
Third target: 2.21.
To manage risk, don't forget stop loss and capital management.
The stop loss is below the support area in green.
When the first target is reached, save some profits and then change the stop order to an entry order.
For inquiries, please comment.
Thank you.

#TON/USDT : Bullish Wave Still In Progress#TON
The price is moving within a descending channel on the 1-hour frame, adhering well to it, and is heading for a strong breakout and retest.
We have a bearish trend on the RSI indicator that is about to be broken and retested, which supports the upward breakout.
There is a major support area in green at 2.70, representing a strong support point.
We are heading for consolidation above the 100 moving average.
Entry price: 2.76
First target: 2.80
Second target: 2.87
Third target: 2.96
Don't forget a simple matter: capital management.
When you reach the first target, save some money and then change your stop-loss order to an entry order.
For inquiries, please leave a comment.
Thank you.

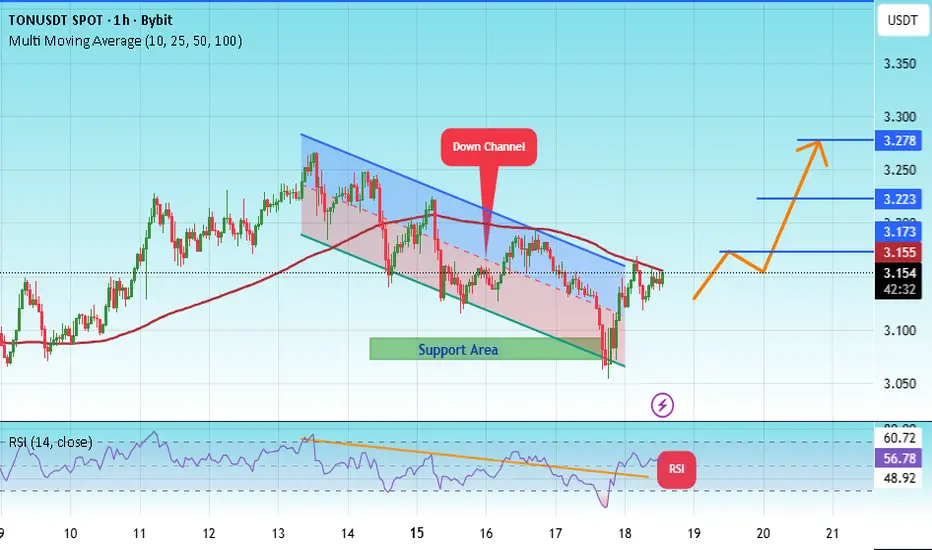
#TON/USDT | TON Testing Wedge Breakout Amid Key Support#TON
The price is moving within a descending channel on the 1-hour frame, adhering well to it, and is heading for a strong breakout and retest.
We have a bearish trend on the RSI indicator that is about to be broken and retested, which supports the upward breakout.
There is a major support area in green at 3.07, representing a strong support point.
We are heading for consolidation above the 100 moving average.
Entry price: 3.14
First target: 3.17
Second target: 3.22
Third target: 3.72
Don't forget a simple matter: capital management.
When you reach the first target, save some money and then change your stop-loss order to an entry order.
For inquiries, please leave a comment.
Thank you.
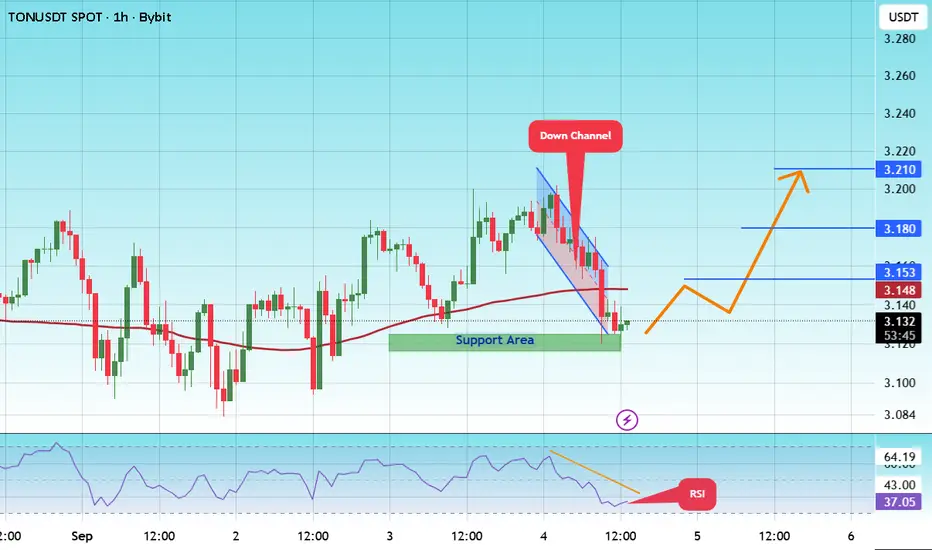
#TON/USDT | TON Testing Wedge Breakout Amid Key Support#TON
The price is moving within a descending channel on the 1-hour frame and is expected to break and continue upward.
We have a trend to stabilize above the 100 moving average once again.
We have a downtrend on the RSI indicator that supports the upward move with a breakout.
We have a support area at the lower boundary of the channel at 3.12, acting as strong support from which the price can rebound.
We have a major support area in green that pushed the price higher at 3.12.
Entry price: 3.12
First target: 3.15
Second target: 3.18
Third target: 3.21
To manage risk, don't forget stop loss and capital management.
When you reach the first target, save some profits and then change the stop order to an entry order.
For inquiries, please comment.
Thank you.
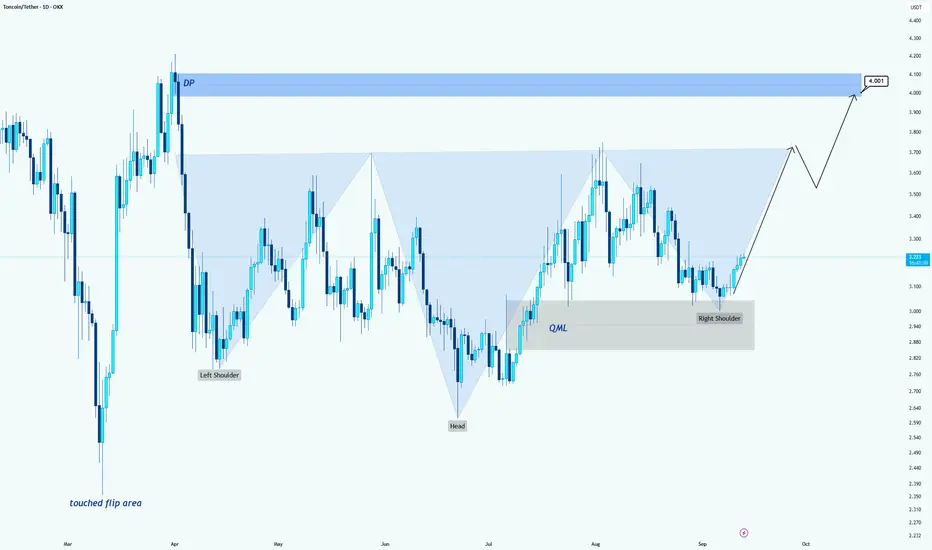
TON/USDT –> Inverse Head & Shoulders Breakout SetupHello guys!
On the daily chart, TON is forming a clear Inverse Head & Shoulders pattern, a classic bullish reversal structure.
Key Levels & Structure:
Left Shoulder: Around 3.00
Head: Around 2.30
Right Shoulder: Recently formed around 3.00, confirming buyer interest.
QML Zone: 2.90 – 3.00 area has acted as a strong demand base.
Bullish Scenario:
A breakout above the 3.50 – 3.60 neckline opens the way for a strong move higher.
Main target sits around the 4.00 – 4.10 DP zone, aligning with previous supply.
After reaching that level, a possible short-term correction could happen before continuation.
Invalidation:
A daily close below 2.90 (QML zone) would invalidate the bullish structure and put buyers on the defensive.
📌 Conclusion:
TON is showing a strong reversal pattern. If the neckline breaks, the path to 4.00+ looks likely. Buyers remain in control while the price stays above 2.90.
TONUSDTThe chart of OKX:TONUSDT is now break trendline so wait for continue bullish trend.
Support: 3.520 - 3.720
Resistance: 3.190 - 3.020 - 2.925 - 2.670
⚠️ Please control risk management.

TONCOIN ; Will the pump price finally be fixed?Hello friends
Well, you see that after the decline we had, the price has reached the range that we have specified for you.
In this range, the price once attacked the ceiling of the range, but the failure was fake, which we have also specified.
Now, in this movement, the buyers must see again whether the range will finally be broken or not?
In the event of a valid failure of the trading range, the price can easily move to the specified resistances.
*Trade safely with us*

TONCOIN Neutral dynamics prevail on most timeframesOverall technical sentiment
Today's signal: Neutral — neutral dynamics prevail on most timeframes and technical indicators. 1-week rating is also balanced, and 1-month — shows "Sell"
Technical indicators
Overall technical conclusion: Strong Sell
Moving Averages: 5 Buy, 7 Sell
Oscillators: 1 Buy, 8 Sell
Summary: Strong Sell — technical indicators and averages point to downward pressure.
Main indicators:
RSI (14): ~46 — neutral
Stochastic: neutral
StochRSI: Sell
MACD: Buy
ADX: Sell
Williams %R: Sell
CCI: Sell
ROC: Sell
Most oscillators are on the sellers' side.
Moving Averages:
MA5/MA10/MA20: Sell
MA50/MA100/MA200: Buy — several mid-term MAs support a possible reversal.
Pivot levels (Classic):
S1: $3.3368
Pivot: $3.3472
R1: $3.3526 — nearest resistance.
Volume and Market Data
Current TON Price: ~$3.34
24-hour range: $3.33–$3.41
Trading Volume: about $170–200 million
Capitalization: ~$8.58 billion,

#TON/USDT#TON
The price is moving within an ascending channel on the 1-hour frame, adhering well to it, and is on its way to break it strongly upwards and retest it.
We have support from the lower boundary of the ascending channel, at 3.05.
We have a downtrend on the RSI indicator that is about to break and retest, supporting the upside.
There is a major support area in green at 3.03, which represents a strong basis for the upside.
Don't forget a simple thing: ease and capital.
When you reach the first target, save some money and then change your stop-loss order to an entry order.
For inquiries, please leave a comment.
We have a trend to hold above the 100 Moving Average.
Entry price: 3.20.
First target: 3.40.
Second target: 3.53.
Third target: 3.70.
Don't forget a simple thing: ease and capital.
When you reach your first target, save some money and then change your stop-loss order to an entry order.
For inquiries, please leave a comment.
Thank you.

TONCOIN - Technical pictureTechnical picture
All key indicators, including RSI (≈56), STOCH, MACD, ADX and others, signal Buy. There is not a single "Sell" signal or
Moving averages on all timeframes (from MA5 to MA200) also give a stable Buy, without "Sell" signals
Pivot levels:
Current Pivot: $3.4271
Resistance: $3.4436 (R1), then $3.4629 and $3.4794
Conclusion: the overall sentiment is confidently bullish.
Additional signals:
Analysis by indicators: 1 Sell, 7 Neutral, 17 Buy - final signal: Strong Buy
Among the oscillators - 5 Buy signals, 5 Neutral, 0 Sell.
Moving Averages: 12 Buy, 2 Neutral, 1 Sell
Chart Shapes and Patterns
According to OKX Europe, Toncoin has exited a descending triangle, which often indicates a trend reversal
Support: $2.60 and $3.00. Resistance: $3.50 and $3.70
Upside Potential and Key Levels
Cryptodamus's final article emphasizes that the $4.00 zone (100-day MA) is key: a break above it could open the way to $5.48, and a failure to $2.90
Binance Square outlines immediate targets: $3.95-4.00, then $4.20-4.30, and a possible move to $4.50+ if the $3.91 level is broken

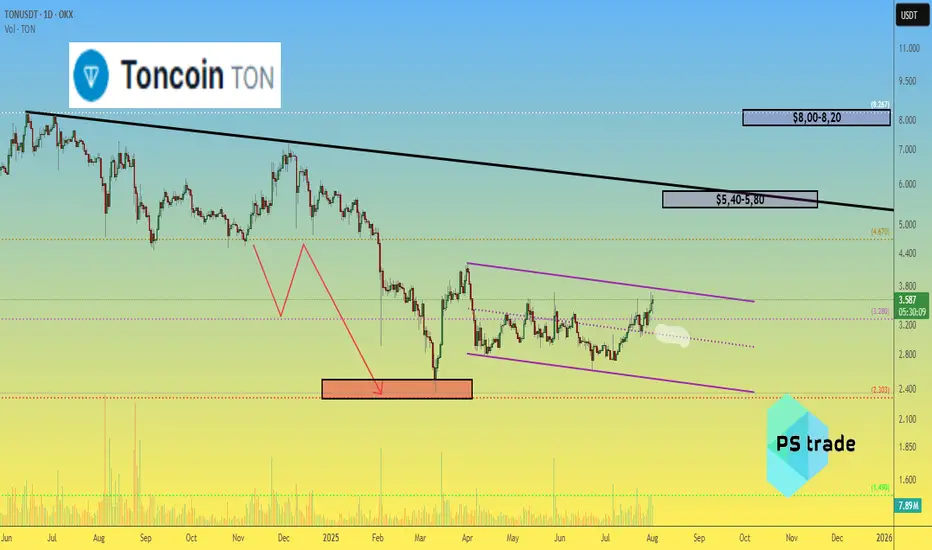
Toncoin TON price analysis💎 CRYPTOCAP:TON didn’t become a legend over the past 9 months — but at least our correction target of $2.30–2.50 played out with precision.
While most of the crypto market is currently going through a correction, #Toncoin keeps pushing upward. Still, we remain realistic:
🎯 First target: $5.40–5.80
🎯 Second target: $8.00–8.20
🚀 It’s not a “to the moon” scenario, but a potential 2x–3x from current levels is attractive.
The key support level OKX:TONUSDT remains at $3.00 — as long as it holds, the bullish trend remains valid.
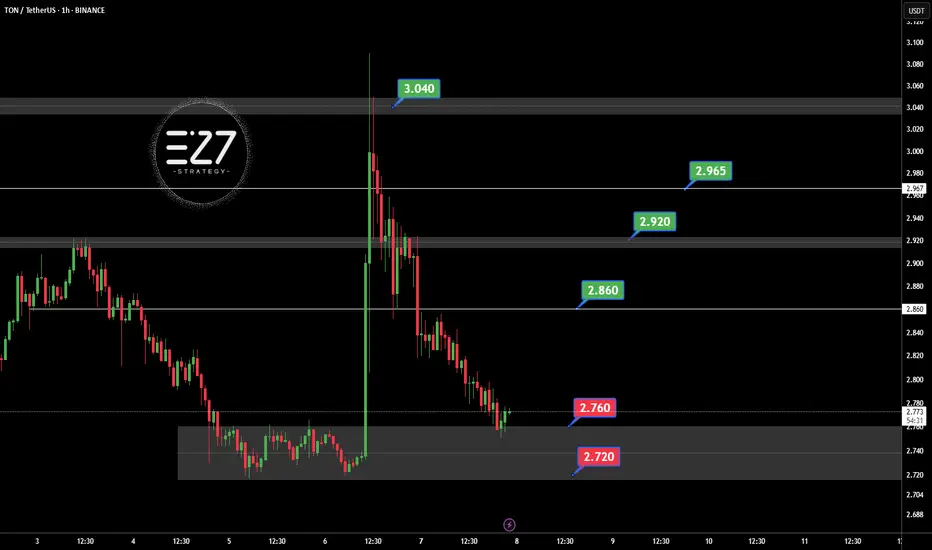
TONUSDT Following the official denial by UAE authorities regarding the possibility of obtaining a golden visa through staking OKX:TONUSDT , the bullish momentum driven by that rumor has faded. Selling pressure has increased, and TON is now consolidating within the key support zone of 2.720 to 2.760 USDT. If this support breaks, further downside is likely. However, if the price holds and reclaims the 2.860 USDT resistance, it could trigger a recovery toward 2.920 and 2.965 USDT. For now, the market sentiment remains bearish with a corrective bias.
Key Points:
UAE officially denied TON-based golden visa claims, weakening sentiment.
Current support zone: 2.720–2.760 USDT.
Key resistance: 2.860 USDT, then 2.920 USDT.
Break below 2.720 = further decline.
Break above 2.860 = potential bullish reversal.
⚠️ Please Control Risk Management in trades.
Today's signal is TONHello friends
Given the price growth after reaching resistance, it has entered a correction, which provides a good opportunity to buy in stages and with capital management and move to the specified targets.
*Trade safely with us*

TONUSDT On the @TONUSDT chart, price is currently making a corrective move after reacting to the key support at 2.800. It may rise toward the 3.230 resistance and potentially break higher with a pullback to continue upward. However, if the 2.800 support fails, a deeper drop could follow. ⚠️📉
Resistances:
• 3.230 💥
• 3.371 🔼
• 3.656 🔼
• 3.948 🚀
Supports:
• 2.910 🛡️
• 2.800 🔻
⚠️Contorl Risk management for trades.

LIVE TRADEHello friends
Given the ascending channel that has formed, we can open positions with capital and risk management to move towards the specified goals.
*Trade safely with us*

#TON/USDT#TON
The price is moving within a descending channel on the 1-hour frame, adhering well to it, and is heading for a strong breakout and retest.
We are experiencing a rebound from the lower boundary of the descending channel, which is support at 3.20.
We are experiencing a downtrend on the RSI indicator, which is about to break and retest, supporting the upward trend.
We are looking for stability above the 100 Moving Average.
Entry price: 3.30
First target: 3.41
Second target: 3.53
Third target: 3.69

TONCOINCRYPTOCAP:TON In the 4-hour timeframe, key support and resistance zones have been identified based on significant highs and lows. The primary resistance area is at $4.070, while the main support level is at $2.860. A descending trendline has been drawn, and the price trading below the 200-period moving average suggests continued bearish momentum in this time horizon. However, if the near-term resistance at $3.590 is broken, a potential upward movement towards the primary resistance at $4.070 could occur. Conversely, a break below the immediate support at $3.000 might lead to a price decrease towards the main support level at $2.860. To confirm bullish or bearish scenarios, monitoring for valid breakouts of these levels along with volume analysis and other technical tools is essential.

#TON/USDT#TON
The price is moving within a descending channel on the 1-hour frame, adhering well to it, and is heading towards a strong breakout and retest.
We are experiencing a rebound from the lower boundary of the descending channel, which is support at 2.97.
We are experiencing a downtrend on the RSI indicator, which is about to break and retest, supporting the upward trend.
We are looking for stability above the 100 Moving Average.
Entry price: 3.02
First target: 3.05
Second target: 3.15
Third target: 3.22
