Not Yet Done — TON’s Triangle RunI’m slightly adjusting my previous plan, as the current structure made me rethink the pattern.
Earlier, I thought the ABCDE triangle was already complete, but now I’m starting to doubt that.
At the moment, I believe wave E might still need to form — and I see two possible scenarios for how it could unfold:
either along the green path or the purple one.
I’m leaning more toward the purple scenario, but it’s also possible that what we’re seeing now is still part of wave D — meaning yesterday’s low at 2.0959 could be just a portion of that move.
If that’s the case, Tone may first drop toward 1.96 to finish wave D,
then rise again to complete wave E of the triangle before continuing downward.
In that case, the decline could extend well below 1.96, possibly even toward 1.6.
Tonusdtanalysis

TON/USDT — Defense Zone at 2.20–1.92: Reversal or Breakdown?TON is now standing at a critical inflection point — the 2.20–1.92 zone (yellow block).
This area isn’t just another support level — it’s the make-or-break zone that will decide whether TON will rebound for a macro reversal or collapse into a deeper downtrend.
After a sharp fall from the 8.28 high, price has reached its historical demand base, showing a strong wick rejection below support — a classic sign of liquidity sweep or stop-hunt, often marking the final shakeout before larger players begin accumulating.
However, without a clear structure break and volume confirmation, the risk of a fake bounce remains high.
---
Structure & Pattern Analysis
1. Macro trend remains bearish, with a series of lower highs and lower lows since the 2024 peak.
2. The 2.20–1.92 zone represents a major accumulation range, also aligning with the previous breakout base from early 2023.
3. The deep wick indicates a potential spring phase in a Wyckoff Accumulation pattern, where weak hands are flushed out.
4. A confirmed close above 2.65 would mark a structural shift — signaling a possible start of a new bullish leg.
5. On the other hand, a close below 1.92 would validate a macro breakdown, opening room for a prolonged bearish continuation.
---
Bullish Scenario (Potential Reversal)
Confirmation: A 4D candle close above 2.65, supported by increasing volume.
Technical narrative: After a long liquidation event, price tends to form a V-shaped rebound or base breakout once smart money steps back in.
🎯 Upside Targets:
Target 1 → 3.55 (local distribution zone)
Target 2 → 4.60 (key structural pivot)
Target 3 → 6.84 – 8.09 (major supply zone & prior 2024 top)
💡 If momentum builds, this could evolve into a multi-month recovery rally, similar to the early bull phase of 2024.
---
Bearish Scenario (Continuation Risk)
Confirmation: A 4D close below 1.92 confirms breakdown of the macro support.
Technical narrative: Once this zone fails, buyer exhaustion could drive price toward 1.50–1.20, the next historical liquidity pool.
🎯 Downside Targets:
Short-term support → 1.80
Extended range → 1.50 – 1.20
A proper reversal would then require a new long accumulation base forming at lower levels.
---
Technical Summary
TON is currently hovering within its largest accumulation zone in over a year.
This yellow block (2.20–1.92) will determine the next major trend:
Hold and reclaim 2.65 → bullish reversal confirmed.
Fail and close below 1.92 → macro breakdown confirmed.
At this stage, TON offers a high-risk, high-reward setup for swing traders — ideal for those waiting for clear structural confirmation before entry.
#TON #TONUSDT #CryptoAnalysis #TONCoin #TechnicalAnalysis #SwingTrade #BreakoutSetup #SupportAndResistance #Wyckoff #MarketStructure #AccumulationPhase #CryptoUpdate #PriceAction

TONCOIN (TON/USDT): Wave 5 or Impulse FailureTONCOIN (TON/USDT): Wave 5 or Impulse Failure
📈 Weekly Scenarios
Bullish scenario: Price holds above ~$2.70 and breaks through ~$3.90 → start of wave (3) or (5) up → target ~$5.00+.
Consolidation: Price remains in the ~$2.70-$3.90 range without a clear move, market paused.
Bearish scenario: Price breaks below ~$2.60-$2.70 with volume confirmation → start of a corrective wave → possible move to ~$2.10-$2.20.
✅ Conclusion
For the coming week, the technical picture for TON/USDT is on the verge of a reversal.
Holding support at ~$2.60-$2.70 and breaking above ~$3.90 could activate upward momentum.
A breakout below $2.60 is a signal for caution and a possible decline.
The wave count is still unclear, so it's important to monitor the price reaction at key levels.

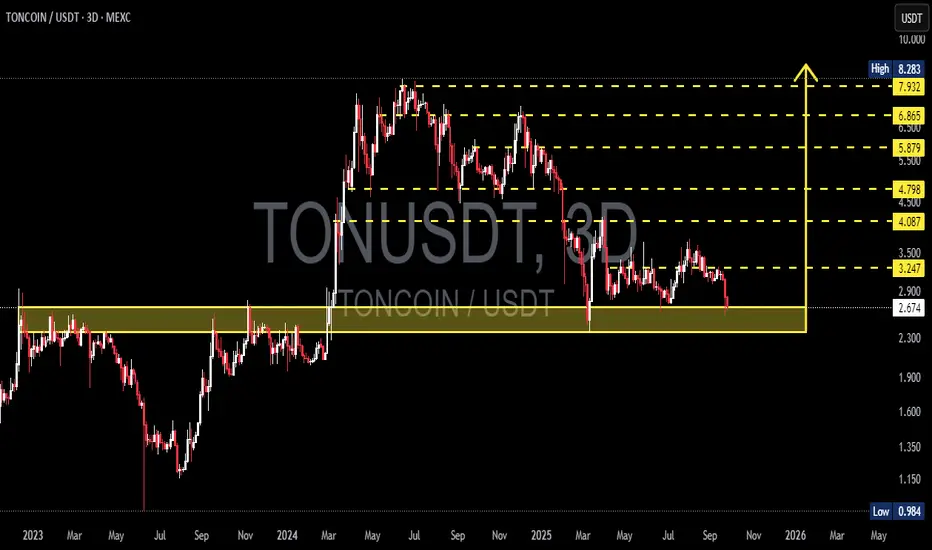
TON/USDT — Make-or-Break Level: Golden Support Zone Retest?Overview
TON/USDT is currently testing a critical historical support zone at $2.30 – $2.90. This is not just another technical level—it’s a battlefield between buyers and sellers that will determine the next major trend for TON in the coming months.
Since topping out at $8.283, TON has been carving a series of lower highs and lower lows, signaling a medium-term downtrend.
Now, price has returned to the golden zone (yellow box), an area that acted as strong resistance in 2023 – early 2024 before finally being broken to the upside.
This zone is now being retested as support—meaning we are at a make-or-break moment for TON’s long-term trajectory.
---
Bullish Scenario — Holding & Reversal
If this zone holds, TON could stage a strong rebound:
1. First target at $3.247.
2. A breakout above it could open the way to $4.087 – $4.798.
3. Further recovery may push TON back toward $5.879 → $6.865 → $7.932, and eventually its previous high at $8.283.
Bullish structure confirmation requires:
A higher low forming inside the golden box.
A clear breakout above $3.247 with strong volume.
This area could become the foundation for TON’s next major rally if buyers regain control.
---
Bearish Scenario — Breakdown & Deep Correction
If sellers dominate and price breaks below $2.30, the downside risk expands significantly:
1. Next support lies at $1.90.
2. Failure there opens the way to $1.35.
3. In an extreme bearish case, TON could revisit its chart low at $0.984, a drop of more than 60% from current levels.
This bearish case gains strength if:
We see a decisive 3D/weekly close below the box.
Retests back into the zone are rejected (false recovery).
---
Price Structure — Support/Resistance Flip
The current pattern is a classic S/R flip test:
The yellow zone was once major resistance.
After being broken, it flipped into major support.
Now, price is retesting it—meaning it will either bounce hard or break hard.
---
Trading Strategy & Risk Management
Conservative Approach: Wait for a clear 3D/weekly bullish rejection candle before entering. Target $3.247, with stop loss just below the zone (~$2.15).
Aggressive Approach: Scale in around $2.50–$2.70 with a stop below the zone. First target remains $3.247. Higher risk, but high potential reward if the bounce materializes.
Breakdown Play: If $2.30 is lost on strong volume, wait for a failed retest and short the breakdown. Targets: $1.90 → $1.35.
---
Conclusion
The $2.30 – $2.90 golden zone is TON’s battlefield.
Holding this level could spark a multi-stage recovery.
Losing it could trigger a deep correction to the 1.x range.
In such situations, patience and confirmation matter more than guessing.
---
#TON #TONCOIN #TONUSDT #CryptoAnalysis #TechnicalAnalysis #SupportResistance #CryptoTrading #PriceAction
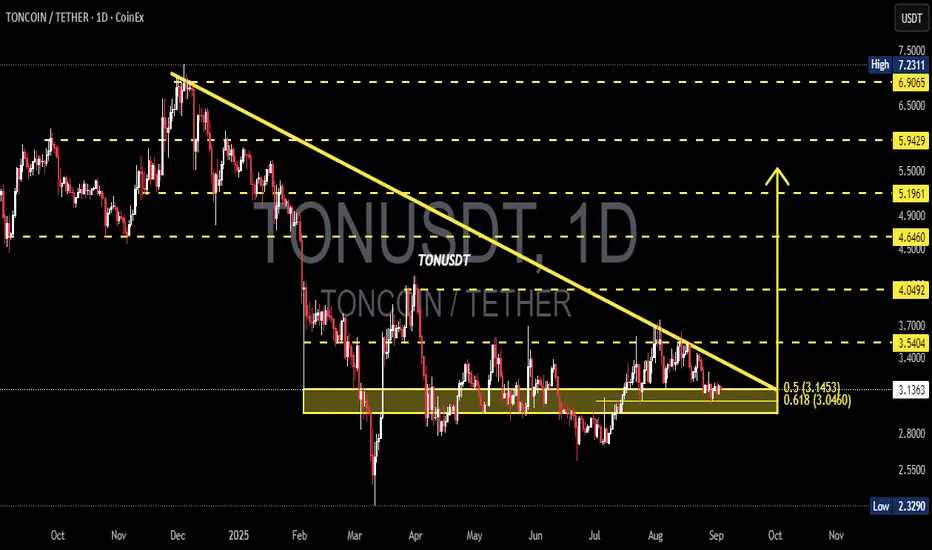
TON/USDT — Descending Triangle at 0.618 Fibonacci Support!🔎 Overview
TON is currently standing at a make-or-break moment. The daily chart shows a Descending Triangle pattern, where price has been consistently pressured by a downward trendline from the early-year highs, while being strongly defended by the key support zone around 3.04 – 3.14 USDT (Fibonacci 0.5–0.618).
This setup reflects a battle between buyers accumulating at demand and sellers pressing from above. Such compression usually leads to a strong breakout or breakdown as price approaches the triangle’s apex.
---
📌 Key Technical Levels
Current Price: 3.1365 USDT
Main Support Zone:
0.618 Fib = 3.0460
0.5 Fib = 3.1453
First Resistance / breakout zone: 3.5404
Next Resistances: 4.0492 → 4.6460 → 5.1961 → 5.9429
Major Downside Support: 2.3290 (previous low)
---
🟢 Bullish Scenario (Breakout Potential)
1. Bullish confirmation occurs if price holds above 3.046 and breaks the descending trendline with a strong daily close + high volume.
2. Further validation: a close above 3.5404 will likely open the path toward 4.05 and 4.64.
3. With strong momentum, extended targets lie around 5.19 – 5.94, and eventually the major high near 7.23.
4. Narrative: A bullish breakout from a descending triangle often signals a trend reversal from accumulation.
---
🔴 Bearish Scenario (Breakdown Risk)
1. If price fails to hold above 3.0460 and closes below on the daily chart, the descending triangle confirms a bearish continuation.
2. First downside target: 2.80–2.60, with ultimate support near 2.3290.
3. If breakdown comes with strong volume, panic selling could accelerate the move lower.
4. Narrative: A bearish breakdown usually extends the prior downtrend, pushing price back to previous cycle lows.
---
📐 Pattern & Market Sentiment
Descending Triangle: A consolidation pattern within a downtrend; statistically bearish but can turn bullish if breakout volume is significant.
Volume Factor: Confirmation is critical. Breakouts without volume often lead to fake moves.
Golden Ratio Support (0.5–0.618 Fib): A historically strong support and reversal area — losing it would shift momentum back to the bears.
---
📢 Conclusion
TON stands right above its final line of defense (0.618 Fib). If this zone holds and the descending trendline is broken, bulls could ignite a move toward 3.54 – 4.05+. But if 3.046 fails, bears may drag TON back to the 2.32 lows.
In short: TON is at a “do or die” stage — expect a major breakout or breakdown soon.
---
TON/USDT is trapped inside a descending triangle with a critical support zone at Fibonacci 0.5–0.618 (3.14–3.04).
📉 Breakdown below 3.046 → risk of drop to 2.32
📈 Breakout above 3.54 → potential rally to 4.05 – 4.64
A decisive move is near — watch the volume for confirmation!
#TON #TONUSDT #Crypto #Altcoin #TradingView #TechnicalAnalysis #Fibonacci #DescendingTriangle #Breakout #SupportResistance #ChartPattern
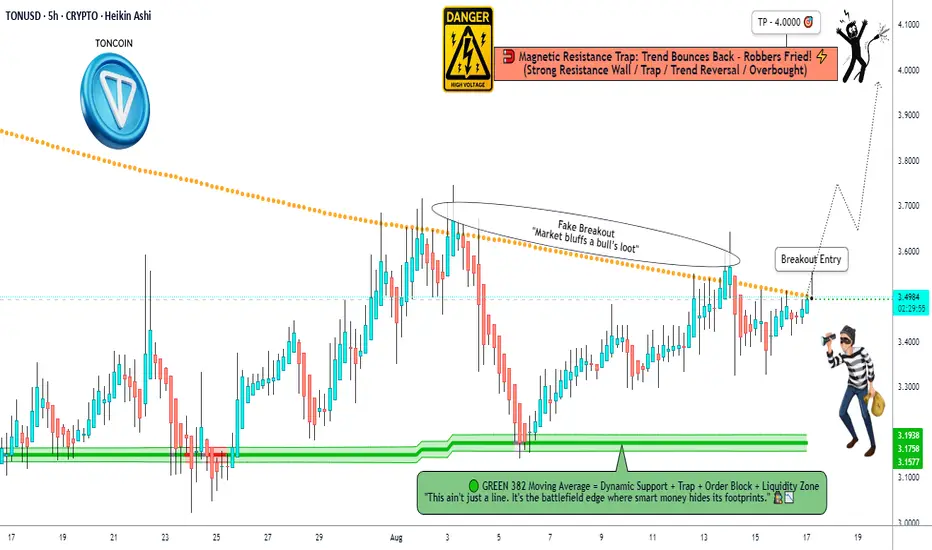
TON/USD Market Trap or Treasure? Decide Before 4.000!🚨TON/USD "TONCOIN vs U.S DOLLAR" Crypto Heist Plan 🚨
💎 Hello Thief OG’s, Money Grabbers & Market Shadows!
Today’s mission is locked 🔐 – we’re breaking into the TON/USD vault with a Bullish Heist Strategy.
🎯 Plan of Attack
Asset: TON/USD "TONCOIN vs U.S DOLLAR"
Mode: Bullish 🟢 (Heist in progress)
Entry (Thief Layers):
💰 Layer 1 @3.4900
💰 Layer 2 @3.4500
💰 Layer 3 @3.4000
💰 Layer 4 @3.3600
(You can add more layers – the deeper the vault, the sweeter the loot!)
Stop Loss (SL) 🛑: @3.2600 – This is the Thief Emergency Exit.
🔐 Adjust based on your own strategy & risk appetite.
Target (Escape Point) 🏆: @4.0000
⚡ “High Voltage Zone” ahead – escape with your loot before the alarms ring!
🕵️♂️ Thief Strategy Style
This is not a single-door entry – we’re layering multiple buy limit orders, stacking our positions like a true market bandit. 📊
Stay sharp – once the bags are full, we run with the profit! 🏃♂️💨
⚠️ Heist Rules for OG’s
Only rob the long side – trend is with the bulls. 🐂
Use trailing SL to protect stolen money 💵.
Don’t get caught in news traps – avoid new entries during 🔔 big announcements.
💥 Boost this plan 💥 if you’re riding with the Thief Crew!
Together, we rob the market – layer by layer, vault by vault. 💰🚀
📌 Disclaimer: This is a Thief Trading style heist plan, not financial advice. Trade with your own risk management.
TONUSDT Breaks Out of Bearish Grip! Is a Bullish Rally?🔎 1. Key Pattern: Descending Trendline Breakout + Reaccumulation Zone
After months of downward pressure, TONUSDT has successfully broken above a dominant descending trendline that has been acting as resistance since December 2024.
✅ This breakout occurred with a strong bullish candle and aligns perfectly with a significant historical resistance zone (around $3.00–$3.12).
📌 The area also overlaps with the Fibonacci retracement levels (0.5–0.618) — a zone where trend reversals often occur.
This indicates that the move isn't just noise — it might be the start of a mid-term bullish trend.
---
🧱 2. Consolidation Box = Reaccumulation Zone
TONUSDT spent nearly 4 months ranging sideways between $2.80 and $3.20, forming a clear reaccumulation range.
🔁 This kind of price action often precedes a strong breakout, as smart money accumulates before the next leg up.
🟨 This box now acts as a critical demand/support zone for any potential pullbacks.
---
📏 3. Key Levels to Watch (Support & Resistance)
✅ Bullish Targets (Resistance Levels):
🔹 $3.5404 → Immediate resistance
🔹 $4.0492 → Major resistance to break
🔹 $4.6460
🔹 $5.1961
🔹 $5.9429
🔹 $6.9065
🔹 Local High: $7.2311
🔻 Support Levels:
🔸 $3.1248 – $3.0099 → Key Fibonacci support (0.5–0.618)
🔸 $2.8000 → Bottom of reaccumulation range
🔸 $2.3290 → Major support (also the cycle low)
---
📈 Bullish Scenario (Primary Bias)
If price holds above the key zone at $3.00–$3.12, we could see:
A move towards $3.54 USDT
Breakout above $3.54 opens the door to $4.05 → $4.64 → $5.19 and beyond
A clear structure of higher highs and higher lows confirms trend reversal
Momentum remains strong as long as price respects the breakout zone.
---
📉 Bearish Scenario (Alternative Case to Watch)
If price fails to hold above $3.00 and breaks back below $2.80:
This would suggest a false breakout
Momentum may shift bearish again
Price could revisit the $2.32 support, negating the bullish setup
A return to sideways or even downtrend structure is possible
---
🧩 Strategic Conclusion
TONUSDT has broken out of a key descending trendline and reclaimed a strong structural zone, indicating early signs of a bullish cycle.
📊 Key Levels to Monitor Closely:
Support (validation zone): $3.00–$3.12
Immediate resistance: $3.54
Mid-term targets: $4.05 → $5.19 and higher
> As long as TON stays above the golden zone (Fibonacci 0.5–0.618), bulls have the upper hand.
---
📘 Pro Tips for Traders:
Watch for volume confirmation during retests
Be patient for pullback entries or breakout confirmations
Manage risk — don’t FOMO blindly
#TONUSDT #TONCOIN #CryptoBreakout #AltcoinAnalysis #TechnicalAnalysis #CryptoTrading #TON #Reaccumulation #BreakoutSetup #FibonacciSupport #BullishReversal #TONBullish

TONUSDT continue up!Looking for an Impulse Up – TONUSDT Outlook
TONUSDT is showing momentum to the upside as it continues its current structure, possibly developing another impulsive leg.
It’s important to follow your own trading plan and maintain proper risk-reward (RR) discipline.
This idea is shared for educational purposes only to support your learning.
Got questions? Feel free to drop them in the comments!
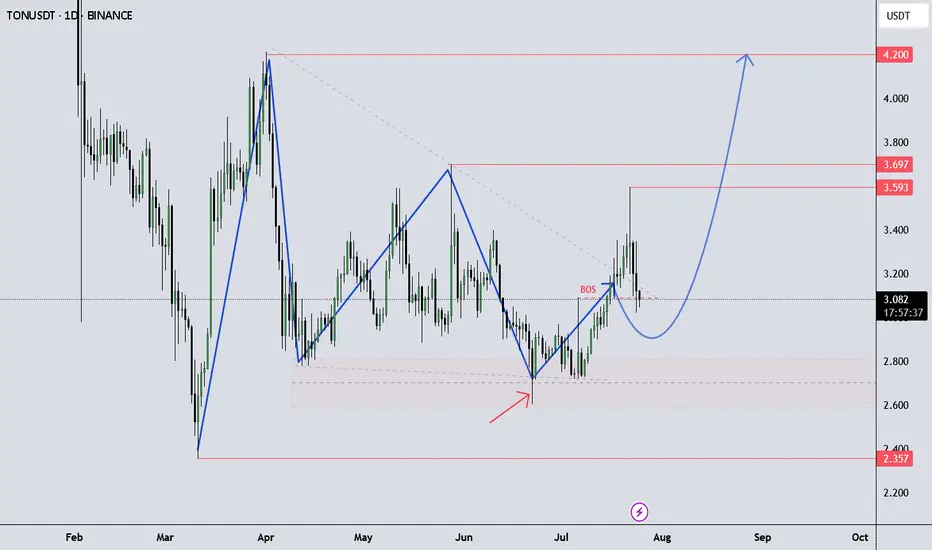
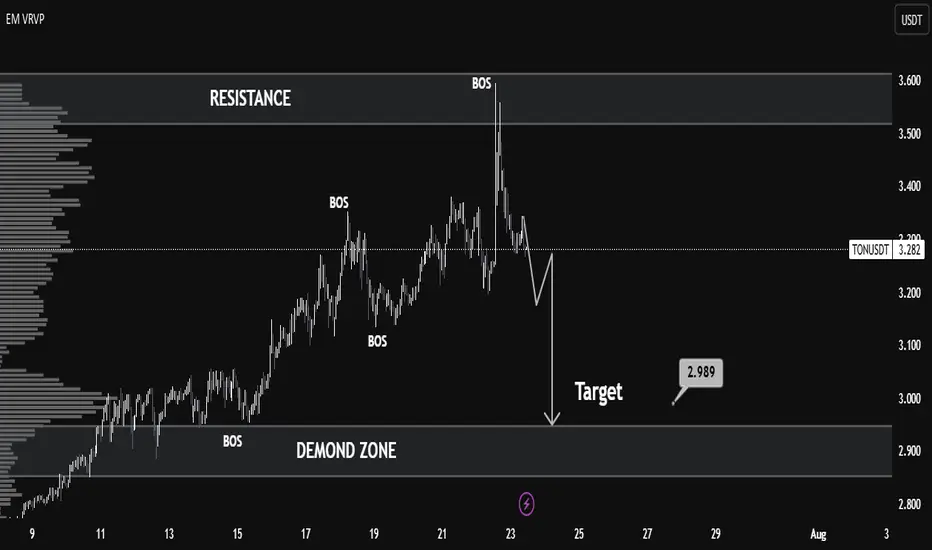
TONUSDT Technical Analysis – Bearish Shift with Clean TargetMarket Context:
TONUSDT recently showed strong bullish momentum, breaking multiple structure levels (noted as BOS – Break of Structure), indicating a clear uptrend. However, the most recent price action reveals a sharp rejection from the resistance zone around 3.55–3.60, marking a significant trend reversal.
Key Levels:
Resistance: 3.55 – 3.60
Price tested this zone and was strongly rejected, forming a potential top.
Demand Zone: 2.88 – 2.99
This zone provided previous accumulation and serves as a probable liquidity area and downside target.
Target: 2.989
The chart marks this as the near-term bearish objective, aligning with the volume node and prior demand.
Technical Signals:
Multiple BOS (Break of Structure):
Confirmed bullish structure earlier, but the latest BOS downward indicates a possible trend reversal.
Volume Profile (VRVP):
Shows high volume nodes around 3.00, suggesting strong market interest at lower levels — acting as a magnet for price.
Bearish Market Structure:
After the peak, the lower highs and lower lows pattern reflects short-term bearish dominance.
Liquidity Grab & Selloff:
The spike above resistance likely induced liquidity before a rapid selloff — classic distribution behavior.
Outlook:
If the market fails to reclaim levels above 3.35, a bearish continuation toward 2.989 remains likely.
The demand zone (2.88–2.99) is a critical area where buyers may re-enter — look for reversal signals here.
Conclusion:
TONUSDT has shifted from bullish to bearish in the short term. A clean rejection from resistance and strong structural breaks suggest a move toward the 2.989 demand zone. Traders should watch for confirmation of support or continuation upon reaching this level.
Ton USDT Buy Setup / Long SetupTon entry at current market price 3.305 , SL if 1 day closes below the mentioned zone. Otherwise holding ton for breakout towards 4-4.5$. use low risk amount as BTC can retrace.

Ton USDT Intraday Setup / Long SetupTake with tight SL, an easy 2RR, take it at cmp (Current Market Price), While if you holding spot bag, it can easily hit 4.5-5$ mark in this week. Best Of Luck
TONCOIN Preparing for Liftoff from the Golden Zone! Potential UpDetailed Breakdown:
🔶 Major Support Zone (Golden Accumulation Area):
TON is currently trading within a strong support zone between 2.839 - 2.300, which previously acted as a key resistance throughout 2023. This zone now serves as a high-probability accumulation area.
🔶 Double Bottom Structure & Reversal Potential:
The price action is forming a potential double bottom pattern, often signaling a major reversal after a prolonged downtrend. This is also supported by sideways consolidation on the support with decreasing selling momentum.
🔶 Bullish Targets (Based on Fibonacci & Historical Resistance):
If a bounce occurs from this golden support area, TON could rally towards the following key resistance levels:
🎯 Target 1: 3.247
🎯 Target 2: 4.087
🎯 Target 3: 4.798
🎯 Target 4: 5.879
🎯 Target 5: 6.865
🎯 Target 6: 7.932
🎯 Ultimate Target (ATH): 8.283
🔶 Maximum Potential Upside:
From the current level (around 2.839) to the all-time high (8.283), TON presents a +190% upside opportunity in a full bullish scenario.
Trading Strategy:
✅ Buy Zone: Accumulate within the golden support box (2.3 - 2.8 USDT)
🔁 Additional Entry: Upon breakout confirmation above 3.25 USDT
❌ Stop Loss: Below 2.2 USDT with strong bearish volume
📈 Take Profit Levels: Use resistance levels as partial TP targets
Conclusion:
TONCOIN is positioned at a technically significant support area, offering a high-risk-reward opportunity for swing traders and mid-term investors. A bullish reaction from this zone could initiate a strong multi-wave rally. Watch for breakout confirmation with volume before entering aggressively.
#TON #TONCOIN #CryptoBreakout #AltcoinSetup #TONUSDT #SwingTrade #BullishPattern #CryptoSignals #FibonacciLevels #TechnicalAnalysis

TON Looks Ready to Collapse — Is This the Start of a Bull Trap?Yello Paradisers! what if TON is about to reverse hard—are you positioned correctly, or will you be caught chasing the wrong move?
💎TONUSDT is showing clear bearish signs that can’t be ignored. The price has broken down from an ascending channel—a classic early signal of weakness. But that’s not all. This breakdown happened right at the resistance zone, and it’s backed by a clear bearish divergence on momentum indicators. Adding to the conviction, there’s a 1H Fair Value Gap (FVG) sitting right in that same region, which often acts as a magnet for price before continuation to the downside.
💎This confluence significantly increases the probability of a bearish move in the short term. So, what’s the plan?
💎For risk-averse (safe) traders, the optimal approach is to wait for a pullback and retest of the broken structure. This allows for a cleaner entry and a much better risk-to-reward (RR) ratio. For the aggressive players, there’s potential to enter with reduced size from the current level, understanding that it carries more risk without confirmation.
💎However, if the price manages to break out and closes candle above the resistance zone, this entire bearish setup becomes invalidated. In that case, the smart play is to stay patient and wait for a more favorable structure or price action to develop.
🎖If you want to be consistently profitable, you need to be extremely patient and always wait only for the best, highest probability trading opportunities.
MyCryptoParadise
iFeel the success🌴

TONUSDT 1D AnalysisTON ~ 1D Analysis
#TON Buy back gradually from here with a short term target of at least 15%+, Long term target $8
TONUSDT 1D AnalysisTON ~ 1D Analysis
#TON Buy after successfully breaking this resistance line with a short term target of at least 15%+ from here.

TONUSDT 3DTON ~ 3D Analysis
#TON Buy back when testing this support with a short -term target of at least 20%+.

TONUSDT 3DTON ~ 3D Analysis
#TON Support blocks that you might be able to consider to start buying again from here, with a short -term target of at least 15%+.

TONUSDT 2DTON ~ 2D Analysis
#TON Buy gradually from here. This is a very good buy place for now. With a short -term target of at least 15%+.

#TONUSDT is testing resistance – expecting a breakout!📈 LONG BYBIT:TONUSDT.P from $3.8920
🛡 Stop Loss: $3.8525
⏱️ 1H Timeframe
✅ Overview:
➡️ BYBIT:TONUSDT.P is testing $3.8880 resistance, and a breakout could lead to further upside.
➡️ Price remains above POC $3.81, confirming strong buyer interest.
➡️ Rising volume supports the potential bullish move.
⚡️ Plan:
➡️ Bullish confirmation requires a strong close above $3.8920.
➡️ If price slows down at $3.9400, partial profit-taking is recommended.
➡️ A drop below $3.8525 invalidates the setup.
🎯 Take Profit:
💎 TP1: $3.9400 – first profit-taking zone.
💎 TP2: $3.9800 – final upside target.
📢 BYBIT:TONUSDT.P Holding above $3.8920 opens the door for further gains. Watch volume closely – if it weakens, price may consolidate.
📢 Partial profit-taking recommended at $3.9400.
📢 If price drops below $3.8525, the setup is invalidated
🚀 BYBIT:TONUSDT.P is testing resistance – expecting a breakout!

TONUSDT 3DTON ~ 3D
#TON If you still have Conviction on this coin,. buy gradually within this support block with a target of at least 20%+

TONUSDT 3DTON ~ 3D
#TON This is a bullish pattern,. Buy gradually inside this pattern,. with a target of at least 20%+ from here. it is only a matter of time that this resistance line is successfully penetrated.

TONUSDT Primed for Liftoff After Rebounding from Key SupportOKX:TONUSDT has shown impressive resilience with a strong bounce off a major support level. This positive price action is further reinforced by a breakout from a prevailing trendline, accompanied by robust trading volume. These technical indicators suggest a potential for significant upward movement in the near future. While the outlook is bullish, it's crucial to manage risk effectively by implementing appropriate stop-loss orders to protect your investment.
OKX:TONUSDT Currently trading at $6
Buy level: Above $6
Stop loss: Below $5
Target : $12
Max Leverage 3x
Always keep Stop loss
Follow Our Tradingview Account for More Technical Analysis Updates, | Like, Share and Comment Your thoughts

