TONUSDT 1,985% profits potential with 5X leverage —LONG tradeToncoin has been on a retrace since January 4, 23 days. The market here has been bearish since June 2024. Bearish volume peaked August 2024, it has been dropping since. The last few months, trading volume came to a halt.
We have a long-term higher low based on candle close. December 2025 is a higher low compared to July 2023.
Late January 2026 is a higher low compared to last month. Here we can expect the start of a new bullish wave. Notice how many sessions have been closing red, seven total. These are three days candles.
We are witnessing an extended retrace. As soon as this retrace is over, Toncoin is set to grow. The best time to buy is now, the market is red and the action is very close to support, an entry-zone.
Full Toncoin leveraged trade-numbers below:
_____
LONG TONUSDT
Leverage: 5X
Potential: 1985%
Allocation: 5%
Entry zone: $1.40 - $1.55
Targets:
1) $1.76
2) $1.97
3) $2.31
4) $2.58
5) $2.86
6) $3.25
7) $3.75
8) $4.44
9) $5.19
10) $6.08
11) $6.71
12) $7.51
Stop: Close weekly below $1.35
_____
Thanks a lot for your continued support.
Great entry timing.
Namaste.
Tonusdtlong

#TON/USDT Trendline Break & Double Bottom#TON
The price is moving within a descending channel on the hourly timeframe. It has reached the lower boundary and is heading towards a breakout, with a retest of the upper boundary expected.
The Relative Strength Index (RSI) is showing a downward trend, approaching the lower boundary, and an upward bounce is anticipated.
There is a key support zone in green at 1.48, and the price has bounced from this level several times. Another bounce is expected.
The indicator is showing a trend towards consolidation above the 100-period moving average, which we are approaching, supporting the upward move.
Entry Price: 1.52
Target 1: 1.54
Target 2: 1.56
Target 3: 1.59
Stop Loss: Below the green support zone.
Remember this simple thing: Money management.
For any questions, please leave a comment.
Thank you.

#TON/USDT Trendline Break & Double Bottom#TON
The price is moving within a descending channel on the hourly timeframe. It has reached the lower boundary and is heading towards a breakout, with a retest of the upper boundary expected.
The Relative Strength Index (RSI) is showing a downward trend, approaching the lower boundary, and an upward bounce is anticipated.
There is a key support zone in green at 1.49, and the price has bounced from this level several times. Another bounce is expected.
The indicator is showing a trend towards consolidation above the 100-period moving average, which we are approaching, supporting the upward move.
Entry Price: 1.52
Target 1: 1.55
Target 2: 1.58
Target 3: 1.61
Stop Loss: Below the green support zone.
Remember this simple thing: Money management.
For any questions, please leave a comment.
Thank you.

#TON/USDT Trendline Break & Double Bottom#TON
The price is moving within a descending channel on the hourly timeframe. It has reached the lower boundary and is heading towards a breakout, with a retest of the upper boundary expected.
The Relative Strength Index (RSI) is showing a downward trend, approaching the lower boundary, and an upward bounce is anticipated.
There is a key support zone in green at 1.70, and the price has bounced from this level several times. Another bounce is expected.
The indicator is showing a trend towards consolidation above the 100-period moving average, which we are approaching, supporting the upward move.
Entry Price: 1.74
Target 1: 1.77
Target 2: 1.81
Target 3: 1.85
Stop Loss: Below the green support zone.
Remember this simple thing: Money management.
For any questions, please leave a comment.
Thank you.

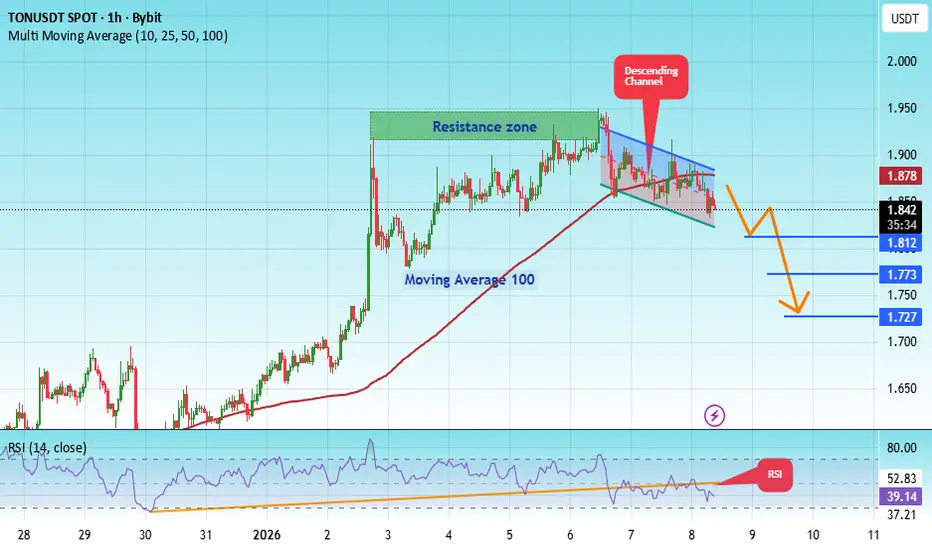
#TON/USDT : Short Wave Still In Progress#TON
The price is moving in a descending channel on the 1-hour timeframe. It has reached the upper limit and is heading towards breaking downwards, with a retest of the upper limit expected.
We have an upward trend on the RSI indicator, which has reached near the upper limit, and a downward reversal is expected.
There is a major resistance zone in green at 1.94. The price has bounced from this zone multiple times and is expected to bounce again.
We have a trend of consolidation above the 100-period moving average, as we are moving close to it, which supports a downward move towards touching it.
Entry price: 1.84
First target: 1.81
Second target: 1.77
Third target: 1.72
Stop loss: Above the resistance zone in green.
Don't forget a simple thing: money management.
For inquiries, please leave a comment.
Thank you.
#TON/USDT : Trendline Break & Double Bottom#TON
The price is moving in a descending channel on the 1-hour timeframe. It has reached the lower boundary and is heading towards breaking above it, with a retest of the upper boundary expected.
We have a downtrend on the RSI indicator, which has reached near the lower boundary, and an upward rebound is expected.
There is a key support zone in green at 1.53. The price has bounced from this zone multiple times and is expected to bounce again.
We have a trend towards stability above the 100-period moving average, as we are moving close to it, which supports the upward movement.
Entry price: 1.60
First target: 1.64
Second target: 1.69
Third target: 1.755
Stop loss: Below the support zone in green.
Don't forget a simple thing: capital management.
For inquiries, please leave a comment.
Thank you.

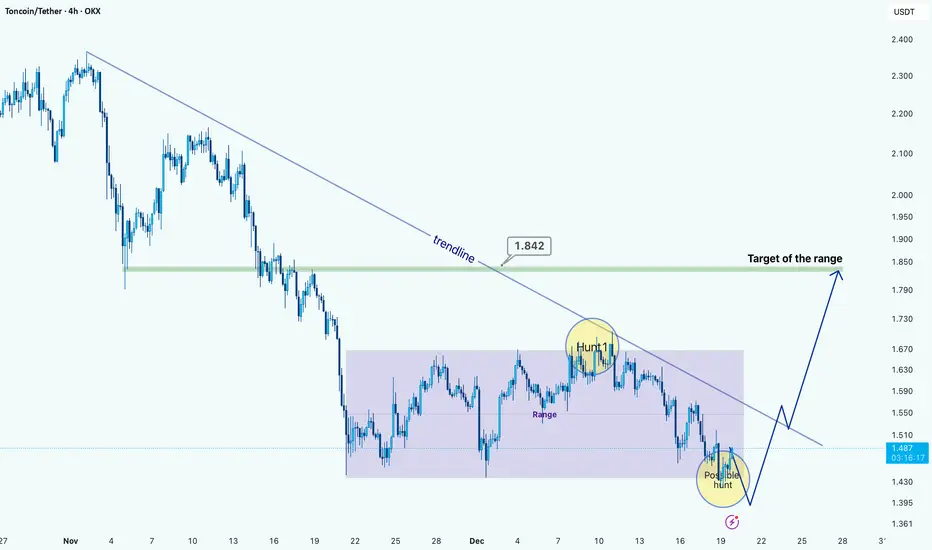
TON/USDT: Range Structure Within a Broader DowntrendHi!
TON is still trading under a well-defined descending trendline, confirming that the higher-timeframe structure remains bearish. After the impulsive sell-off, the price transitioned into a clear consolidation range, highlighted on the chart. This range shows multiple reactions at both extremes, validating it as an accumulation/distribution zone rather than random price action.
A notable liquidity hunt occurred near the upper boundary of the range, where price briefly swept highs and was immediately rejected, aligning with the descending trendline and reinforcing it as dynamic resistance. Currently, price is trading near the lower boundary of the range, where another potential liquidity sweep may occur before a directional move.
Bullish scenario: A downside sweep below the range lows, followed by strong acceptance back inside the range, could trigger a reversal toward the range high near 1.84, which also aligns with the descending trendline and acts as a logical target.
Bearish scenario: Failure to reclaim the range after a breakdown would confirm continuation of the downtrend, exposing lower supports.
TONUSD: Wave Structure in Search of Growth ImpulseTONUSD: Wave Structure in Search of Growth Impulse
TONUSD Wave Overview (D1 and H4)
As a trader who has been practicing wave analysis for over ten years, I note that the current picture for TONUSD shows the end of an extended corrective phase and the potential for a new movement.
D1 Chart: The global structure indicates that the market is gradually breaking out of its sideways range. The wave formation looks like the end of a correction, laying the foundation for the next impulse.
H4 Chart: Local dynamics confirm the first signs of an impulse. Key entry points are forming here, which could mark the beginning of a larger wave.
Main Scenario
After the completion of the corrective phase, a downward impulse sequence is expected to develop. This movement may be accompanied by increased seller activity and a shift in focus to the downside.
Alternative Scenario
If the price holds above local peaks and forms a stable upward impulse structure, the focus will shift to continued growth. In this case, the correction will be considered incomplete, and TONUSD may experience an additional rebound.
Trading Idea
Conservative approach: wait for confirmation of a breakout of key levels and enter with the trend.
Aggressive approach: use local impulses on H4 for earlier entries, but with tight stops.
In both cases, it is important to maintain strict risk management and adjust the plan as new impulses emerge.
Results
TONUSD is at a crossroads between the end of the correction and the beginning of a new impulse. The wave structure on D1 and H4 provides clear guidelines for action: watch for confirmation of the scenario and act with discipline.

#TON/USDT : Trendline Break & Double Bottom#TON
The price is moving in a descending channel on the 1-hour timeframe. It has reached the lower boundary and is heading towards a breakout, with a retest of the upper boundary expected.
We are seeing a bearish trend in the Relative Strength Index (RSI), which has reached near the lower boundary, and an upward bounce is expected.
There is a key support zone in green at 1.39, and the price has bounced from this level several times. Another bounce is expected.
We are seeing a trend towards stabilizing above the 100-period moving average, which we are approaching, supporting the upward trend.
Entry Price: 1.47
First Target: 1.48
Second Target: 1.52
Third Target: 1.57
Remember a simple principle: Money Management.
Place your stop-loss order below the green support zone.
For any questions, please leave a comment.
Thank you.

TONUSDT : Bearish Breakdown with Mini Retest PotentialTONUSDT 30-Minute Chart Analysis: Bearish Breakdown with Mini Retest Potential
The analysis hints at a bearish continuation after a volatile upswing, with annotations suggesting a "Pattern Must" (possibly "must fail" or "must hold") and a "Mini Retesting" zone where price might stabilize before deciding direction. I'll expand on this below in a TradingView Idea-style format, adding more depth with historical context, pattern implications, and broader market ties for TON in late 2025.
Chart Overview
The x-axis displays time in 6-hour increments from 06:00 on December 6 onward, covering intraday swings into December 7 and projections to December 9. The y-axis scales prices from about 1.545 to 1.625 USDT, with the ask price marked at 1.577 (red) and bid at 1.576 (blue? – appears as "Ask 1.577 Bid 1.576").
Candlestick Sequence: Starting left, there's a bearish drop with red candles, followed by a sharp bullish rally (green candles climbing to ~1.615 around December 6, 18:00). This peaks and reverses with a cluster of red candles, forming a top around December 7, 06:00. Post-peak, price consolidates with smaller mixed candles, then drops sharply near the center, labeled "Pattern Must." The right side shows fading momentum, with a projection line sloping downward.
Trendline and Projections: A descending black trendline from the peak projects future downside, pointing toward lower levels by December 8–9. This acts as resistance, with price hugging it during the decline.
Key Annotations:
"Pattern Must": Labeled with an arrow at a sharp drop around 1.585, suggesting a critical pattern (e.g., head-and-shoulders or double top) that "must" play out bearishly. The word "Must" implies inevitability in the analyst's view, perhaps a must-fail bull trap.
"Mini Retesting" Zone: A green horizontal box around 1.565–1.570, with a circle dot, indicating a minor retest of support. This could be a brief pause where price checks former resistance-turned-support.
"Volume Burst": Below the retest zone, highlighting a potential surge in trading volume at lows, which might signal capitulation or accumulation.
Lightning Bolt Icon: At the bottom, similar to volatility warnings, possibly denoting a high-impact event like news (e.g., Telegram ecosystem updates affecting TON).
Horizontal red line at ~1.575 acts as a pivot.
Overall, the chart captures TON's typical crypto volatility, influenced by factors like Telegram integrations, NFT/adoption news, or broader market correlations with BTC/ETH in 2025.
Technical Analysis Breakdown
Expanding on the visuals with deeper indicators and context:
Trend and Momentum: The initial rally from ~1.550 (December 6) to 1.615 forms an impulsive wave, potentially Wave 3 in Elliott terms, followed by a corrective pullback. The descending trendline confirms lower highs, signaling bearish control. Momentum appears waning on the right, with smaller candle bodies – a sign of exhaustion.
Support/Resistance and Zones:
Resistance: Peak at 1.615 and the trendline (~1.590 declining). Breaking above could negate the bearish setup.
Support: "Mini Retesting" at 1.565, with "Volume Burst" implying buyer interest. Lower supports at 1.550 (chart low) or psychological 1.500.
Volume: 14.0B is substantial for TON, suggesting institutional interest; bursts at lows could indicate smart money entry.
Patterns and Signals:
Potential Head-and-Shoulders or Double Top: The "Pattern Must" points to a topping formation – left shoulder rally, head at 1.615, right shoulder weaker. Neckline break at ~1.585 triggers downside targets (project to 1.515, height subtracted).
Retest Dynamics: The "Mini Retesting" suggests a quick backtest of the breakdown level, common in ICT (Inner Circle Trader) concepts for liquidity grabs before continuation.
Projection Implications: The downward line forecasts a test of 1.545 by December 8, aligning with Fibonacci 61.8% retracement from the rally base.
Broader Context: In 2025, TON has seen growth from Telegram's 900M+ users, but faces competition from Solana/ETH. Recent dips might tie to regulatory news or market-wide corrections.
If indicators like RSI/MACD were overlaid (not shown), we'd likely see overbought at peaks (>70) and divergence at lows, supporting a reversal tease.
Trade Idea: Short Bias with Retest Entry
Leveraging the chart's bearish lean:
Bearish Setup (Primary): Short on failure of "Mini Retesting" (break below 1.565). Entry: 1.564. Stop Loss: Above trendline at 1.580 (risk ~1%). Take Profit: 1.545 (initial), then 1.520 (extension). R:R 1:2+. Rationale: "Pattern Must" implies continuation, amplified by volume bursts flushing weak hands.
Bullish Counter-Trade (Risky): If "Volume Burst" holds and price reclaims 1.575, long for a squeeze. Entry: Above 1.578. Stop Loss: Below 1.560. Take Profit: 1.600 (prior high). This bets on the retest as a fakeout bottom.
Position Sizing: Limit to 0.5-1% risk, use leverage cautiously (e.g., 5x on Binance). Watch correlations: TON often moves with BTC; if BTC dumps, amplify downside.
Always incorporate news – e.g., Telegram Wallet updates could spark reversals.
Key Insights and Mindsets for Traders
Drawing from TradingView wisdom and crypto trading psychology:
Mindset 1: Respect the Pattern: "Pattern Must" reminds us patterns aren't guarantees but probabilities. Backtest similar TON setups historically for edge.
Mindset 2: Volume Tells the Story: Don't ignore "Volume Burst" – it's where real moves start. In crypto, spikes often precede 20-50% swings; use it to confirm entries.
Mindset 3: Scale Timeframes: This 30-min view is tactical; zoom to 4H/Daily for confirmation. TON's 2025 uptrend (from ~$2 earlier? – check live) might make this a dip-buy opportunity.
Mindset 4: Event Awareness: The lightning bolt screams "catalyst watch." Monitor X/Telegram for TON news; volatility spikes on announcements.
Mindset 5: Risk First: In volatile assets like TON, preserve capital. Use the retest zones for defined stops, avoiding emotional FOMO.
This detailed breakdown positions the chart as a bearish alert with reversal caveats. For live updates, check TradingView or Binance directly. DYOR, and consider #TON #Crypto #TechnicalAnalysis for community input!

#TON/USDT (TON/USDT): Trendline Break & Double Bottom#TON
The price is moving within an ascending channel on the 1-hour timeframe and is adhering to it well. It is poised to break out strongly and retest the channel.
We have a downtrend line on the RSI indicator that is about to break and retest, which supports the upward move.
There is a key support zone in green at the price of 1.47, representing a strong support point.
We have a trend of consolidation above the 100-period moving average.
Entry price: 1.50
First target: 1.53
Second target: 1.58
Third target: 1.63
Don't forget a simple money management rule:
Place your stop-loss order below the support zone in green.
Once you reach the first target, save some money and then change your stop-loss order to an entry order.
For any questions, please leave a comment.
Thank you.

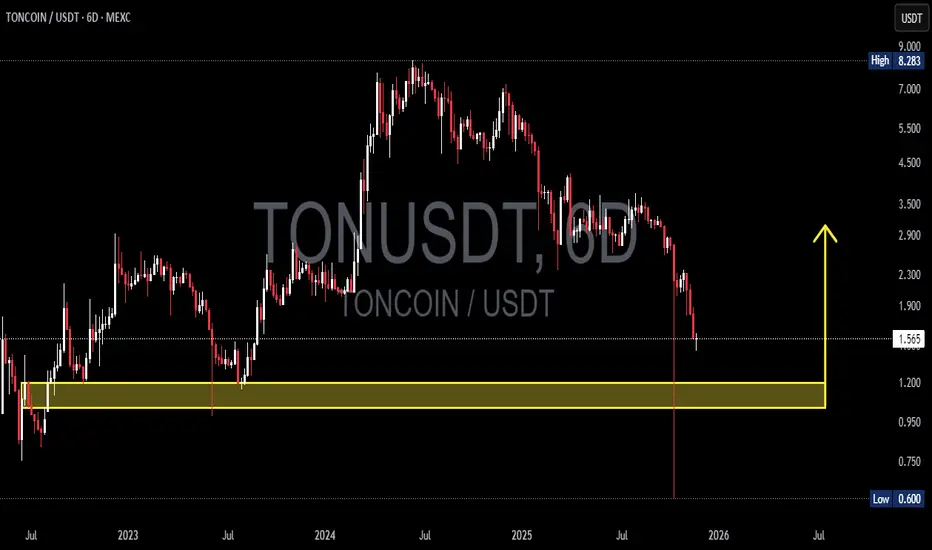
TON/USDT — Reversal Setup or Deeper Breakdown Ahead?On the 6D timeframe, TON has reached its most critical level since 2023. After forming a macro top near 8.28, the market shifted into a clean sequence of lower highs and lower lows, signaling sustained bearish control.
And now… price has landed directly inside the historical accumulation zone at 1.20 – 1.03 — a golden area that has repeatedly dictated long-term trend direction.
This isn’t just another support zone.
This is a psychological battleground, where major buyers stepped in previously and triggered multi-month rallies.
---
🔥 Why the 1.20 – 1.03 Zone Matters So Much
It has served as a macro pivot zone in previous cycles.
Every major uptrend in TON began with accumulation inside this area.
Holding this zone = potential multi-month bullish reversal.
Losing this zone = full transition into a macro bearish cycle.
TON is standing on the edge:
Either it rebounds explosively, or it breaks down toward levels not visited in years.
---
📈 Bullish Scenario — “Rebound from the Sacred Zone”
This scenario gains strength if:
1. Price prints a strong reversal inside 1.03–1.20 (pin bar / bullish engulfing).
2. A 6D candle closes back above 1.20 → confirms demand.
3. Breakout above 1.90–2.30 → confirms a macro trend shift.
If confirmed, upside targets are:
First target: 2.30
Expansion target: 3.50
Mid-cycle target: 5.00+
This could mark the beginning of TON’s next bullish cycle — but only with proper confirmation.
---
📉 Bearish Scenario — “Freefall Toward Extreme Lows”
Bearish continuation becomes likely if:
1. Price fails to hold the 1.03–1.20 support zone.
2. A 6D candle closes below 1.00 → macro support officially broken.
If breakdown confirms, downside targets become:
0.80
And potentially a retest of 0.60 (the previous flash-low wick).
A clean break below the yellow zone signals the end of TON’s multi-year bullish structure and opens the door for deeper corrective moves.
---
TON has entered the most decisive zone of the past two years.
The 1.03–1.20 range will determine whether TON launches a new bullish expansion…
or whether the market continues the strong downtrend toward 0.80–0.60.
The reaction inside this zone will dictate TON’s direction into 2026.
#TON #TONUSDT #CryptoTA #MarketStructure #SupportZone #PriceAction #CryptoTrading #ReversalZone
TON/USDT — Defense Zone at 2.20–1.92: Reversal or Breakdown?TON is now standing at a critical inflection point — the 2.20–1.92 zone (yellow block).
This area isn’t just another support level — it’s the make-or-break zone that will decide whether TON will rebound for a macro reversal or collapse into a deeper downtrend.
After a sharp fall from the 8.28 high, price has reached its historical demand base, showing a strong wick rejection below support — a classic sign of liquidity sweep or stop-hunt, often marking the final shakeout before larger players begin accumulating.
However, without a clear structure break and volume confirmation, the risk of a fake bounce remains high.
---
Structure & Pattern Analysis
1. Macro trend remains bearish, with a series of lower highs and lower lows since the 2024 peak.
2. The 2.20–1.92 zone represents a major accumulation range, also aligning with the previous breakout base from early 2023.
3. The deep wick indicates a potential spring phase in a Wyckoff Accumulation pattern, where weak hands are flushed out.
4. A confirmed close above 2.65 would mark a structural shift — signaling a possible start of a new bullish leg.
5. On the other hand, a close below 1.92 would validate a macro breakdown, opening room for a prolonged bearish continuation.
---
Bullish Scenario (Potential Reversal)
Confirmation: A 4D candle close above 2.65, supported by increasing volume.
Technical narrative: After a long liquidation event, price tends to form a V-shaped rebound or base breakout once smart money steps back in.
🎯 Upside Targets:
Target 1 → 3.55 (local distribution zone)
Target 2 → 4.60 (key structural pivot)
Target 3 → 6.84 – 8.09 (major supply zone & prior 2024 top)
💡 If momentum builds, this could evolve into a multi-month recovery rally, similar to the early bull phase of 2024.
---
Bearish Scenario (Continuation Risk)
Confirmation: A 4D close below 1.92 confirms breakdown of the macro support.
Technical narrative: Once this zone fails, buyer exhaustion could drive price toward 1.50–1.20, the next historical liquidity pool.
🎯 Downside Targets:
Short-term support → 1.80
Extended range → 1.50 – 1.20
A proper reversal would then require a new long accumulation base forming at lower levels.
---
Technical Summary
TON is currently hovering within its largest accumulation zone in over a year.
This yellow block (2.20–1.92) will determine the next major trend:
Hold and reclaim 2.65 → bullish reversal confirmed.
Fail and close below 1.92 → macro breakdown confirmed.
At this stage, TON offers a high-risk, high-reward setup for swing traders — ideal for those waiting for clear structural confirmation before entry.
#TON #TONUSDT #CryptoAnalysis #TONCoin #TechnicalAnalysis #SwingTrade #BreakoutSetup #SupportAndResistance #Wyckoff #MarketStructure #AccumulationPhase #CryptoUpdate #PriceAction

TONCOIN (TON/USDT): Wave 5 or Impulse FailureTONCOIN (TON/USDT): Wave 5 or Impulse Failure
📈 Weekly Scenarios
Bullish scenario: Price holds above ~$2.70 and breaks through ~$3.90 → start of wave (3) or (5) up → target ~$5.00+.
Consolidation: Price remains in the ~$2.70-$3.90 range without a clear move, market paused.
Bearish scenario: Price breaks below ~$2.60-$2.70 with volume confirmation → start of a corrective wave → possible move to ~$2.10-$2.20.
✅ Conclusion
For the coming week, the technical picture for TON/USDT is on the verge of a reversal.
Holding support at ~$2.60-$2.70 and breaking above ~$3.90 could activate upward momentum.
A breakout below $2.60 is a signal for caution and a possible decline.
The wave count is still unclear, so it's important to monitor the price reaction at key levels.

#TON/USDT Consolidation Buy After Sell-Off#TON
The price is moving in a descending channel on the 1-hour frame and is expected to break it and continue upward.
We have a trend to stabilize above the 100 moving average again.
We have a downtrend on the RSI indicator that supports the upward move with a breakout.
We have a major support area in green that pushed the price higher at 2.12.
Entry price: 2.15.
First target: 2.16.
Second target: 2.18.
Third target: 2.21.
To manage risk, don't forget stop loss and capital management.
The stop loss is below the support area in green.
When the first target is reached, save some profits and then change the stop order to an entry order.
For inquiries, please comment.
Thank you.

A TON of Hope — or Just a Slope?I expect TON/USDT to rebound toward 2.26.
The invalidation zone is marked in red on the chart.
Still, let’s keep our feet on the ground — we all remember that recent crash.
So far, there are no strong signals of a new bullish trend.
This move up looks more like a correction phase inside a broader bearish structure, not the start of something bigger.
Trade wisely — not emotionally

#TON/USDT Consolidation Buy After Sell-Off#TON
The price is moving within a descending channel on the 1-hour frame, adhering well to it, and is heading for a strong breakout and retest.
We have a bearish trend on the RSI indicator that is about to be broken and retested, which supports the upward breakout.
There is a major support area in green at 2.15, representing a strong support point.
We are heading for consolidation above the 100 moving average.
Entry price: 2.30
First target: 2.38
Second target: 2.47
Third target: 2.58
Don't forget a simple matter: capital management.
When you reach the first target, save some money and then change your stop-loss order to an entry order.
For inquiries, please leave a comment.
Thank you.

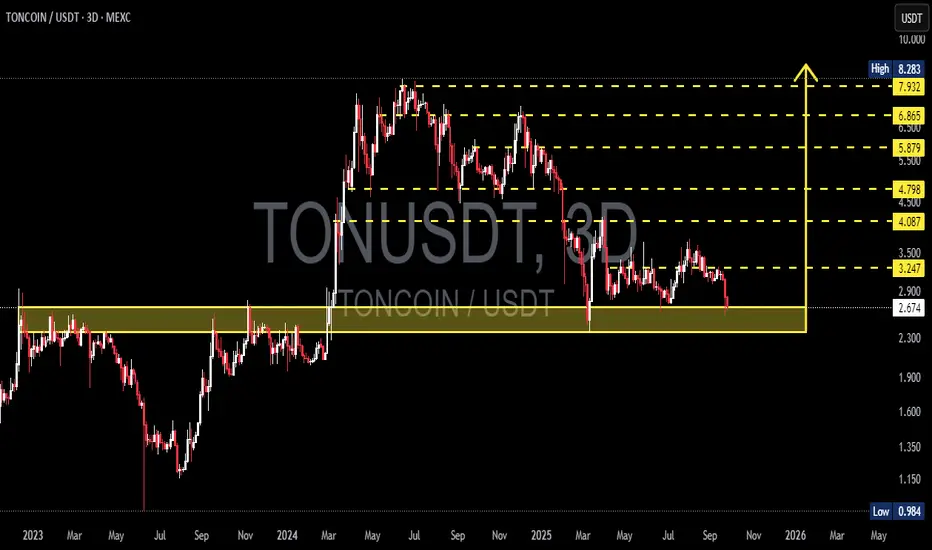
TON/USDT — Make-or-Break Level: Golden Support Zone Retest?Overview
TON/USDT is currently testing a critical historical support zone at $2.30 – $2.90. This is not just another technical level—it’s a battlefield between buyers and sellers that will determine the next major trend for TON in the coming months.
Since topping out at $8.283, TON has been carving a series of lower highs and lower lows, signaling a medium-term downtrend.
Now, price has returned to the golden zone (yellow box), an area that acted as strong resistance in 2023 – early 2024 before finally being broken to the upside.
This zone is now being retested as support—meaning we are at a make-or-break moment for TON’s long-term trajectory.
---
Bullish Scenario — Holding & Reversal
If this zone holds, TON could stage a strong rebound:
1. First target at $3.247.
2. A breakout above it could open the way to $4.087 – $4.798.
3. Further recovery may push TON back toward $5.879 → $6.865 → $7.932, and eventually its previous high at $8.283.
Bullish structure confirmation requires:
A higher low forming inside the golden box.
A clear breakout above $3.247 with strong volume.
This area could become the foundation for TON’s next major rally if buyers regain control.
---
Bearish Scenario — Breakdown & Deep Correction
If sellers dominate and price breaks below $2.30, the downside risk expands significantly:
1. Next support lies at $1.90.
2. Failure there opens the way to $1.35.
3. In an extreme bearish case, TON could revisit its chart low at $0.984, a drop of more than 60% from current levels.
This bearish case gains strength if:
We see a decisive 3D/weekly close below the box.
Retests back into the zone are rejected (false recovery).
---
Price Structure — Support/Resistance Flip
The current pattern is a classic S/R flip test:
The yellow zone was once major resistance.
After being broken, it flipped into major support.
Now, price is retesting it—meaning it will either bounce hard or break hard.
---
Trading Strategy & Risk Management
Conservative Approach: Wait for a clear 3D/weekly bullish rejection candle before entering. Target $3.247, with stop loss just below the zone (~$2.15).
Aggressive Approach: Scale in around $2.50–$2.70 with a stop below the zone. First target remains $3.247. Higher risk, but high potential reward if the bounce materializes.
Breakdown Play: If $2.30 is lost on strong volume, wait for a failed retest and short the breakdown. Targets: $1.90 → $1.35.
---
Conclusion
The $2.30 – $2.90 golden zone is TON’s battlefield.
Holding this level could spark a multi-stage recovery.
Losing it could trigger a deep correction to the 1.x range.
In such situations, patience and confirmation matter more than guessing.
---
#TON #TONCOIN #TONUSDT #CryptoAnalysis #TechnicalAnalysis #SupportResistance #CryptoTrading #PriceAction
#TON/USDT : Bullish Wave Still In Progress#TON
The price is moving within a descending channel on the 1-hour frame, adhering well to it, and is heading for a strong breakout and retest.
We have a bearish trend on the RSI indicator that is about to be broken and retested, which supports the upward breakout.
There is a major support area in green at 2.70, representing a strong support point.
We are heading for consolidation above the 100 moving average.
Entry price: 2.76
First target: 2.80
Second target: 2.87
Third target: 2.96
Don't forget a simple matter: capital management.
When you reach the first target, save some money and then change your stop-loss order to an entry order.
For inquiries, please leave a comment.
Thank you.

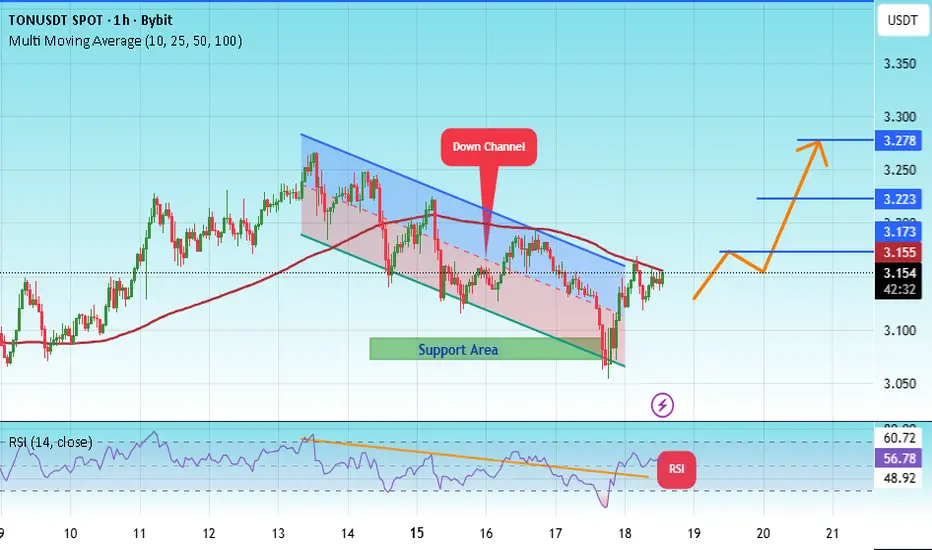
#TON/USDT | TON Testing Wedge Breakout Amid Key Support#TON
The price is moving within a descending channel on the 1-hour frame, adhering well to it, and is heading for a strong breakout and retest.
We have a bearish trend on the RSI indicator that is about to be broken and retested, which supports the upward breakout.
There is a major support area in green at 3.07, representing a strong support point.
We are heading for consolidation above the 100 moving average.
Entry price: 3.14
First target: 3.17
Second target: 3.22
Third target: 3.72
Don't forget a simple matter: capital management.
When you reach the first target, save some money and then change your stop-loss order to an entry order.
For inquiries, please leave a comment.
Thank you.
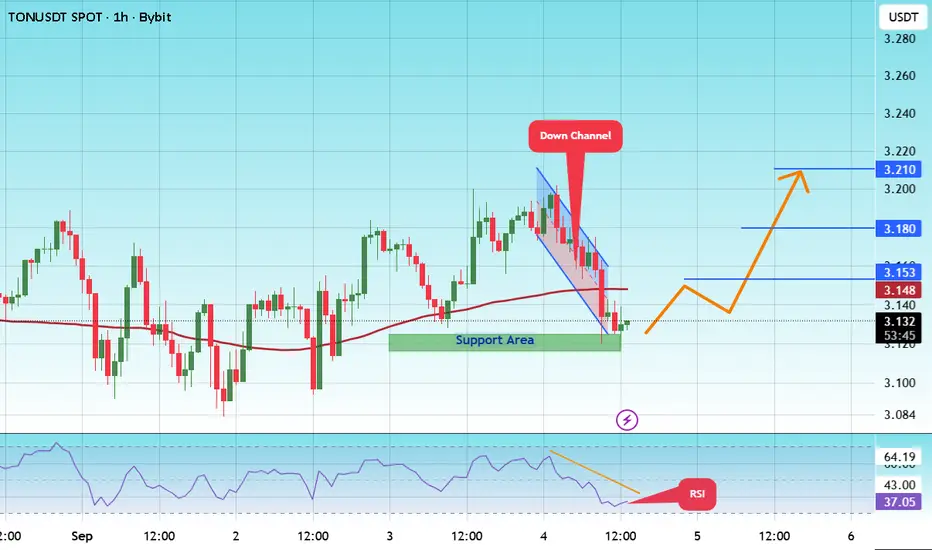
#TON/USDT | TON Testing Wedge Breakout Amid Key Support#TON
The price is moving within a descending channel on the 1-hour frame and is expected to break and continue upward.
We have a trend to stabilize above the 100 moving average once again.
We have a downtrend on the RSI indicator that supports the upward move with a breakout.
We have a support area at the lower boundary of the channel at 3.12, acting as strong support from which the price can rebound.
We have a major support area in green that pushed the price higher at 3.12.
Entry price: 3.12
First target: 3.15
Second target: 3.18
Third target: 3.21
To manage risk, don't forget stop loss and capital management.
When you reach the first target, save some profits and then change the stop order to an entry order.
For inquiries, please comment.
Thank you.
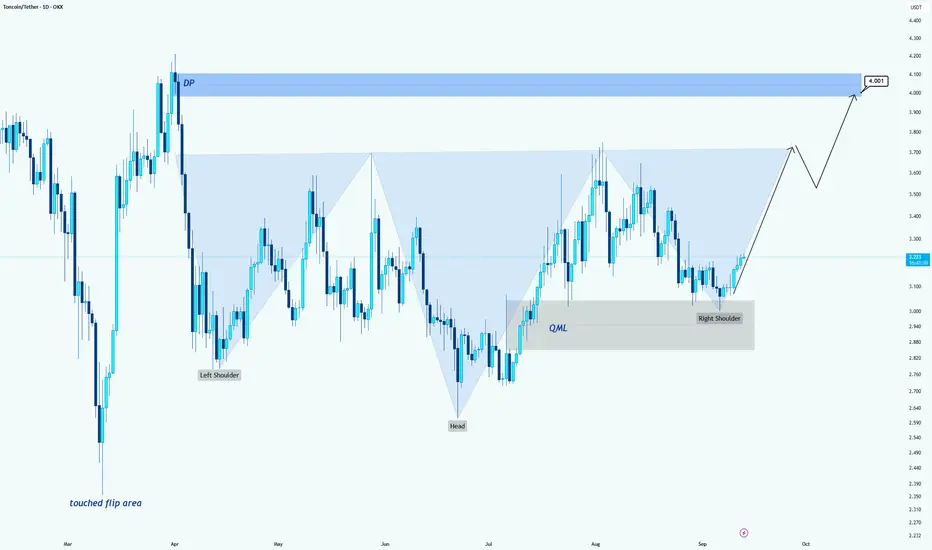
TON/USDT –> Inverse Head & Shoulders Breakout SetupHello guys!
On the daily chart, TON is forming a clear Inverse Head & Shoulders pattern, a classic bullish reversal structure.
Key Levels & Structure:
Left Shoulder: Around 3.00
Head: Around 2.30
Right Shoulder: Recently formed around 3.00, confirming buyer interest.
QML Zone: 2.90 – 3.00 area has acted as a strong demand base.
Bullish Scenario:
A breakout above the 3.50 – 3.60 neckline opens the way for a strong move higher.
Main target sits around the 4.00 – 4.10 DP zone, aligning with previous supply.
After reaching that level, a possible short-term correction could happen before continuation.
Invalidation:
A daily close below 2.90 (QML zone) would invalidate the bullish structure and put buyers on the defensive.
📌 Conclusion:
TON is showing a strong reversal pattern. If the neckline breaks, the path to 4.00+ looks likely. Buyers remain in control while the price stays above 2.90.
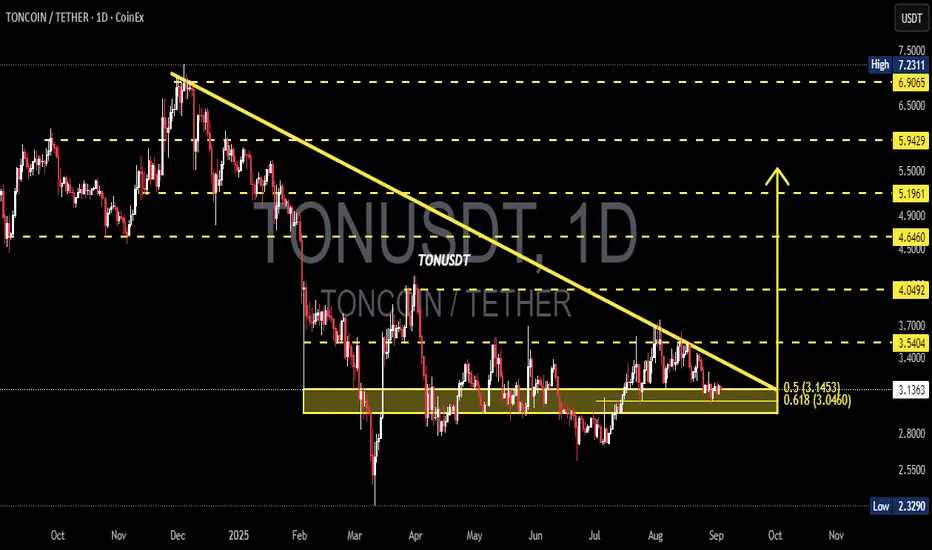
TON/USDT — Descending Triangle at 0.618 Fibonacci Support!🔎 Overview
TON is currently standing at a make-or-break moment. The daily chart shows a Descending Triangle pattern, where price has been consistently pressured by a downward trendline from the early-year highs, while being strongly defended by the key support zone around 3.04 – 3.14 USDT (Fibonacci 0.5–0.618).
This setup reflects a battle between buyers accumulating at demand and sellers pressing from above. Such compression usually leads to a strong breakout or breakdown as price approaches the triangle’s apex.
---
📌 Key Technical Levels
Current Price: 3.1365 USDT
Main Support Zone:
0.618 Fib = 3.0460
0.5 Fib = 3.1453
First Resistance / breakout zone: 3.5404
Next Resistances: 4.0492 → 4.6460 → 5.1961 → 5.9429
Major Downside Support: 2.3290 (previous low)
---
🟢 Bullish Scenario (Breakout Potential)
1. Bullish confirmation occurs if price holds above 3.046 and breaks the descending trendline with a strong daily close + high volume.
2. Further validation: a close above 3.5404 will likely open the path toward 4.05 and 4.64.
3. With strong momentum, extended targets lie around 5.19 – 5.94, and eventually the major high near 7.23.
4. Narrative: A bullish breakout from a descending triangle often signals a trend reversal from accumulation.
---
🔴 Bearish Scenario (Breakdown Risk)
1. If price fails to hold above 3.0460 and closes below on the daily chart, the descending triangle confirms a bearish continuation.
2. First downside target: 2.80–2.60, with ultimate support near 2.3290.
3. If breakdown comes with strong volume, panic selling could accelerate the move lower.
4. Narrative: A bearish breakdown usually extends the prior downtrend, pushing price back to previous cycle lows.
---
📐 Pattern & Market Sentiment
Descending Triangle: A consolidation pattern within a downtrend; statistically bearish but can turn bullish if breakout volume is significant.
Volume Factor: Confirmation is critical. Breakouts without volume often lead to fake moves.
Golden Ratio Support (0.5–0.618 Fib): A historically strong support and reversal area — losing it would shift momentum back to the bears.
---
📢 Conclusion
TON stands right above its final line of defense (0.618 Fib). If this zone holds and the descending trendline is broken, bulls could ignite a move toward 3.54 – 4.05+. But if 3.046 fails, bears may drag TON back to the 2.32 lows.
In short: TON is at a “do or die” stage — expect a major breakout or breakdown soon.
---
TON/USDT is trapped inside a descending triangle with a critical support zone at Fibonacci 0.5–0.618 (3.14–3.04).
📉 Breakdown below 3.046 → risk of drop to 2.32
📈 Breakout above 3.54 → potential rally to 4.05 – 4.64
A decisive move is near — watch the volume for confirmation!
#TON #TONUSDT #Crypto #Altcoin #TradingView #TechnicalAnalysis #Fibonacci #DescendingTriangle #Breakout #SupportResistance #ChartPattern