TON: an idea in a day.We have a local long idea for TON up to the upper limit of the range.
We only enter after confirmation and a stop in the long zones. If we fall below that limit, we simply skip it.
BINANCE:TONUSDT.P
Tonusdtsignals

TONUSD: Wave Structure in Search of Growth ImpulseTONUSD: Wave Structure in Search of Growth Impulse
TONUSD Wave Overview (D1 and H4)
As a trader who has been practicing wave analysis for over ten years, I note that the current picture for TONUSD shows the end of an extended corrective phase and the potential for a new movement.
D1 Chart: The global structure indicates that the market is gradually breaking out of its sideways range. The wave formation looks like the end of a correction, laying the foundation for the next impulse.
H4 Chart: Local dynamics confirm the first signs of an impulse. Key entry points are forming here, which could mark the beginning of a larger wave.
Main Scenario
After the completion of the corrective phase, a downward impulse sequence is expected to develop. This movement may be accompanied by increased seller activity and a shift in focus to the downside.
Alternative Scenario
If the price holds above local peaks and forms a stable upward impulse structure, the focus will shift to continued growth. In this case, the correction will be considered incomplete, and TONUSD may experience an additional rebound.
Trading Idea
Conservative approach: wait for confirmation of a breakout of key levels and enter with the trend.
Aggressive approach: use local impulses on H4 for earlier entries, but with tight stops.
In both cases, it is important to maintain strict risk management and adjust the plan as new impulses emerge.
Results
TONUSD is at a crossroads between the end of the correction and the beginning of a new impulse. The wave structure on D1 and H4 provides clear guidelines for action: watch for confirmation of the scenario and act with discipline.

Toncoin (TON/USDT): Trendline Break & Double BottomHi!
TON has formed a double-bottom reversal pattern after a sharp decline, signaling early bullish momentum. Price has also broken the minor descending trendline, confirming a short-term shift in structure.
Key Levels
Immediate Resistance: $1.63–$1.68 (first supply zone)
Major Resistance: $1.78–$1.82 (trendline + supply confluence)
Bullish Scenario
A sustained move above $1.63–$1.68 opens the path toward $1.78–$1.82, where the main descending trendline is located. A breakout there would confirm a stronger trend reversal.
Bearish Scenario
Failure to hold above the breakout zone may lead to a retest of $1.50–$1.52, the neckline of the double bottom.

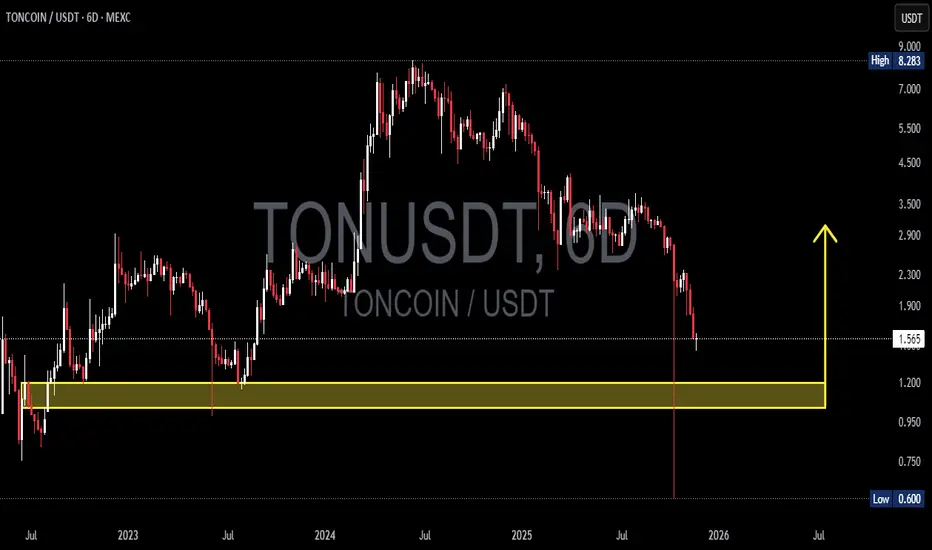
TON/USDT — Reversal Setup or Deeper Breakdown Ahead?On the 6D timeframe, TON has reached its most critical level since 2023. After forming a macro top near 8.28, the market shifted into a clean sequence of lower highs and lower lows, signaling sustained bearish control.
And now… price has landed directly inside the historical accumulation zone at 1.20 – 1.03 — a golden area that has repeatedly dictated long-term trend direction.
This isn’t just another support zone.
This is a psychological battleground, where major buyers stepped in previously and triggered multi-month rallies.
---
🔥 Why the 1.20 – 1.03 Zone Matters So Much
It has served as a macro pivot zone in previous cycles.
Every major uptrend in TON began with accumulation inside this area.
Holding this zone = potential multi-month bullish reversal.
Losing this zone = full transition into a macro bearish cycle.
TON is standing on the edge:
Either it rebounds explosively, or it breaks down toward levels not visited in years.
---
📈 Bullish Scenario — “Rebound from the Sacred Zone”
This scenario gains strength if:
1. Price prints a strong reversal inside 1.03–1.20 (pin bar / bullish engulfing).
2. A 6D candle closes back above 1.20 → confirms demand.
3. Breakout above 1.90–2.30 → confirms a macro trend shift.
If confirmed, upside targets are:
First target: 2.30
Expansion target: 3.50
Mid-cycle target: 5.00+
This could mark the beginning of TON’s next bullish cycle — but only with proper confirmation.
---
📉 Bearish Scenario — “Freefall Toward Extreme Lows”
Bearish continuation becomes likely if:
1. Price fails to hold the 1.03–1.20 support zone.
2. A 6D candle closes below 1.00 → macro support officially broken.
If breakdown confirms, downside targets become:
0.80
And potentially a retest of 0.60 (the previous flash-low wick).
A clean break below the yellow zone signals the end of TON’s multi-year bullish structure and opens the door for deeper corrective moves.
---
TON has entered the most decisive zone of the past two years.
The 1.03–1.20 range will determine whether TON launches a new bullish expansion…
or whether the market continues the strong downtrend toward 0.80–0.60.
The reaction inside this zone will dictate TON’s direction into 2026.
#TON #TONUSDT #CryptoTA #MarketStructure #SupportZone #PriceAction #CryptoTrading #ReversalZone
TON Spot LONGThe newly formed range indicates local signs of accumulation.
After the deviation of the lower boundary of the range, an upward IOF was born, and with additional manipulation in the POI zone, there will be a great opportunity to open a long position. 📈

TON/USDT — Defense Zone at 2.20–1.92: Reversal or Breakdown?TON is now standing at a critical inflection point — the 2.20–1.92 zone (yellow block).
This area isn’t just another support level — it’s the make-or-break zone that will decide whether TON will rebound for a macro reversal or collapse into a deeper downtrend.
After a sharp fall from the 8.28 high, price has reached its historical demand base, showing a strong wick rejection below support — a classic sign of liquidity sweep or stop-hunt, often marking the final shakeout before larger players begin accumulating.
However, without a clear structure break and volume confirmation, the risk of a fake bounce remains high.
---
Structure & Pattern Analysis
1. Macro trend remains bearish, with a series of lower highs and lower lows since the 2024 peak.
2. The 2.20–1.92 zone represents a major accumulation range, also aligning with the previous breakout base from early 2023.
3. The deep wick indicates a potential spring phase in a Wyckoff Accumulation pattern, where weak hands are flushed out.
4. A confirmed close above 2.65 would mark a structural shift — signaling a possible start of a new bullish leg.
5. On the other hand, a close below 1.92 would validate a macro breakdown, opening room for a prolonged bearish continuation.
---
Bullish Scenario (Potential Reversal)
Confirmation: A 4D candle close above 2.65, supported by increasing volume.
Technical narrative: After a long liquidation event, price tends to form a V-shaped rebound or base breakout once smart money steps back in.
🎯 Upside Targets:
Target 1 → 3.55 (local distribution zone)
Target 2 → 4.60 (key structural pivot)
Target 3 → 6.84 – 8.09 (major supply zone & prior 2024 top)
💡 If momentum builds, this could evolve into a multi-month recovery rally, similar to the early bull phase of 2024.
---
Bearish Scenario (Continuation Risk)
Confirmation: A 4D close below 1.92 confirms breakdown of the macro support.
Technical narrative: Once this zone fails, buyer exhaustion could drive price toward 1.50–1.20, the next historical liquidity pool.
🎯 Downside Targets:
Short-term support → 1.80
Extended range → 1.50 – 1.20
A proper reversal would then require a new long accumulation base forming at lower levels.
---
Technical Summary
TON is currently hovering within its largest accumulation zone in over a year.
This yellow block (2.20–1.92) will determine the next major trend:
Hold and reclaim 2.65 → bullish reversal confirmed.
Fail and close below 1.92 → macro breakdown confirmed.
At this stage, TON offers a high-risk, high-reward setup for swing traders — ideal for those waiting for clear structural confirmation before entry.
#TON #TONUSDT #CryptoAnalysis #TONCoin #TechnicalAnalysis #SwingTrade #BreakoutSetup #SupportAndResistance #Wyckoff #MarketStructure #AccumulationPhase #CryptoUpdate #PriceAction

TONCOIN (TON/USDT): Wave 5 or Impulse FailureTONCOIN (TON/USDT): Wave 5 or Impulse Failure
📈 Weekly Scenarios
Bullish scenario: Price holds above ~$2.70 and breaks through ~$3.90 → start of wave (3) or (5) up → target ~$5.00+.
Consolidation: Price remains in the ~$2.70-$3.90 range without a clear move, market paused.
Bearish scenario: Price breaks below ~$2.60-$2.70 with volume confirmation → start of a corrective wave → possible move to ~$2.10-$2.20.
✅ Conclusion
For the coming week, the technical picture for TON/USDT is on the verge of a reversal.
Holding support at ~$2.60-$2.70 and breaking above ~$3.90 could activate upward momentum.
A breakout below $2.60 is a signal for caution and a possible decline.
The wave count is still unclear, so it's important to monitor the price reaction at key levels.

Ton’s Turn — Watch It Burn Before the ReturnWe’re following one of the scenarios I shared earlier —
the yellow path from my previous publication.
At this stage, I expect further downside movement on $TON.
🎯 First target: 2.12
🎯 Global target: 1.98 - — and possibly even slightly lower
🔴 Invalidation zone: 2.2618
Please stay cautious and avoid catching the bottom —
it’s always better to wait for confirmation before any long entries

TON on the Run — Before It’s DoneMy previous forecast for TON has played out as expected — the price reached 2.26 and even moved slightly higher.
At the moment, I see two potential scenarios, yet both seem to point toward the same outcome.
In my opinion, wave E of the corrective pattern might not be fully completed.
Structurally, this looks like a contracting triangle, which often precedes a bearish breakout.
For now, I’m watching for a move down to the lower red line as a short-term target.
But from a broader perspective, I believe TON could drop even lower once the triangle is complete and the downward wave resumes
⚠️ Disclaimer: This analysis is based on technical patterns and personal observations. Trading cryptocurrencies carries significant risks. Always perform your own research and manage your risk accordingly

TON have a good Investment Opportunity Hi Everyone;
today we have one of the best risk to reward Investment opportunity
it is more than 34 times the risk and the chart is look very promising.
I expect breaking the previous bear market key point will clear the way to the final target

A TON of Hope — or Just a Slope?I expect TON/USDT to rebound toward 2.26.
The invalidation zone is marked in red on the chart.
Still, let’s keep our feet on the ground — we all remember that recent crash.
So far, there are no strong signals of a new bullish trend.
This move up looks more like a correction phase inside a broader bearish structure, not the start of something bigger.
Trade wisely — not emotionally

TON/USDT: Bearish Bias Holds Below Key Resistance in Downward ChTON/USDT continues to trade within a well-defined downward channel, consistently forming lower highs and maintaining bearish pressure. Following a sharp decline from the consolidation zone, the recent rebound is now encountering resistance near 2.85, a level where sellers may reassert control.
As long as price remains below the 3.00 psychological level and the descending trendline, the bearish bias stays intact. A rejection from current levels could lead to a move toward the 2.62 support, with further downside possible into the buying area below 2.55.

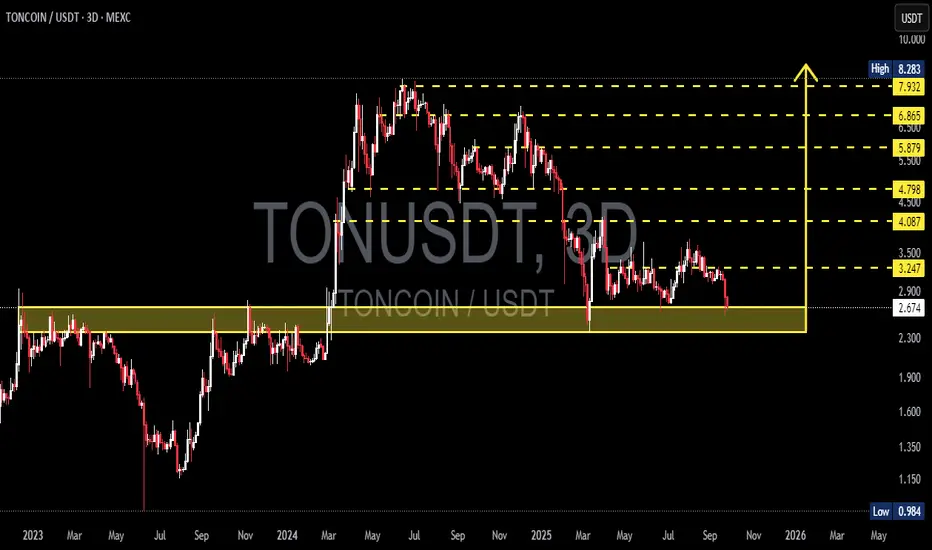
TON/USDT — Make-or-Break Level: Golden Support Zone Retest?Overview
TON/USDT is currently testing a critical historical support zone at $2.30 – $2.90. This is not just another technical level—it’s a battlefield between buyers and sellers that will determine the next major trend for TON in the coming months.
Since topping out at $8.283, TON has been carving a series of lower highs and lower lows, signaling a medium-term downtrend.
Now, price has returned to the golden zone (yellow box), an area that acted as strong resistance in 2023 – early 2024 before finally being broken to the upside.
This zone is now being retested as support—meaning we are at a make-or-break moment for TON’s long-term trajectory.
---
Bullish Scenario — Holding & Reversal
If this zone holds, TON could stage a strong rebound:
1. First target at $3.247.
2. A breakout above it could open the way to $4.087 – $4.798.
3. Further recovery may push TON back toward $5.879 → $6.865 → $7.932, and eventually its previous high at $8.283.
Bullish structure confirmation requires:
A higher low forming inside the golden box.
A clear breakout above $3.247 with strong volume.
This area could become the foundation for TON’s next major rally if buyers regain control.
---
Bearish Scenario — Breakdown & Deep Correction
If sellers dominate and price breaks below $2.30, the downside risk expands significantly:
1. Next support lies at $1.90.
2. Failure there opens the way to $1.35.
3. In an extreme bearish case, TON could revisit its chart low at $0.984, a drop of more than 60% from current levels.
This bearish case gains strength if:
We see a decisive 3D/weekly close below the box.
Retests back into the zone are rejected (false recovery).
---
Price Structure — Support/Resistance Flip
The current pattern is a classic S/R flip test:
The yellow zone was once major resistance.
After being broken, it flipped into major support.
Now, price is retesting it—meaning it will either bounce hard or break hard.
---
Trading Strategy & Risk Management
Conservative Approach: Wait for a clear 3D/weekly bullish rejection candle before entering. Target $3.247, with stop loss just below the zone (~$2.15).
Aggressive Approach: Scale in around $2.50–$2.70 with a stop below the zone. First target remains $3.247. Higher risk, but high potential reward if the bounce materializes.
Breakdown Play: If $2.30 is lost on strong volume, wait for a failed retest and short the breakdown. Targets: $1.90 → $1.35.
---
Conclusion
The $2.30 – $2.90 golden zone is TON’s battlefield.
Holding this level could spark a multi-stage recovery.
Losing it could trigger a deep correction to the 1.x range.
In such situations, patience and confirmation matter more than guessing.
---
#TON #TONCOIN #TONUSDT #CryptoAnalysis #TechnicalAnalysis #SupportResistance #CryptoTrading #PriceAction
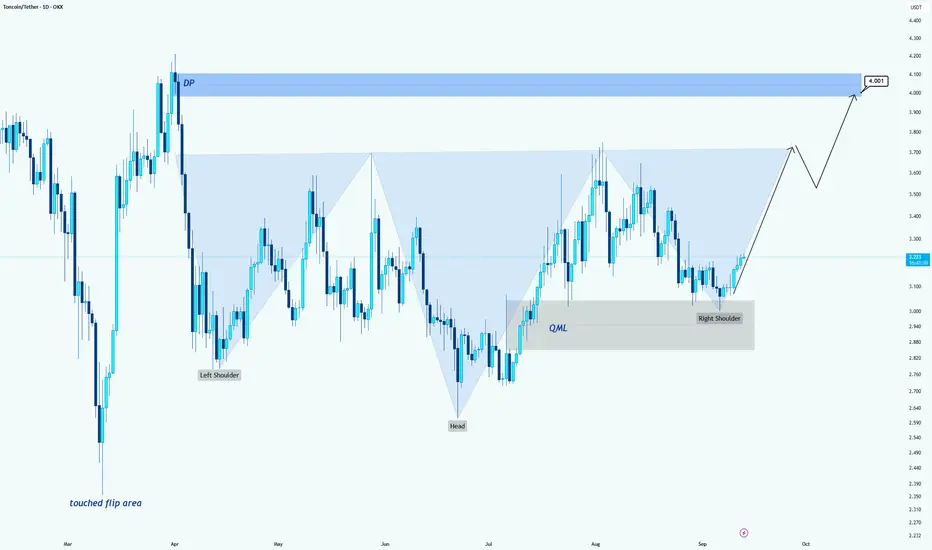
TON/USDT –> Inverse Head & Shoulders Breakout SetupHello guys!
On the daily chart, TON is forming a clear Inverse Head & Shoulders pattern, a classic bullish reversal structure.
Key Levels & Structure:
Left Shoulder: Around 3.00
Head: Around 2.30
Right Shoulder: Recently formed around 3.00, confirming buyer interest.
QML Zone: 2.90 – 3.00 area has acted as a strong demand base.
Bullish Scenario:
A breakout above the 3.50 – 3.60 neckline opens the way for a strong move higher.
Main target sits around the 4.00 – 4.10 DP zone, aligning with previous supply.
After reaching that level, a possible short-term correction could happen before continuation.
Invalidation:
A daily close below 2.90 (QML zone) would invalidate the bullish structure and put buyers on the defensive.
📌 Conclusion:
TON is showing a strong reversal pattern. If the neckline breaks, the path to 4.00+ looks likely. Buyers remain in control while the price stays above 2.90.
TONUSDTThe chart of OKX:TONUSDT is now break trendline so wait for continue bullish trend.
Support: 3.520 - 3.720
Resistance: 3.190 - 3.020 - 2.925 - 2.670
⚠️ Please control risk management.

TON: The Decline Continues The decline of TON has lasted for more than 10 days, and the market overheating indicator clearly shows that the trend remains bearish. On August 25, a short setup was identified on the 4-hour chart around $3,202. The move was brief, lasting only two days, but price reached $3,113, passing through two profit-taking levels and giving a difference of nearly $90 per coin. The trade was completed according to plan, and the result was secured.
What’s more interesting is that additional analysis confirmed the overall direction remains bearish. This means long positions are better avoided for now, as they carry a high risk of loss. It’s important not only to identify entry points but also to skip trades that statistically lack an advantage.
For intermediate traders, this approach works as an accelerator. Instead of endless doubts, there are clear levels and an understanding of where to act and where to wait. Algorithmic discipline pushes emotions into the background, making the trading process structured and transparent.
The market may continue to decline, but systematic management allows traders to extract value even during difficult phases and avoid hasty decisions.

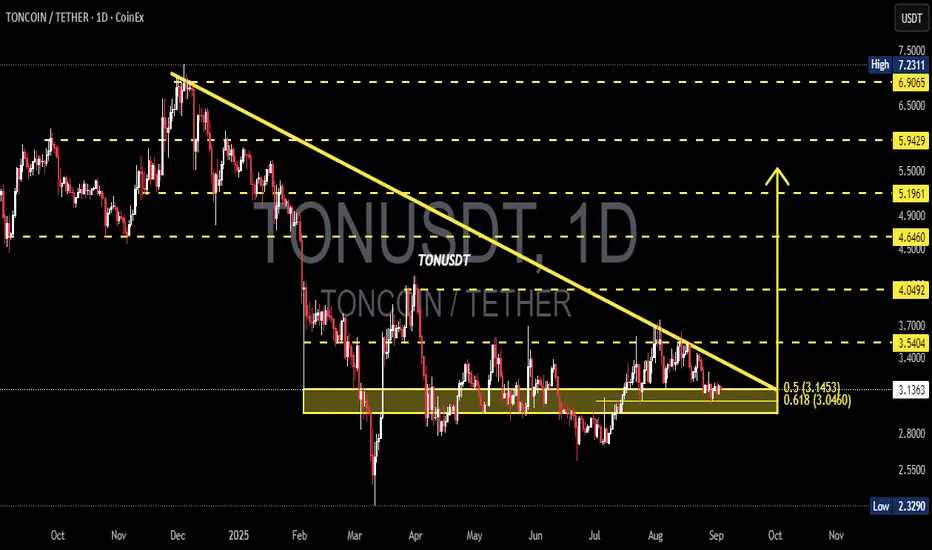
TON/USDT — Descending Triangle at 0.618 Fibonacci Support!🔎 Overview
TON is currently standing at a make-or-break moment. The daily chart shows a Descending Triangle pattern, where price has been consistently pressured by a downward trendline from the early-year highs, while being strongly defended by the key support zone around 3.04 – 3.14 USDT (Fibonacci 0.5–0.618).
This setup reflects a battle between buyers accumulating at demand and sellers pressing from above. Such compression usually leads to a strong breakout or breakdown as price approaches the triangle’s apex.
---
📌 Key Technical Levels
Current Price: 3.1365 USDT
Main Support Zone:
0.618 Fib = 3.0460
0.5 Fib = 3.1453
First Resistance / breakout zone: 3.5404
Next Resistances: 4.0492 → 4.6460 → 5.1961 → 5.9429
Major Downside Support: 2.3290 (previous low)
---
🟢 Bullish Scenario (Breakout Potential)
1. Bullish confirmation occurs if price holds above 3.046 and breaks the descending trendline with a strong daily close + high volume.
2. Further validation: a close above 3.5404 will likely open the path toward 4.05 and 4.64.
3. With strong momentum, extended targets lie around 5.19 – 5.94, and eventually the major high near 7.23.
4. Narrative: A bullish breakout from a descending triangle often signals a trend reversal from accumulation.
---
🔴 Bearish Scenario (Breakdown Risk)
1. If price fails to hold above 3.0460 and closes below on the daily chart, the descending triangle confirms a bearish continuation.
2. First downside target: 2.80–2.60, with ultimate support near 2.3290.
3. If breakdown comes with strong volume, panic selling could accelerate the move lower.
4. Narrative: A bearish breakdown usually extends the prior downtrend, pushing price back to previous cycle lows.
---
📐 Pattern & Market Sentiment
Descending Triangle: A consolidation pattern within a downtrend; statistically bearish but can turn bullish if breakout volume is significant.
Volume Factor: Confirmation is critical. Breakouts without volume often lead to fake moves.
Golden Ratio Support (0.5–0.618 Fib): A historically strong support and reversal area — losing it would shift momentum back to the bears.
---
📢 Conclusion
TON stands right above its final line of defense (0.618 Fib). If this zone holds and the descending trendline is broken, bulls could ignite a move toward 3.54 – 4.05+. But if 3.046 fails, bears may drag TON back to the 2.32 lows.
In short: TON is at a “do or die” stage — expect a major breakout or breakdown soon.
---
TON/USDT is trapped inside a descending triangle with a critical support zone at Fibonacci 0.5–0.618 (3.14–3.04).
📉 Breakdown below 3.046 → risk of drop to 2.32
📈 Breakout above 3.54 → potential rally to 4.05 – 4.64
A decisive move is near — watch the volume for confirmation!
#TON #TONUSDT #Crypto #Altcoin #TradingView #TechnicalAnalysis #Fibonacci #DescendingTriangle #Breakout #SupportResistance #ChartPattern
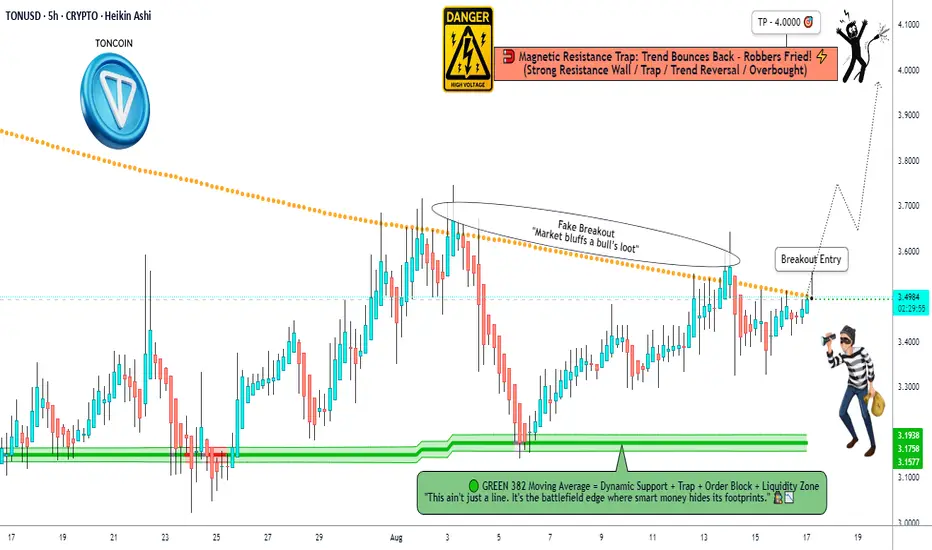
TON/USD Market Trap or Treasure? Decide Before 4.000!🚨TON/USD "TONCOIN vs U.S DOLLAR" Crypto Heist Plan 🚨
💎 Hello Thief OG’s, Money Grabbers & Market Shadows!
Today’s mission is locked 🔐 – we’re breaking into the TON/USD vault with a Bullish Heist Strategy.
🎯 Plan of Attack
Asset: TON/USD "TONCOIN vs U.S DOLLAR"
Mode: Bullish 🟢 (Heist in progress)
Entry (Thief Layers):
💰 Layer 1 @3.4900
💰 Layer 2 @3.4500
💰 Layer 3 @3.4000
💰 Layer 4 @3.3600
(You can add more layers – the deeper the vault, the sweeter the loot!)
Stop Loss (SL) 🛑: @3.2600 – This is the Thief Emergency Exit.
🔐 Adjust based on your own strategy & risk appetite.
Target (Escape Point) 🏆: @4.0000
⚡ “High Voltage Zone” ahead – escape with your loot before the alarms ring!
🕵️♂️ Thief Strategy Style
This is not a single-door entry – we’re layering multiple buy limit orders, stacking our positions like a true market bandit. 📊
Stay sharp – once the bags are full, we run with the profit! 🏃♂️💨
⚠️ Heist Rules for OG’s
Only rob the long side – trend is with the bulls. 🐂
Use trailing SL to protect stolen money 💵.
Don’t get caught in news traps – avoid new entries during 🔔 big announcements.
💥 Boost this plan 💥 if you’re riding with the Thief Crew!
Together, we rob the market – layer by layer, vault by vault. 💰🚀
📌 Disclaimer: This is a Thief Trading style heist plan, not financial advice. Trade with your own risk management.
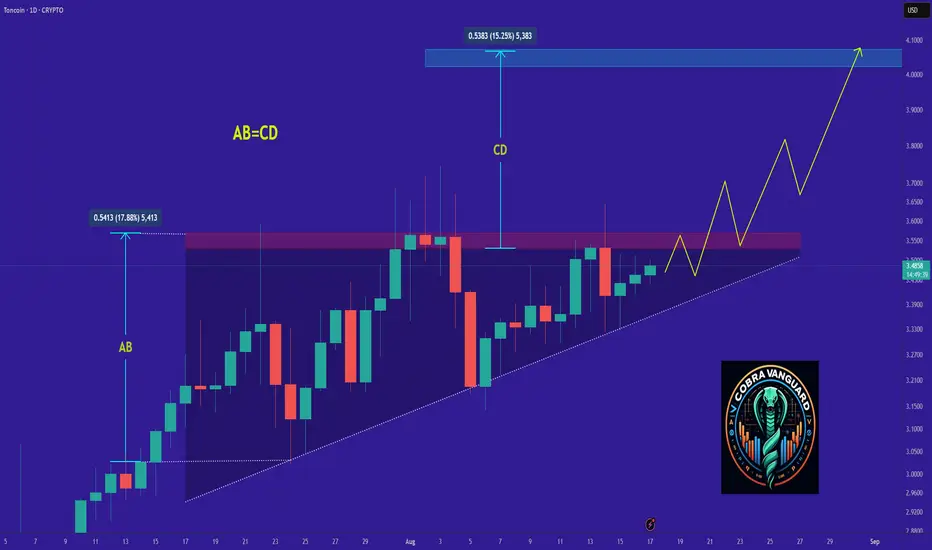
TON's Situation, A Comprehensive Analysis !!!The price on the Daily timeframe is within an ascending triangle, which can be promising. If the price breaks this pattern with bullish candles, it could easily rise by the distance of AB=CD .
Best regards CobraVanguard.💚
TONUSDT Breaks Out of Bearish Grip! Is a Bullish Rally?🔎 1. Key Pattern: Descending Trendline Breakout + Reaccumulation Zone
After months of downward pressure, TONUSDT has successfully broken above a dominant descending trendline that has been acting as resistance since December 2024.
✅ This breakout occurred with a strong bullish candle and aligns perfectly with a significant historical resistance zone (around $3.00–$3.12).
📌 The area also overlaps with the Fibonacci retracement levels (0.5–0.618) — a zone where trend reversals often occur.
This indicates that the move isn't just noise — it might be the start of a mid-term bullish trend.
---
🧱 2. Consolidation Box = Reaccumulation Zone
TONUSDT spent nearly 4 months ranging sideways between $2.80 and $3.20, forming a clear reaccumulation range.
🔁 This kind of price action often precedes a strong breakout, as smart money accumulates before the next leg up.
🟨 This box now acts as a critical demand/support zone for any potential pullbacks.
---
📏 3. Key Levels to Watch (Support & Resistance)
✅ Bullish Targets (Resistance Levels):
🔹 $3.5404 → Immediate resistance
🔹 $4.0492 → Major resistance to break
🔹 $4.6460
🔹 $5.1961
🔹 $5.9429
🔹 $6.9065
🔹 Local High: $7.2311
🔻 Support Levels:
🔸 $3.1248 – $3.0099 → Key Fibonacci support (0.5–0.618)
🔸 $2.8000 → Bottom of reaccumulation range
🔸 $2.3290 → Major support (also the cycle low)
---
📈 Bullish Scenario (Primary Bias)
If price holds above the key zone at $3.00–$3.12, we could see:
A move towards $3.54 USDT
Breakout above $3.54 opens the door to $4.05 → $4.64 → $5.19 and beyond
A clear structure of higher highs and higher lows confirms trend reversal
Momentum remains strong as long as price respects the breakout zone.
---
📉 Bearish Scenario (Alternative Case to Watch)
If price fails to hold above $3.00 and breaks back below $2.80:
This would suggest a false breakout
Momentum may shift bearish again
Price could revisit the $2.32 support, negating the bullish setup
A return to sideways or even downtrend structure is possible
---
🧩 Strategic Conclusion
TONUSDT has broken out of a key descending trendline and reclaimed a strong structural zone, indicating early signs of a bullish cycle.
📊 Key Levels to Monitor Closely:
Support (validation zone): $3.00–$3.12
Immediate resistance: $3.54
Mid-term targets: $4.05 → $5.19 and higher
> As long as TON stays above the golden zone (Fibonacci 0.5–0.618), bulls have the upper hand.
---
📘 Pro Tips for Traders:
Watch for volume confirmation during retests
Be patient for pullback entries or breakout confirmations
Manage risk — don’t FOMO blindly
#TONUSDT #TONCOIN #CryptoBreakout #AltcoinAnalysis #TechnicalAnalysis #CryptoTrading #TON #Reaccumulation #BreakoutSetup #FibonacciSupport #BullishReversal #TONBullish

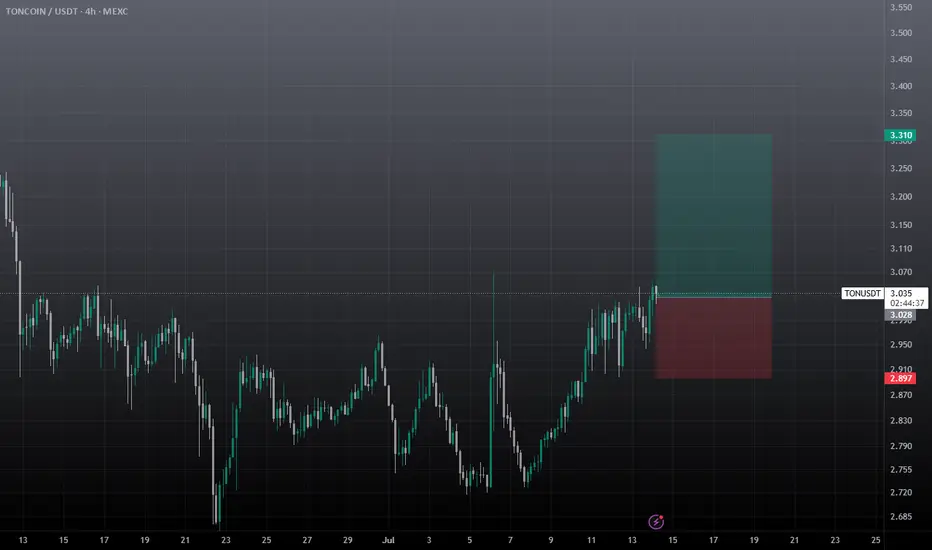
Ton USDT Buy Setup / Long SetupTon entry at current market price 3.305 , SL if 1 day closes below the mentioned zone. Otherwise holding ton for breakout towards 4-4.5$. use low risk amount as BTC can retrace.

Ton USDT Intraday Setup / Long SetupTake with tight SL, an easy 2RR, take it at cmp (Current Market Price), While if you holding spot bag, it can easily hit 4.5-5$ mark in this week. Best Of Luck
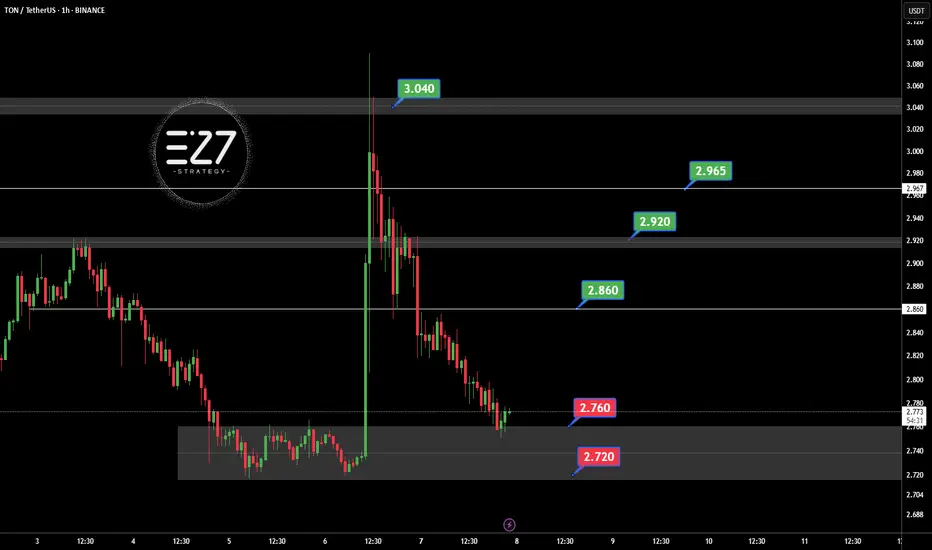
TONUSDT Following the official denial by UAE authorities regarding the possibility of obtaining a golden visa through staking OKX:TONUSDT , the bullish momentum driven by that rumor has faded. Selling pressure has increased, and TON is now consolidating within the key support zone of 2.720 to 2.760 USDT. If this support breaks, further downside is likely. However, if the price holds and reclaims the 2.860 USDT resistance, it could trigger a recovery toward 2.920 and 2.965 USDT. For now, the market sentiment remains bearish with a corrective bias.
Key Points:
UAE officially denied TON-based golden visa claims, weakening sentiment.
Current support zone: 2.720–2.760 USDT.
Key resistance: 2.860 USDT, then 2.920 USDT.
Break below 2.720 = further decline.
Break above 2.860 = potential bullish reversal.
⚠️ Please Control Risk Management in trades.