TOTAL2 is About to Explode!The crypto market is abuzz with a significant phenomenon - the shrinking of the total market capitalization, excluding Bitcoin (BTC). Contrary to what one might expect, this contraction often precedes a major pump in the world of cryptocurrencies, signifying the potential for exciting price movements. 🌌💥
Unpacking the Market Cap Contraction
Market cap contraction is a fascinating occurrence, one that hints at the complex dynamics of the cryptocurrency market. When we talk about the total market capitalization excluding Bitcoin, we're essentially looking at the collective value of all cryptocurrencies other than the big BTC.
The Compression Effect: A Precursor to a Pump
Why does contraction matter? It's because, in crypto, this phenomenon frequently acts as a precursor to a "pump," a substantial increase in prices. When the total market capitalization of altcoins starts to shrink within a defined range, it often indicates that the market is preparing for a major move.
Anticipating the Upward Surge
For crypto traders and enthusiasts, keeping an eye on this contraction is vital. It suggests that exciting price surges could be on the horizon for the world of altcoins. Such periods of compression often lead to increased trading activity, resulting in significant price movements.
Trading Strategy: Positioning for the Pump
As this exciting market cap contraction unfolds, cryptocurrency traders should consider crafting trading strategies to harness the potential pump. The market dynamics may offer numerous opportunities to capitalize on these upcoming price surges.
Conclusion: Crypto's Dynamic Landscape
Understanding the nuances of the crypto market is crucial, and the market cap contraction phenomenon is one of its fascinating aspects. As we navigate this period of compression, let's remain vigilant, prepared, and ready to embrace the opportunities that a potential pump can bring.
🚀 Crypto Insights | 💡 Trading Strategies | 💰 Market Analysis
❗See related ideas below❗
Share your thoughts and insights 💚🌐💚
Total2usd

#altcoins will have a blood bath?Here' s the #altcoin #totalmarketcap incl. #ethereum . This chart shows , altcoins' market cap have come to the top of the channel. Declination here is will doom altcoin bag holders. Clear breaking channel with volume and weekly closings is the invalidation. I showed the support levels on the chart. The war is not good for markets, a friendly reminder. Always use stop losses. I don' t say buy or sell , always train yourself and this is NOT FINANCIAL ADVICE.

Structural Similarities - TOTAL2The formation we are seeing now which is a potential bottom is similar in my eyes to what was seen before the massive moonshot on total2 post 2016
will there be a follow up run?
I am very bullish right now on TOTAL2 and cryptocurrency.

TOTAL2 Hi Folks,
What is TOTAL2?
🔺For our new members:
--Total: It is the data that shows the total value of the entire cryptocurrency market.
--Total2: It is the data that shows the total value of all altcoins (excluding Bitcoin).
🔺Our Total2 data reached a record high of $1.70 trillion during the previous rally, followed by a sell-off wave that led to a drop to a local low of $435 billion.
🔺During this period, we witnessed many altcoins being delisted from the market or experiencing drpos of up to 90% in value, which was quite painful to watch.
🔺Technically speaking, we can say that this data set, which broke the downtrend, exhibited a consolidation performance in the first half of 2023.
🔺While tracking TOTAL2, we should not forget about stablecoins. It would be overly optimistic to say that the money exiting Bitcoin will flow into altcoins because we are currently not in a "bull rally" phase. The money leaving Bitcoin can also enter stablecoins.
🔺In the previous paragraph, I want to convey the following: It is now overly optimistic to say that if BTC.D (Bitcoin dominance) decreases, altcoins will rise. The money leaving Bitcoin may enter stablecoins, which could cause an increase in the TOTAL2 data, but it does not necessarily mean that altcoins will increase.
Things to Know Before Investing
🔺In the second part of this article, we will discuss what needs to be known before making investments.
🔺First and foremost, we are currently in a consolidation zone from a technical standpoint, as you can see on the chart. The decisions of the Federal Reserve (Fed) will directly affect this consolidation process. Especially on the day this article was written, there is an 80% probability of a 0.25 basis point interest rate hike at the next Fed meeting.
🔺Even if the Fed ends the interest rate hike process, experts predict that interest rates will remain high until 2024, and 10-year bond yields are already above 3.50%. While interest rates are at such high levels, it is still too early to expect a significant bull season for risk assets.
🔺As if the Fed alone is not enough trouble, we also have the Securities and Exchange Commission (SEC) going after altcoins. In recent days, the SEC filed lawsuits against both Binance US and Coinbase. However, to understand these lawsuits most simply, it is necessary to look at the Ripple case, which has been fighting against the SEC for years. The outcome of this case is likely to set a precedent.
🔺There is one important thing not to be forgotten: Even ETH was distributed/sold at very cheap prices to raise the necessary funds during its initial sale (approximately 16%). Unfortunately, this harsh reality exists for altcoins, and unreliable projects are prone to failure. Bitcoin, on the other hand, stands apart from altcoins as it never had an initial sale. We will address this topic again in another article.
Technical Data
🔺Altcoins haven't died; they are struggling to survive and providing buy-and-sell opportunities with high-profit margins to investors who use the right channels.
🔺Looking at TOTAL2, we can see that the downtrend was broken in January 2023, and it is consolidating and gathering strength before the next bull rally.
🔺$1.06 trillion is a critical pivot (fib 0.5). If there are closing prices above this level, we can say that the bull market has arrived. Otherwise, it will still present reasonable profit opportunities but will remain a reaction rally.
🔺Additionally, during the 2017-2018 rally, there were around 1,000 (let's leave the exact number to those who remember) altcoins, whereas currently there are over 25,000 altcoins. Choosing the right altcoin is crucial when there is a significant amount of money in the market. The number of slices in the cake has increased at least 25 times.
🔺Currently, the TOTAL2 data is testing the "AlphaTrend Sell Zone" resistance at $540 billion. If there are no closing prices above this level, selling pressure could increase.
🔺While the MACD generates buy signals, the RSI is struggling to break the 50-point resistance on the daily chart. If the RSI can close above 50 points, we can anticipate an acceleration in the upward momentum; otherwise, we expect increased selling pressure.
Bonus Chart 1: BTC.D 1W
🔺Bitcoin dominance continues to increase. Closing prices above 50.15 points can push Bitcoin dominance up to 54 points, which is expected to hinder the strengthening of the TOTAL2 data.
Bonus Chart 2: BTC.D vs ETH.D (Last 1 Month)
🔺In the past month, we witnessed Bitcoin dominance surpassing Ethereum dominance. But why?
🔺In its simplest form, we can say that the applications for spot ETFs for Bitcoin have played a role in this.
Dear reader, if you have read this far, I'm sure you have enjoyed it. You can give me feedback by liking and commenting. And if you happen to click on the share button, you can share this knowledge with people in your circle and together we can become stronger.

Total 2 - Altcoins minus BTC TOTAL 2 - Crypto Market Cap minus BTC
Three confirmations for bull status
1. Above 100 week SMA (No where close)
2. Complete 149 weeks in Pennant (Dec 2023)
3. Break above Point of Control (POC)
The 2018 - 2020 fractal is overlaid for perspective only
The Point of Control (POC) is the price level at which the greatest number of contracts have been traded within a volume profile (THICK RED LINE).
This line naturally coincides with resistance overhead.
Its important to recognize that the chart is just a perspective that aims at helping with timing an entry with a good potential outcome. With three indicators backing your trade you would have a better probability outcome. So we wait for the three confirmations to occur. Could you be accumulating sure.... but why would you when we are under the 100 week SMA appear to have more time to burn before a Bitcoin cycle really kicks off never mind the altcoins. Its important to recognize also that this chart includes ETH and ETH has been performing exceptionally well this cycle. I will be completing another chart excluding eth in coming days.
I hope this chart helps you time your trade and your positing into altcoins, when the time is right, when we have confirmations and the wind at our back.
PUKA

Important levels and dates for $altcoinsStill think we'll see one push higher before the continuation of the bear market, however, alts may have a capitulation move first.
If we look at Total2, we can see that $484B never got retested as support. So it would make sense that price action would need to test that level before a continuation higher. If it does get hit and bounces off that level, you can see the chart would form an inverse head and shoulders pattern.
I could see a large bounce higher happening after to tag one of the higher two resistances (I lean towards the $800B one).
Let's see if this plays out in the coming months. It looks like this would all need to play out before August.

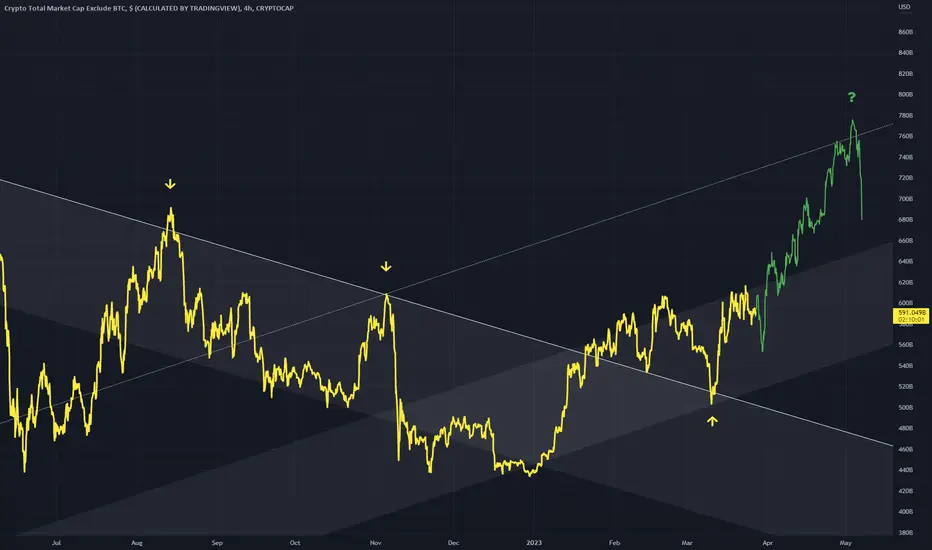
TOTAL2 Structural Similarities Early point in TOTAl2 evolution is showing similarities to the structure that is forming now on TOTAL2
This may be an indicator that market cap is going to go ballistic like it did in early 2016
Lets see what happens.

The REAL Crypto HALVINGWe are going to have a few weeks of down only and there is nothing you can do about it.
Half of the crypto marketcap is going to vanish in a quick tempo before things start looking bullish.
Buckle up!

TOTAL2TOTAL2
Analysis
TOTAL2 is the total market capitalization of cryptocurrencies, excluding the total capitalization of BTC.
The chart clearly shows the formation of a bullish wedge. This is a technical analysis chart pattern that usually heralds a future uptrend.
📐A bullish wedge forms when the price range narrows and trading volumes decrease.
Usually, the exit from the bullish wedge occurs upwards, with a breakout of the upper trend line. This signals a resumption of the growth trend.
It is worth noting that you need to use additional indicators and analyze the news background to confirm the correctness of your forecast. Always trade responsibly and with a cool head.
If you like the idea, don't forget to subscribe and rate like👍

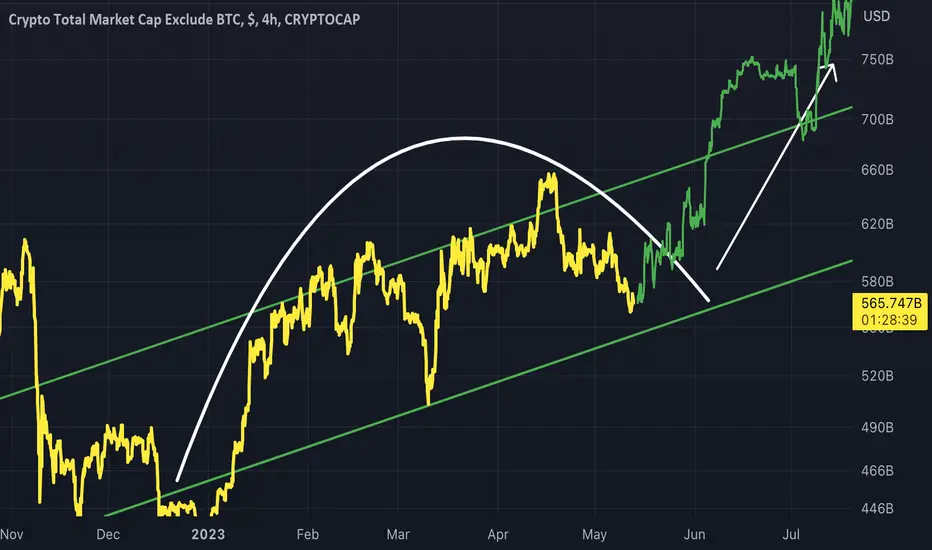
TOTAL2 - Rounded TopA Rounded Top structure on TOTAL2
This rounded top will result in an upward movement once completed within the channel
I have plotted an example upward movement with the bars pattern tool in green
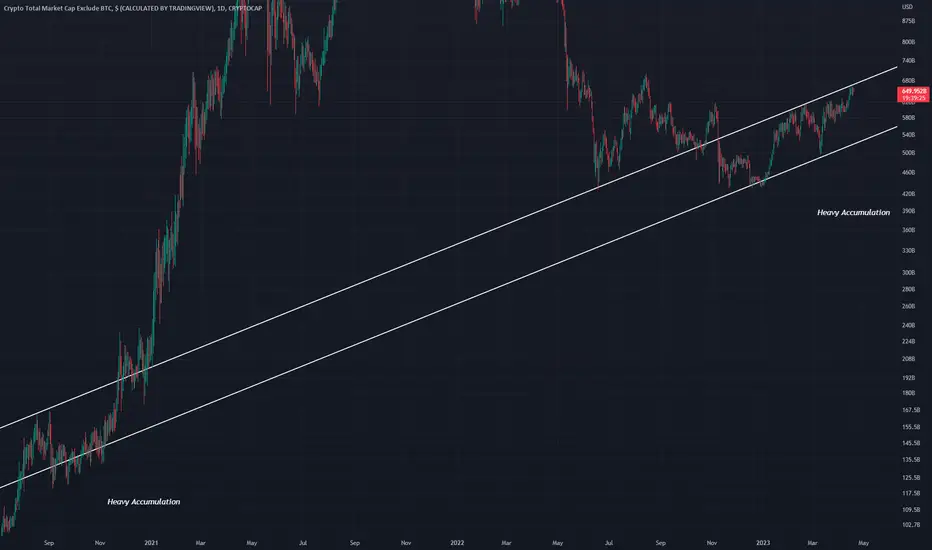
TOTAL2 Similar Price EventsHeavy accumulation is evident in these areas
A roll over top followed by strong movement is characteristic of the two
Right now the second one is just breaking out, as did the first in spectacular fashion
Bullish
ALTCOINS are bullish - TOTAL2 with weekly bullish divergencesAltcoin market with a weekly bullish divergence looks bullish overall and we expect the uptrend continuation in the mid-term.
We are not looking for shorts now.
When we get a pullback, it's a buy the dip opportunity.
How deep the pullback can be? The price may retest the key support again but most likely it will create a higher low and confirm its bullishness . Breaking (and closing below) the key support would be an invalidation of this trading idea.

TOTAL2 - Bull Continuation4Hr chart for the altcoin MarketCap (TOTAL2)
Some important channels to be considered, and a potential rise to the diagonal dotted line
This will be the smaller rally before larger one building
TOTAL MARKET CAP 12Hr UPDATE BY CRYPTOSANDERS
Hello dear traders, we here new so we ask you to support our ideas with your LIKE and COMMENT, also be free to ask any question in the comments, and we will try to answer all, thank you, guys.
TOTAL MARKET CAP ANALYSIS UPDATE:-After getting rejected from the strong supply zone, it is now bouncing off the ascending trendline support, where the Ichimoku cloud is also acting as a support.
The MACD crossover is losing bearish momentum, and as long as it holds above the Ichimoku cloud, we can expect a continuation of the bullish trend. While a solid break of the Ichimoku cloud will signal further correction in the Alts.
Sorry for my English it is not my native language.
Hit the like button if you like it and share your charts in the comments section.
Thank you

Crypto total market cap 45 % drop soon. Be ready!Total crypto market cap broke bearishly as Bitcoin did.
We expect a short term bounce and getting rejected at the strong resistance.
Final target for bears: 585 - 600 B
After that we expect the real accumulation face and the new bull market to start.
P.S Don´t get overexcited with a short-term bounce

TOTAL2 MA EvolutionThis is the 50,100 and 200MA
They are in their respective colors
I expect the 50 and 100MA to slowly curve around while the 200MA remains in a strong upward state
For those in long term
Weekly timeframe

#ALTCOIN MARKETCAP is Flashing Important Signal.Have a blessed Sunday to you all.
ALTMACP broke to the upside.
I am just skeptical about it for one reason, the confirmation candle closed in the red.
Unless we get a candle closing in green above the same, expect manipulation.
Be careful about holding the maximum portion of your portfolio in ALts.
Alt/BTC pairs will bleed.
I prefer holding BTC and a few alts with fundamental advantages like VRA is 230% already, HFT has started its run( Chart coming soon), and many other Gems APT did 4x.
So follow me if you want to know the next potential 50x coins!
DYOR, This is not financial advice.
Do show your support if you like my work.
Thank you
#PEACE

ALT M.CAP UPDATE! Hello everyone, if you like the idea, do not forget to support it with a like and follow.
Welcome to this TOTAL2 aka ALT MARKET CAP update.
TOTAL M.CAP is forming a falling wedge-like structure in the daily time frame and currently facing strong resistance at the upper trendline of the wedge. If it is rejected from here and starts dropping, we see a dump in Alts as well. In a bullish case, if it breaks out and gives a daily close above the red resistance line then more pumps are upcoming in Alts.
So basically I'm waiting for a reaction here first. I'm not longing for anything when Alt M.cap is at resistance.
What do you think about this?
Let me know your thoughts in the comment section.
If you like this idea then do support it with like and follow.
Thank You!

Total Crypto MC Could reject here...Just saw this and it didn't make me happy.
We could nuke hard here unfortunately.

#ALT MARKETCAP Hitting a Major Resistance. What's Next ??ALT MARKEPCAP is hitting the resistance right now.
This is a threshold point for the alt market.
If the index breaks this resistance alts will pump along with BTC.
I will keep this chart updated follow me for more.
Hit the like button if you like it and share your views in the comment section.
Thank you
#PEACE

TOTAL2 IdeaIdea for TOTAL2 showing points in grey circles crossing the indicator leading to the indicator flipping to its bullish state
This can be observed to be currently happening on price
Will history repeat?
I suspect we will see a bit of a relief / bear market rally following all of this bloodshed

TOTAL2 Altcoins looking ready for a PARTYLooks like altcoins are going to have a party soon with green dildos. Nice.

total2 chart seems that altcoins will drop 40% or morealtcoins will drop more , please pay attention ....
