TOTAL 2 About to breakoutTOTAL 2 has two possibilities and most likely it will breakout on the 5 try.
Manage your positions carefully.
Totalcap

ALTS have more room for growth than BTC2.618 is the target for Altcoins (total2)
2.618 has been reached on TOTAL, which incorporates bitcoin.
I believe we will see a strong altcoin dominance this year
Attaching some of my previous TOTAL2 and TOTAL charts
I am long BCH, AugurV2, Ethereum..

Moving Average Analysis - MCAPFrom these charts we can draw the conclusion that the chart 'OTHERS' is developing the separated three moving averages that can be seen on TOTAL.
A moving average pattern like this can last from months to years.
We can also draw the conclusion that Bitcoin is not completely connected to alt-coins and there is a disconnect between the two. Also we may see OTHERS excel above TOTAL, as it is clear that the chart is at a younger stage of development relative to the moving average structure.
Interested to see how this plays out. Remember, Diamond hands!!

TOTAL MARKETCAP on Important Support!
This is the TOTAL MARKETCAP CHART : Candle closes in the next 1 hour 7 minutes and is currently on the support.
If it holds the 50D MA on this 2 hour chart It's highly likely that the whole market will bounce back.
Do hit the like button and share your views in the comment section. Follow me for more updates.
#PEACE

TOTAL2 Further researchTOTAL2 seems to be in a bullish trend
further analysis of this uptrend will be done

TOTAL2 possible TOPan idea for the top of the total market cap excluding bitcoin
A previous rejection at 4.618 shows potential for future rejections
This is the next strongest trend where 4.618 can be seen to be a potential rejection point

Market Cap Idea TOTAL2Continuation of the apparent parabolic rise that is occurring
Looks very bullish
#TOTAL #TOTALMARKETCAP #CRYPTO #weeklyHi guys..its the latest analyze chart of TOTAL(total market cap)in weekly timeframe.if you are interested any crypto that you want analyze with me and any questions please do not hesitate and comment below the chart!
if u like it press like-comment and folow me.thx

TOTAL2 Extended wickYou can see the wick extend over the fib level .382 and 0.618 in W formations,
Bull run may repeat, could be a disbelief phase
Personally I am long ETH, massive potential
Heres another idea for BLX

Total Market Caps Still in UptrendThere has been a period of consolidation over the last few weeks with no major moves yet. Alts have started moving up, but still seeing a lot of bearish opinions and uncertainty.
The top panel you will observe the Total MC for cryptos. It's currently in a symmetrical triangle.
The bottom panel is all Altcoins, which is in an ascending triangle.
I'm expecting a break one way or the other in about 36-48 hours from now. The probable direction is up for many reasons.
1. We are still in an uptrend.
2. Bitcoin is still above $30K and the Alts are consolidating after decent moves up.
3. Institutional interest is still there; evidenced by Marathon's big buy.
4. The dollar is currently still weak and can't get above the 50D EMA.
5. Lots of bearish thinking.
I think we go up to the targets with the green dotted lines, followed by a decent correction back down to test present levels, followed by the Altseason everyone's been waiting for. This move will likely take the market cap for Alts to $720-$750B
It goes without saying that a breakdown from these levels will likely end our present uptrend, but that possibility is minimal imo.
Remember this is only my formed analysis outlook. This is not an endorsement or recommendation to buy or sell.

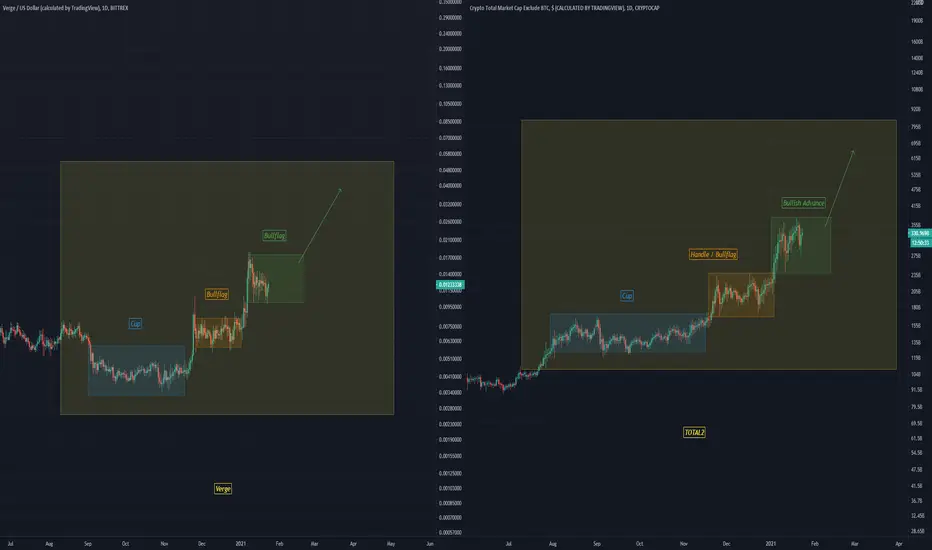
VERGE / TOTAL2 Comparison, upward likelyTOTAL2 compared with verge
each had initial cup formation
Verge took a more bullflag approach to the comparison
TOTAL2 looks more like its concealing a lot of beartraps
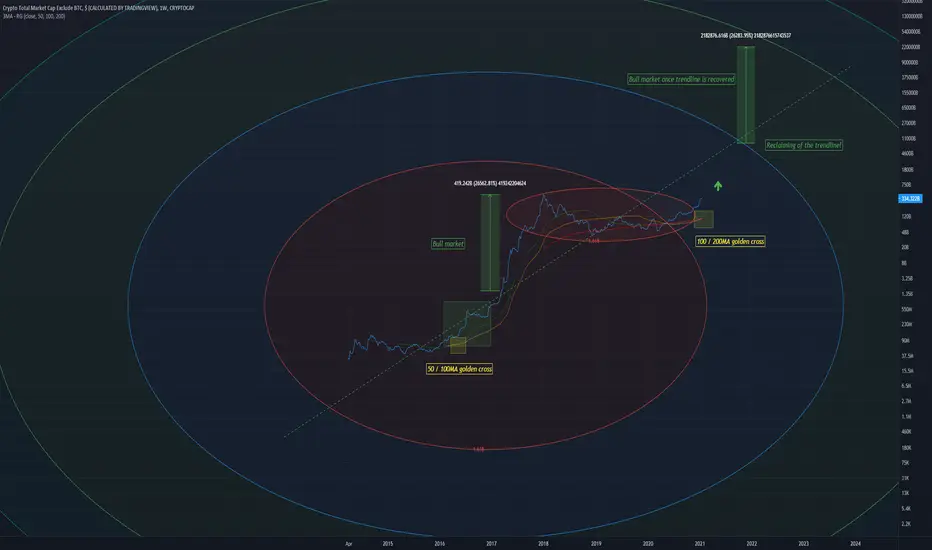
Conspicuous Golden Crosses TOTAL2First it was a 50 /100 MA golden cross
Now we are faced with a 100 / 200MA golden cross
This should lead to the reclamation of the major uptrend line, if you are looking to buy realise you are still early. Very early.
This golden cross will be epic.
A bullish TOTAL2 scenario MACDABC
Expecting a sharp move up above the ATH
Creating a new ATH and enters discovery price zone
MACD says it all
The gap fill, if it occurred would be horrific.

Market Cap Moon TOTAL2TOTAL2 is headed for a huge range upwards once this bullflag that is forming completes
Will the spiral be respected further?

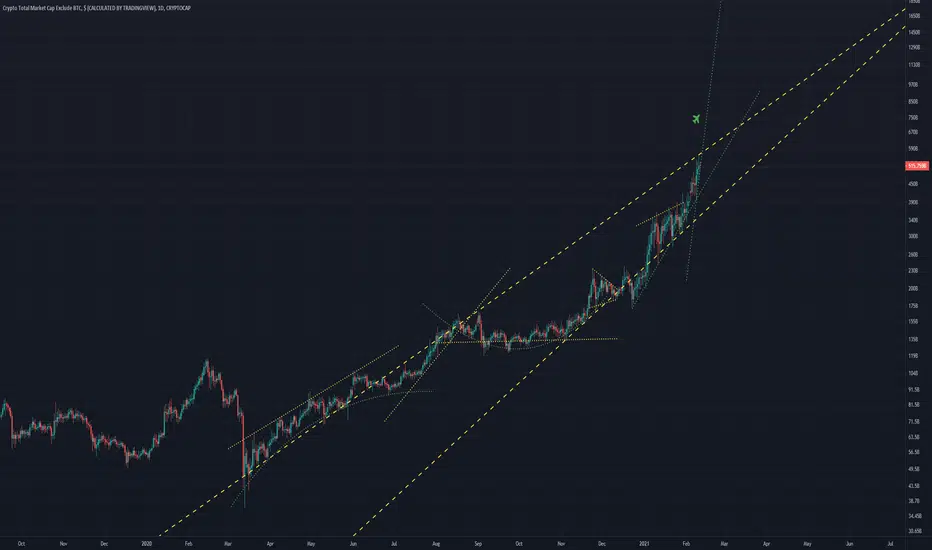
TOTAL Possible extension furtherIf history is anything to learn from, this move currently may extend quite a bit higher than the trendline (2)
Reclaimed the trendline of the spiral


Mixed signals at trendline TOTAL2TOTAL2 has recovered very well
Hopefully the bullflag plays out! (Abstract thought)
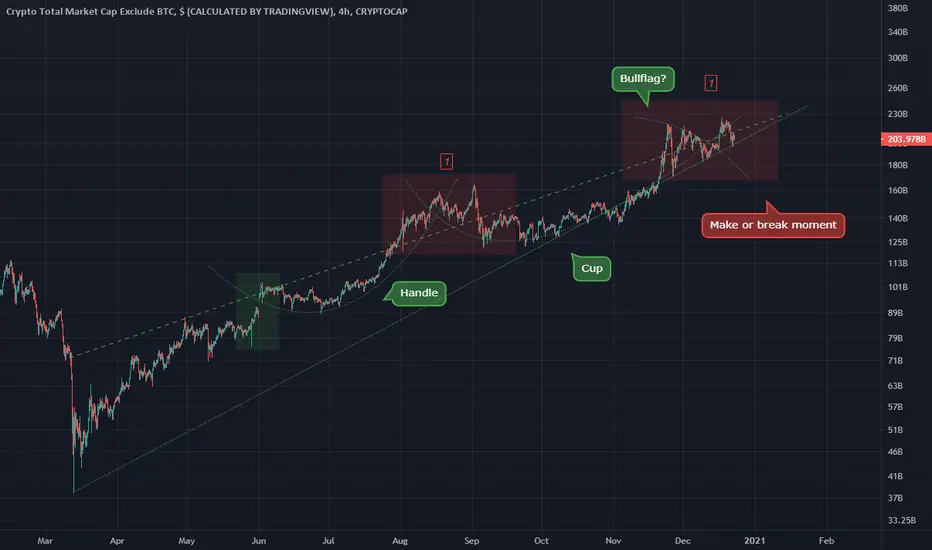
Looking at the total marketcap TOTAL2Three rejections within this trend that has formed
Hoping this formation will push the market cap to ~700B
The rounded top formation is very apparent currently and is quite bullish, as seen on linked chart (highlighted pattern in yellow)
Merry Christmas!


A nice fractal TOTAL2A fractal around the occurrence of golden crosses in these areas circled.
I hope a bullflag will form outside of the circle.
This is the altcoin market

TOTAL2 Bullflag - ContinuationTOTAL2 has transition to 2.618 within the strongest Fibonacci circle trend.
This will likely lead to the bulls continuing their run.
Its a strange pattern but I believe it can be interpreted as a bullflag once the area within the triangle (flag) completes.
In the attached chart I see a large bull impulse move coming within this newly discovered 2.618 territory (on the MACD). Many will be shaken out at this level however.

BTC - Trend reversal? - Maybe the end of this parabolic move Hello guys,
I wanted to share my idea about the future of the crypto market.
We have had huge volume in the past few weeks. This climax is not seen on the Bitcoin charts. Maybe bc of the shared volume in all different exchanges.
There is a wisdom in trading: Volume never lies!
This not means it is over at all, but for this trend, we have a reversal.
It is time to take profit and enjoy life.
Have a good time.
Some facts about climax (source investopedia):
-A climax occurs at the end of a bull or bear market cycle and is characterized by escalated trading volume and sharp price movements.
-Climaxes are usually preceded by extreme sentiment readings, either excessive euphoria at market peaks, or excessive pessimism at market bottoms.
-Essentially, climaxes are a result of supply and demand factors.
