ALTS MARKET CAP – Weekly Chart Update. ALTS MARKET CAP – Weekly Chart Update.
Altcoin market cap is respecting a rising support trendline, keeping the higher-low structure intact.
The recent pullback looks corrective, not a breakdown — price is consolidating above trend support.
Major liquidity zone/resistance sits around the 1.6T–1.7T area, where supply previously entered.
Holding above the 1.1T–1.2T base keeps the long-term bullish structure valid.
Support holds → continuation move toward 1.6T+, opening room for a fresh alt expansion.
Clean breakout & acceptance above resistance → strong altseason acceleration.
Loss of trendline → deeper range consolidation before next leg.
Altcoins are building strength quietly. Patience near support often precedes impulsive upside moves.
Focus on structure, not noise.
Not financial advice.
Totalcryptomarket

TOTAL MARKET CAP Chart Update. TOTAL MARKET CAP
Total crypto market cap is trading inside a rising parallel channel, maintaining the broader uptrend.
Price recently reacted from the lower channel support, indicating dip-buying interest.
The 100 MA and 25MA / dynamic average zone is acting as a key reaction area holding above it keeps structure healthy.
Previous rejections near the upper band highlight where profit booking usually starts.
Above channel support → Bullish continuation toward mid–upper channel levels.
Break below support → Short-term weakness, deeper pullback possible before next expansion.
As long as TOTAL holds the 3.0T–3.1T support zone, the broader market structure remains constructive, favoring gradual upside.
Watch weekly closes for confirmation.
Not financial advice.

TOTAL Market Cap — Still in a Bullish CycleThis idea is meant to provide perspective and a bit of reassurance during the current correction
At the moment the TOTAL still has some downside potential — roughly 11% (bottom of blue support zone =Max pain zone?)
As long as price remains above this level the market stays within a bullish/rising cycle
Only a breakdown below it would confirm a transition into a true bearish phase
For now we are still in a bullish phase and such corrections are completely normal
Looking at historically
- In the previous cycle corrections reached up to 60.5%
- In the current cycle the deepest correction so far has been around 49%
Even a further drop of 10% from here would still fall within the range of a healthy macro correction
Historically such corrections have consistently been followed by
- strong recoveries of 100%+
- and a break above the previous high
As long as structure holds - this remains a correction within a bullish trend

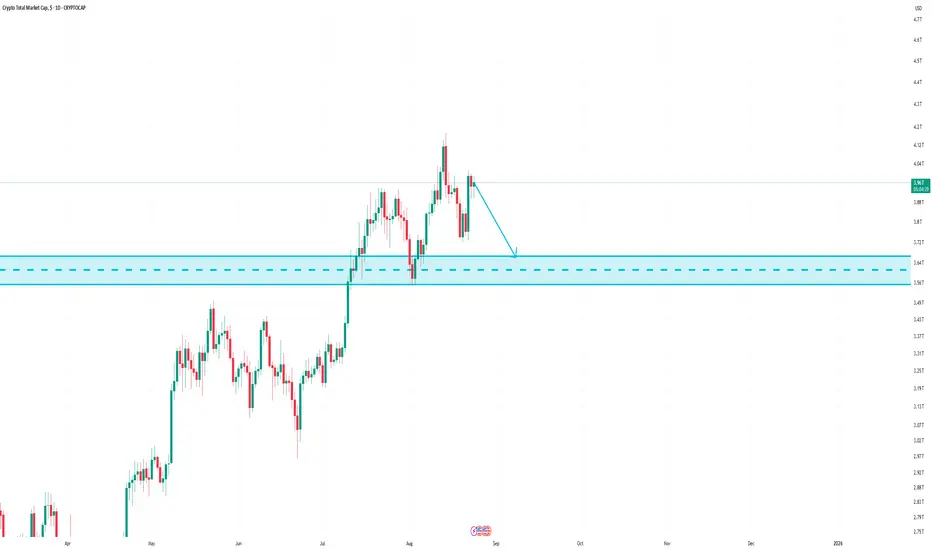
CRYPTO TOTAL MARKET CAPCRYPTO TOTAL MARKET CAP – Small Update 📊
The market is compressing inside a falling wedge.
A breakout above the trendline could trigger a strong move toward $4.0T–$4.4T.
Holding the lower support keeps the bullish scenario intact; rejection may cause short-term consolidation.
DYOR | NFA.

FireHoseReel | TOTAL3 Consolidation Signals the Next Market Move🔥 Welcome To FireHoseReel !
Let’s dive into Crypto Total Market Cap Excluding BTC & ETH (TOTAL3) analysis.
👀 TOTAL3 4H Overview
TOTAL3 is currently moving inside a 4-hour range, and the top 10 coins in the market are also consolidating within this box. From a pure supply–demand perspective, a breakdown below the range low could apply further downside pressure to this index and trigger broader weakness across the top 10 coins.
✍️ TOTAL3 Trading Scenarios
🟢 Long Scenario:
A breakout above $900B can act as an alert zone for the first bullish wave in the market. Setting an alert around this level allows you to stay engaged if upside momentum starts for top-tier assets.
🔴 Short Scenario:
A breakdown below the range low could increase selling pressure across the market, leading to stronger capital outflows from the top 10 coins.
🧠 Protect your capital first. No setup is worth blowing your account. If risk isn’t controlled, profit means nothing. Trade with rules, not emotions.

TOTAL market cap to hit all time high! 🚀 Why I believe TOTAL MARKET CAP is bottoming & gearing up for a run to new ATHs 🟢📈
After reviewing Elliott Wave counts + classical price action, the structure looks extremely constructive. Here’s why 👇
🔍 Key Reasons I'm Expecting a Major Rally:
Wave 4 appears complete 🧩
Price just tapped the long-term trendline exactly where Wave 4 should typically end — shallow, corrective, and sentiment-driven.
Clean ABC correction ✔️
The drop has formed a textbook A-B-C zigzag, with Wave C terminating right on structural support.
Approaching major long-term trendline 📉➡️📈
Total market cap is retesting a multi-year ascending trendline that has held throughout the entire macro cycle.
A bounce here would be structurally consistent with the start of a Wave 5 rally.
Wave 5 structurally due ✨
Elliott Wave theory expects a strong, impulsive Wave 5 after a clean Wave 4 retracement. These are typically high-momentum rallies.
Bullish confluence across timeframes ⏳
Daily + weekly oversold metrics line up directly at major structural support.
🔥 If this read holds, TOTAL MARKET CAP could be preparing for a rally straight into new all-time highs.

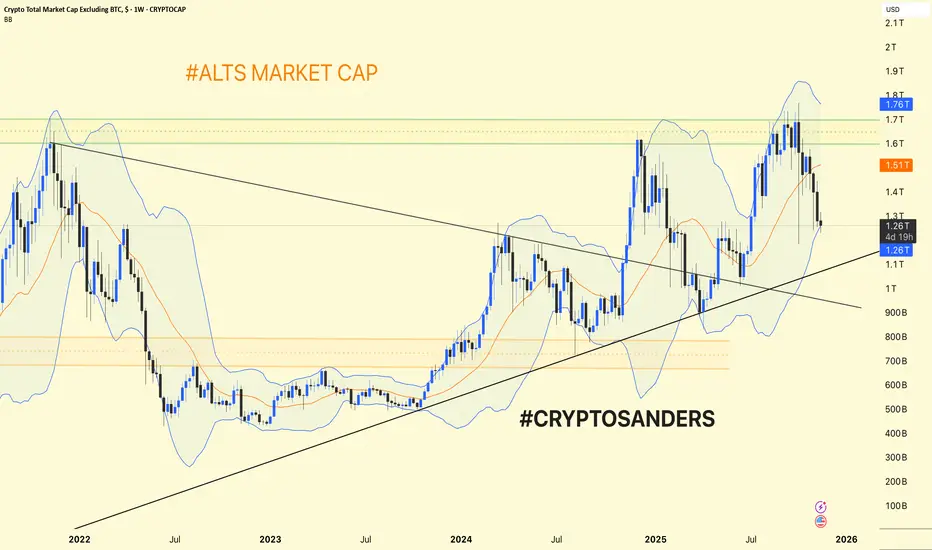
Alts Market Cap (#ALTS) Weekly Chart Update & Analysis. Alts Market Cap (#ALTS) Weekly Chart Update & Analysis
Trend Structure: The altcoin market cap (total crypto market cap excluding BTC) is trading within a broad uptrend channel after a major breakout in early 2024.
Support is currently found near $1.25T (recent swing low and channel support).
Resistance remains around $1.51T (orange line) and $1.76T (major horizontal/upper Bollinger Band zone).
Bollinger Bands: The chart uses weekly Bollinger Bands—price has pulled back from the upper band ($1.76T) and is now holding the midline ($1.26T) as short-term support.
A successful hold above $1.25T keeps the uptrend intact and sets the stage for a move back to $1.51–$1.76T.
A breakdown could lead to a deeper dip toward the long-term rising trendline (currently around $1T).
Alts are consolidating at higher lows inside an uptrend. Holding above the $1.25T area signals strength; a break above $1.51T confirms fresh upside momentum, while losing $1.25T would signal caution for further corrections.
DYOR | NFA
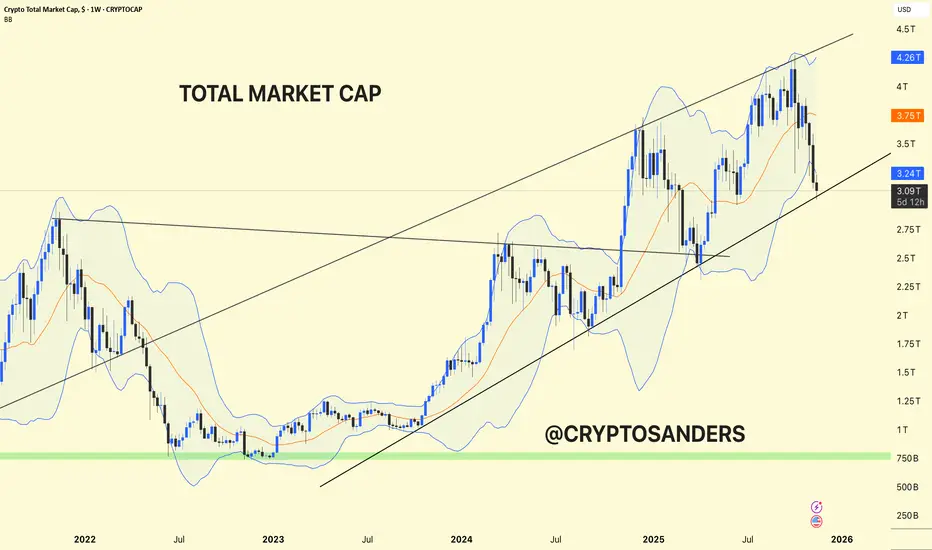
Crypto Total Market Cap. Crypto Total Market Cap – Weekly Chart Analysis & Full Update
The entire crypto market cap is trading within a large ascending channel, keeping the long-term uptrend intact.
Recent Action: After making new highs above $4 trillion, the market has corrected sharply, pulling back to the channel's lower support around $3 trillion USD. This area is a historic pivot and should act as strong support if bulls remain in control.
Upper channel resistance is near $4.4T.
Major horizontal support is well below, near $800B (green zone), but the current structure keeps the market safely above that.
A sustained break below the channel could lead to deeper retracement, while a bullish hold here sets up for another rally.
Holding this channel support can produce a recovery phase, targeting previous highs and new all-time highs.
Losing this support could trigger broader risk-off sentiment and test much lower ranges.
The crypto market is at a critical inflection—channel support is being tested after a steep correction. Staying above $3T maintains the bullish structure. Watch for a decisive bounce or breakdown in the coming weeks.
DYOR | NFA
Riding the Crypto TOTAL Market Cap WavesHey stars ✨ — just popping in with a little dose of chart magic and market wisdom 🌙💫
I’ve been watching the TOTAL Crypto Market Cap chart (yes, the big picture one!) and something beautiful is forming — a rising channel pattern on the weekly timeframe. It’s like the market is climbing a staircase of light, pausing to recharge, and then glowing higher again.
Here’s what I’m seeing:
The channel support has held strong three times already 🌟 — each bounce confirming that this trend still has confidence and flow behind it.
Every time price touches the top of the channel, we tend to see a pause or small correction.
So, the rhythm is:
🌟 Buy near support.
🌟 Take some profits near resistance.
It’s simple, elegant, and works beautifully when the market respects structure.
But… we never want to get too comfy in a single scenario 👀✨
Because when a channel finally breaks, it can go either way:
A break above the channel often signals acceleration — and that’s when we wait for a retest of the breakout to go long again 🚀
A break below means the trend is losing its shine — and we can prepare to short or hedge after the breakdown retest ⚡
So, whether you’re team bull or bear, keep your eyes on that linework. The market always gives a little whisper before the next move… if you’re calm enough to listen 🌌
Let’s trade smart, stay kind to ourselves, and remember — good energy attracts good setups ✨💫

BIGGEST Crypto Liquidation TO DATE - Market CorrectsToday and yesterday over the past few hours, $19 billion dollars was wiped out in crypto. This is historic. And also a lesson in risk management, an eerie reminder of how risky speculation can be.
The market was over leveraged , and this is the result.
How can we monitor/ safeguard against this going ahead and be prepared for such an event in the future?
1) Always use a stop loss
2) Watch Bid/Ask spread and volatility
3) Use proper risk management
On the 10th of October, POTUS Donald Trump Tweeted about a new set of trade measures that include 100% tariff on certain Chinese exports, and new stricter export controls. The market immediately reacted; stocks and commodities dropped and crypto fell into chaos. What made this worse is that several exchanges were down, resulting in investors being unable to close or update their positions.
It seems like a fitting "reason" and also not, oddly. What we need to note here, is that the market was over leveraged. This is a self-correcting event that presents truer market reflections and better prices for investors - a blessing for those who were not affected/invested.
As an extra measure if you trade S&P500, you could watch the VIX - and set an indicator to any daily change greater than 15%-20%. This way, you'll be notified if there's action in the stock market.
You can also take a look at this idea on Risk vs Reward:
TOTAL #ALTS market cap structure looks bearish. TOTAL #ALTS market cap structure looks bearish.
🚨Are we about to enter a corrective phase and see a few red days?
Breakdown or bounce, what’s your bias?


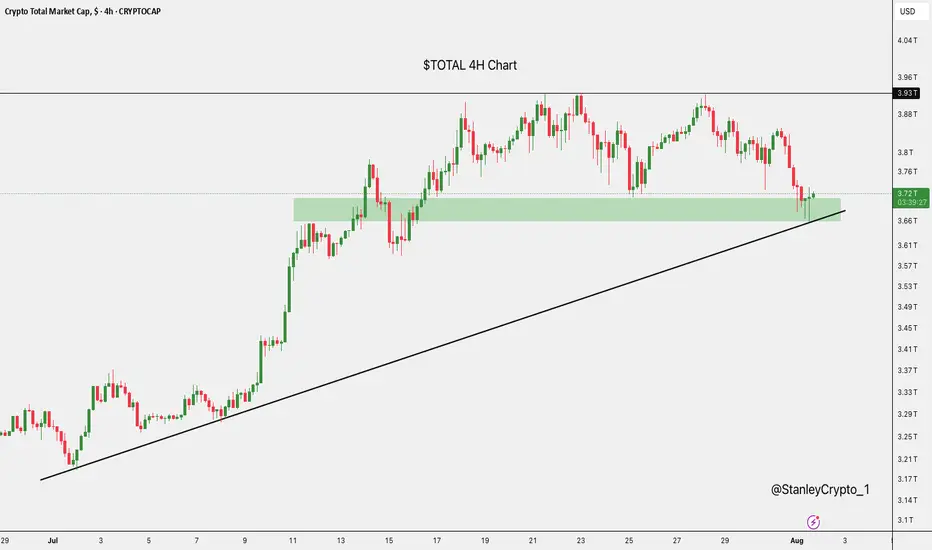
$TOTAL at Key SupportThe crypto market cap has just bounced off a strong support zone around $3.67T, right where it aligns with the rising trendline.
This area has held firm before, and it's doing the same now.
If it continues to hold, we could see a nice recovery.
But if it breaks down, there’s a risk of more downside ahead.
Altcoin Market at Critical Resistance!The total crypto market cap excluding Bitcoin (TOTAL2) is still sitting right below a crucial resistance zone. A breakout from here could trigger a strong altcoin rally — but until then, patience is key.
It’s a waiting game now…

TOTAL Analysis (12H)Red candles may be approaching for the TOTAL market cap parameter.
Currently, TOTAL is sitting right on a strong support zone that has held multiple times in the past. However, if this level fails to hold, the market could experience a sharp decline in the coming days.
Two Possible Scenarios:
Bullish case: If the market manages a bounce this week, there’s a risk of forming a Head and Shoulders pattern, which could act as a reversal structure unless invalidated quickly.
Bearish case: TOTAL has already mitigated a key supply zone (marked in red on the chart). A logical move here would be a retracement down to a nearby demand zone to regain strength for a fresh upward push.
If the current support is lost, we can expect a drop toward the green demand area between 3T and 2.85T.
Opportunity Zone: This range (3T–2.85T) will be ideal for long-term long or buy positions once reached, as it represents a high-probability rebound zone based on historical price behavior.
— Thanks for reading.

This Chart Screams Strength — Are You Positioned?The total crypto market cap is currently showing a very strong technical setup. It’s holding firm at a major long-term rising trendline, which has historically acted as a launchpad for massive bullish moves across the market. Additionally, the 100 EMA is providing solid support, further reinforcing this zone as a key demand area.
We’re also seeing a bottomed-out Stochastic RSI, now starting to curl upward — a classic early signal of momentum shifting back to the bulls. Although the market is still sitting just below the long-term resistance line, this type of structure often leads to strong breakouts once confidence returns.
If this trendline support continues to hold and the market cap begins pushing back toward the $3 trillion mark, we could see a major surge in altcoin strength. Historically, this is when altcoin capital rotation picks up and narratives gain momentum. Overall, the crypto market is flashing strength — and this might just be the calm before a powerful altcoin rally.
Thanks for reading! Please do like and follow us for more updates.

Total 3 targeting 1.5TWelcome back dearest reader,
This is going to be a short one, all information is in the chart above.
Total 3 has been in a Massive Cup and handle formation.
Measured from the base of the cup till the top of the handle gives us a ''total 3'' price target of 1.5T$ which is 100x from here. If you were to do a different analysis and like flags more then we come to the same price target of 1.5T$ (Blue bars).
Price action is now retesting resistance from march 2024 as support. When this is done i expect blast-off mode.
~Rustle

I think we will see 1.7T in 2026.The most probable scenario in my head.
* What i share here is not an investment advice. Please do your own research before investing in any digital asset.
* Never take my personal opinions as investment advice, you may lose all your money.

TOTAL2 - Weekly Support Possibility The middle of this indicator was previously seen as a strong support
Right now this is being tested as support right now
Will it act as support as before or break down further?
Weekly timeframe for this indicator which is still in its bullish state

TOTAL CRYPTO MARKET CAP is back-testing the cup & handle patternIt's no mystery that the crypto market has been getting hit pretty hard since mid-December. However, the total market cap—which had previously broken out of a nice cup-and-handle pattern—is now backtesting the rim line and looks to be setting up for what could be an incredible move upward over the next 6 to 9 months, with the potential for a double within that timeframe.
Good luck, and always use a stop loss!

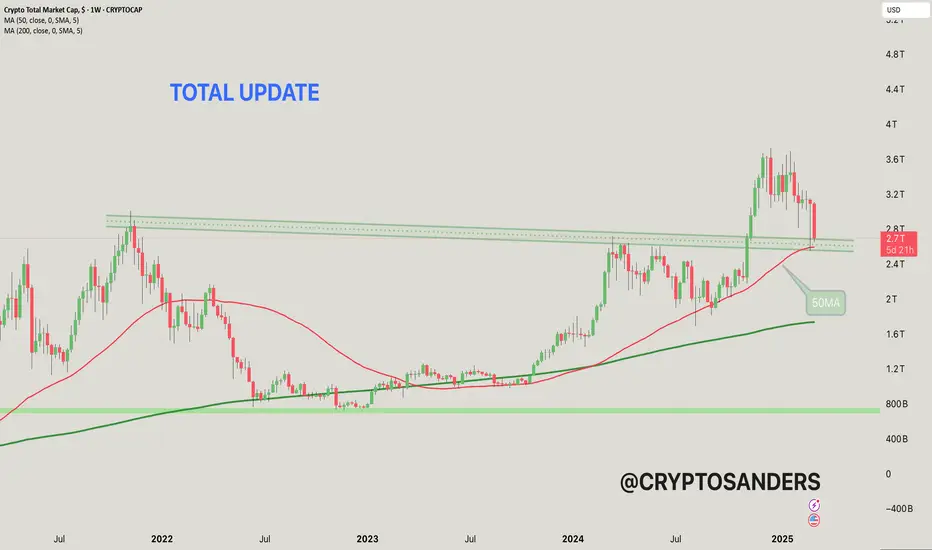
This chart shows the total cryptocurrency market capitalization,
The current value is around $2.271 trillion, which represents a significant drop of 12.51% from the recent peak.
50-MA (moving average): The red line represents the 50-week moving average, which is currently around $2.59 trillion. It acts as a short-term trend indicator and potential support level.
200-MA: The green line represents the 200-week moving average, which is around $1.73 trillion, which indicates a long-term trend and strong support level.
The horizontal green lines represent support levels around $2.4 trillion and $2.6 trillion. These levels are important for a potential bullish reversal if retested.
The dotted line above the price represents resistance levels near historical highs.
The recent decline suggests the market may be in a bearish trend after failing to break the resistance levels.
If the price is above the 50-MA, it could signal a reversal towards the resistance zones and a potential recovery. However, a break below the 50-MA could signal further decline. Keep an eye on the key levels around $2.4 trillion (support) and $2.6 trillion (resistance).
If you found this analysis helpful, hit the Like button and share your thoughts or questions in the comments below. Your feedback matters!
Thanks for your support!
DYOR. NFA
TOTAL2 - Rising MegaphoneThis structure allows for strong bullish continuation on this TOTAL2 chart
The green area line shows the continued support for price, this is also the 50MA
I believe we are going to see more support for alts and therefore the market cap will increase
Bullish on this Weekly
