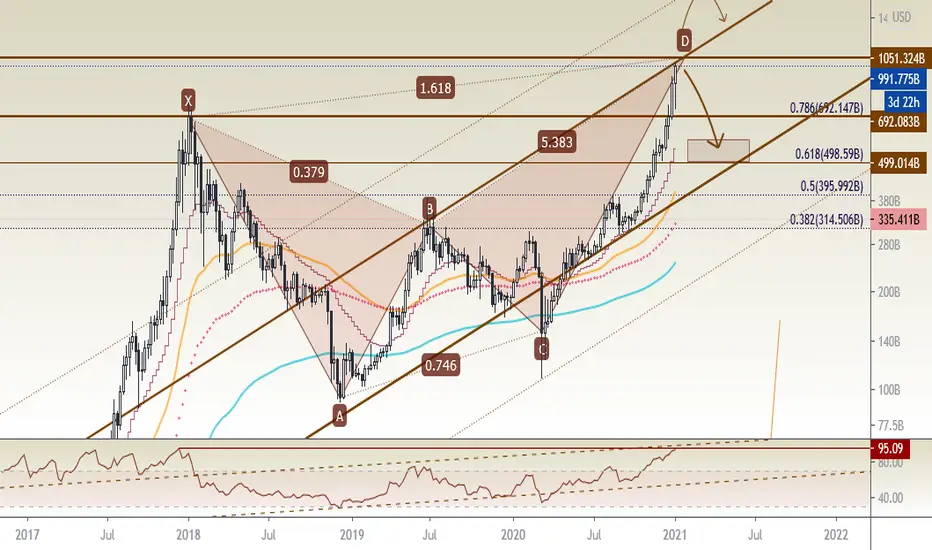
Bearish Formation on Total Crypto Market CapCrypto Total Market Cap is forming a Bearish Butterfly Pattern as well as hitting the top of an ascending channel that it's ranging in for the last two years. I expect a correction to $500B which is %61.8 of the CD wave of the pattern, after hitting $1,051B. In another case it can break $1051B to the next dynamic resistance at $1,700B - $1,800B.
Totalcryptomarket
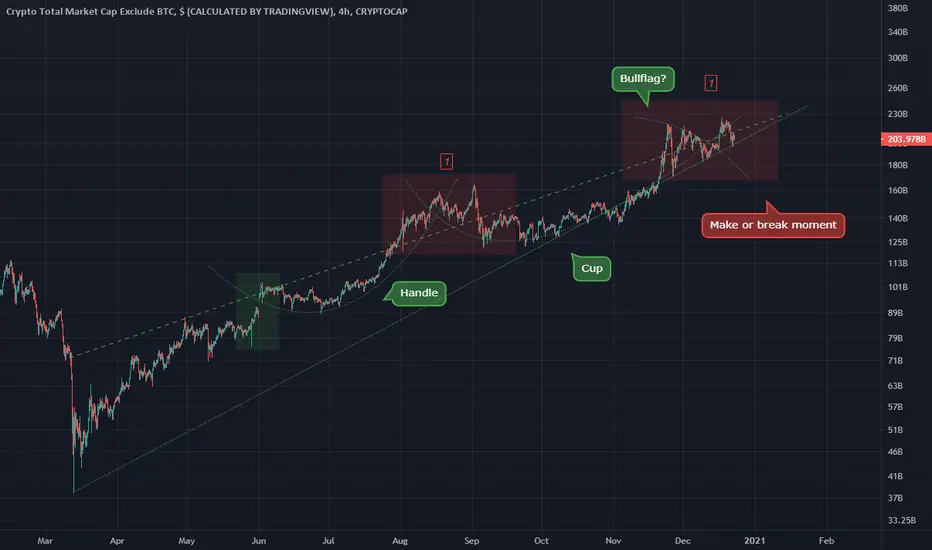
Market Cap Moon TOTAL2TOTAL2 is headed for a huge range upwards once this bullflag that is forming completes
Will the spiral be respected further?

TOTAL Possible extension furtherIf history is anything to learn from, this move currently may extend quite a bit higher than the trendline (2)
Reclaimed the trendline of the spiral


Mixed signals at trendline TOTAL2TOTAL2 has recovered very well
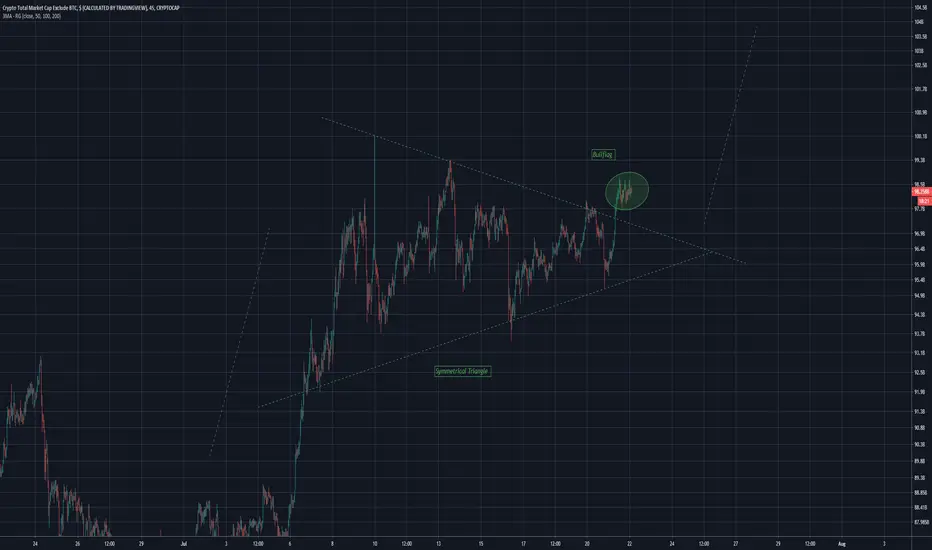
Hopefully the bullflag plays out! (Abstract thought)
CRYPTO TOTAL MARKET CAP (Y20.P5.E2).What does it tell us?Hi All,
I thought I take a look at the total crypto market chart and see if it gives us any clues to what's next.
Observations:
> Previous all time high in 2017, where BTC was 19800 (depending on the exchange) had a bigger market cap than now;
> When BTC was at its ATH, BTC dominance was at its lowest? Opposite of today, so far;
> BTC dominance seems to have a strong resistance around 68% level on a few occasions;
> BTC dominance in 2019 made ALT (prior to 2016 there weren't many coins on the market), above 68% and ranged for a while, while BTC did a distribution structure;
> Current BTC dominance is at 67.35%
> On the chart, I have the weekly levels of the candle stick (body) resistance levels, total market cap did not hit target because of this drop;
> As you can see, the BTC dominance historically has another level of resistance 72.8% which which occurred twice, but we don't know the relationship based on the chart;
> MACD on the weekly total market cap is still bullish with upward pressure, however its a delayed indicator; This weekly closure could tell us if we are to have that big pullback;
THOUGHTS or CONCLUSION:
The total market cap is still falling short from the previous high, so much of the hype on BTC price doesn't really be backed by the total market cap, even though we have much more coins and much more maturity in the crypto space, the market cap could be a indication as to where the major resistance is, not the price of BTC or but the market cap ATH mark or the weekly resistance.
For now, the red line of the weekly resistance could be the level where BTC might find resistance and have that pullback or at the all time high, double top resistance level on the total market cap.
BTC dominance is likely to have a rejection or ALT season when it reaches 68% level or like previous times, at 72.86%
That's what I'm taking away from this TA and keeping an eye out for.
All the best traders,
Regards,
S.SAri
PS. Yesterday I posted some observations with the general market and how BTC drop was in sync with the general market drop.
Until we see it go up, or sideways, BTC will be in uncertainty territory.

A nice fractal TOTAL2A fractal around the occurrence of golden crosses in these areas circled.
I hope a bullflag will form outside of the circle.
This is the altcoin market

TOTAL2 Bullflag - ContinuationTOTAL2 has transition to 2.618 within the strongest Fibonacci circle trend.
This will likely lead to the bulls continuing their run.
Its a strange pattern but I believe it can be interpreted as a bullflag once the area within the triangle (flag) completes.
In the attached chart I see a large bull impulse move coming within this newly discovered 2.618 territory (on the MACD). Many will be shaken out at this level however.

Total Market Crypto Cap - Head and shoulders + Triangle warning- Overall total market cap is not looking good right now
- We can see this head and shoulders and also the descending triangle - 2 bearish patterns!
- I expect lower prices, also as you can see, we finished our Impulse Elliott Wave
- You can profit by this crash easily, just use futures market and enter a short position - I recommend SNX coin for example
If you want more of these ideas, please hit the like button and follow me, so you don't miss any update!
Also, check my signature down below ↓


TOTAL2 Sine lineUsing sine line to plot a bull run and potential future bull waves
Some other ideas attached, bullish ones

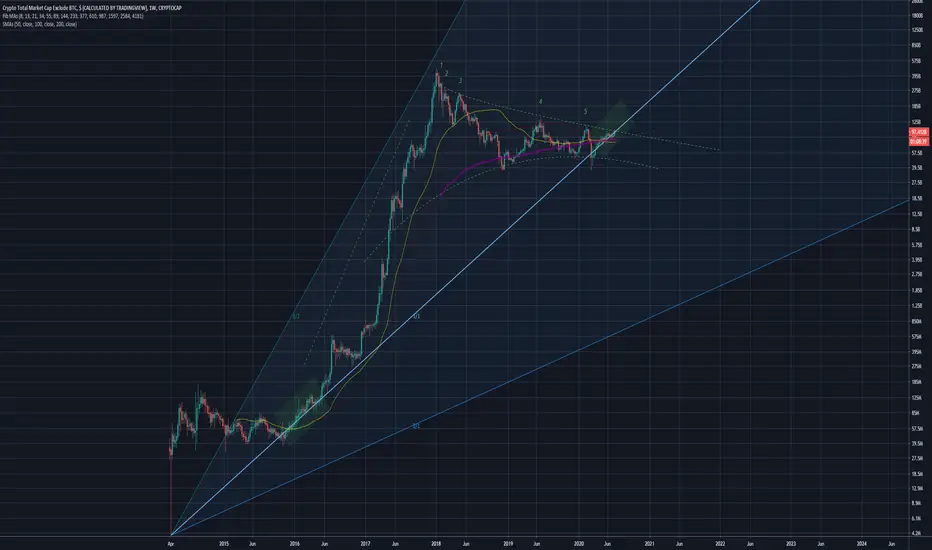
TOTAL Spiral Target 1BUsing spirals to forecast a top for the cryptomarket cap
Two spirals are used a minor trend and a major trend (extends over a longer period of time)
Both align around the 1B mark
Not get shaken out! Very early stages of a bullmarket.
I recommend ETH, BCH for buys.

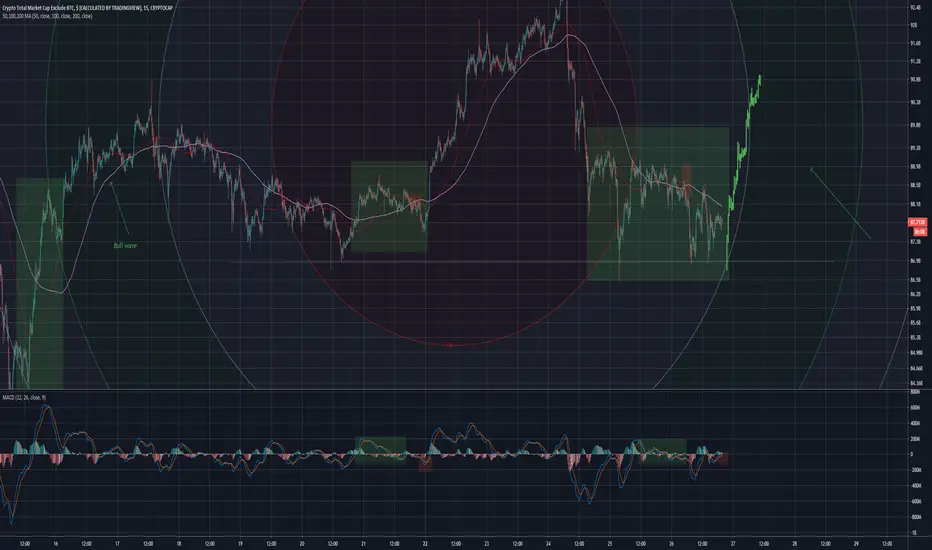
A rounded formation TOTAL2Rounded formation
These can turn very bullish once completed
Short term it looks bearish, however this is good in the long run.
Giant Bullflag
Strange times

Total Crypto Marketcap to reach 420B by end of 2020Fib extension + AB=CD harmonic and historical resistance all align right around the big friendly number: 420B
Could there be anything more crypto?

TOTAL2 H&S SetupLooking for a H&S formation
A right shoulder has already formed
return to key fib level
I still feel the bullish within this one however..

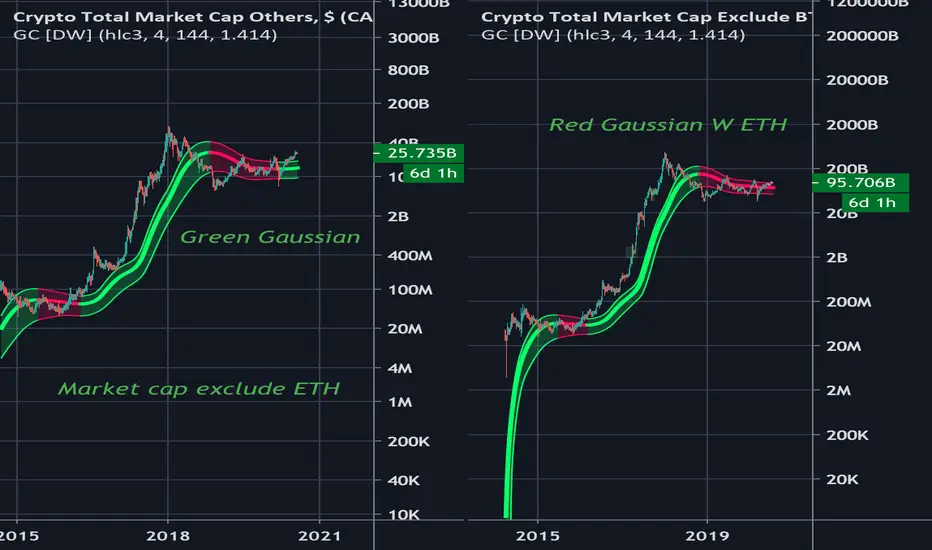
ETH Holding the Altcoin Scene Back - Read!It can be seen on the chart that excludes bitcoin and ethereum that alts have been popping off. With a Gaussian Channel that is green.
The market cap that includes ethereum the Gaussian channel can be seen to be still red.
Once this turns green the real altcoin rally will begin.
I still believe that it is alt season when TOTAL2% > TOTAL in either direction, positive or negative, it is alt-season.
Go long Ethereum, Marry the market.
TOTAL2 Lift off?Sitting on top of major trend line
with a golden cross imminent
This may lift off, volume seems low
TOTAL2 Very strange times are comingMonthly MACD cross
Mirror RSI level reached
I don't like to sound like a doomsayer but this looks quite scary bullish, capitalize.

Oh baby its a Triple??Speculative scenario for 3 falling wedges
TOTAL2 - Altcoin market
1Hr timeframe

TOTAL2 More thoughtsThoughts
Correction with a rounded top, leads to extreme bullishness
Or ascending scallop bull run?
Both result in large bull runs a correction will just leave some time to wait before the next bull run.

TOTAL2 FractalA fractal indicating possible bullish movement
The bars pattern is of course very speculative