BG Trade ReviewRecent sessions produced several short-term momentum opportunities. The watchlist was created from a scan for stocks making new 52-week highs within the last three months. From this scan, about 20 names were selected.
There were multiple continuation setups, for example BG, BTU, ADI, M, SOLV, PFG, NTRS, RF, and others. Some names remain indecisive so far, such as CPRI and CSIQ.
The approach is to enter within the pullback rather than on late breakout entries, with the purpose of selling into momentum. This means entries should not be chased and stops are placed at a reasonable distance, since the time of expansion is not predictive.
In this post, I review one of several trades. This is not a best-case setup, but simply the most recently closed trade. In BG, there was a prior momentum move followed by a controlled, somewhat complex pullback, which I most of the time tend to avoid. In this case, however, entry was taken on expansion from a lower reference point. Entry was at 90.70, and the position was sold into third-day highs near 95, resulting in a 1R outcome.
Risk is standardized. Position size is fractal 2% of account, stop is placed at 2-3 ATR with a fixed 1R target. These values and brackets are automated via the risk module . Hopefully, I can review more clear setups in the near future.
Tradereview

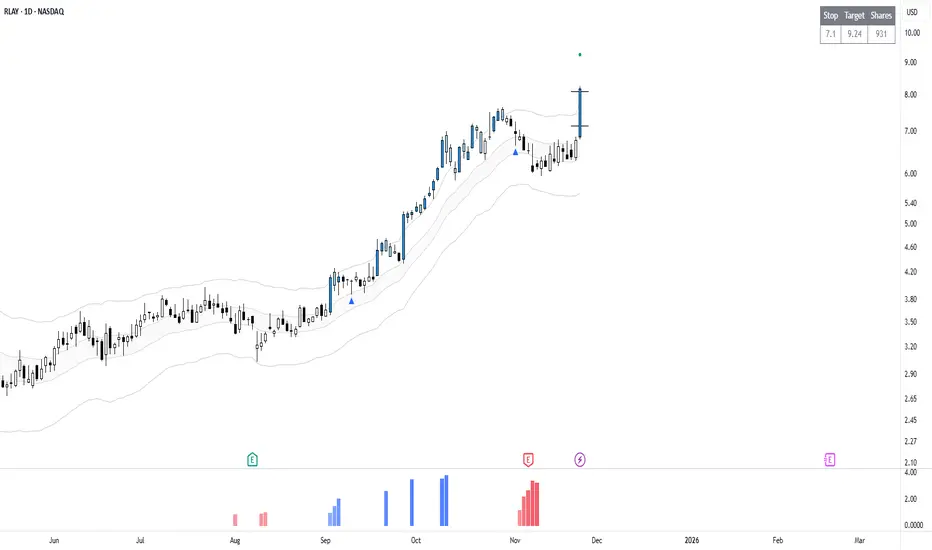
RLAY Trade ReviewThis approach is based on pullbacks. A pullback is a short-term counter-move in response to a strong impulse move. It is a controlled reversion towards the mean, which offers a structured approach to enter in case of momentum resumption. There is no precise execution point, rather approximation and patience.
A weekend watchlist is created using objective criteria and discretion. Alerts are placed and monitored during the week, with entries taken either on a valid pullback condition or in response to indication of continuation.
Watchlist: IMTX, NEE, FDMT, FE, EVRG, RLAY.
FE has been active since November 17 and has bracket orders. No interference.
RLAY Trade
Entry: 7.14
Stop: 2.25 ATR
Target: 1R
Risk: 1% of Account
The target was reached within the same session. Closed at 8.09 for a full 1R result.
If you want more trade reviews, weekend watchlists, or how to build a simple process, comment and let me know.
$YM | "Resistance" Zone, or low key breakout area? Let's analyzeToday, we discuss some nuance, so put on your analyst hats and let's dive in!

AUDUSD & AUDJPY (+4%) Trade Recap 07.11.25Two positions covered in this recap.
AUD / USD +1%
AUD / JPY +3%
Full explanation as to why I executed on this position, using the 4H to my advantage with AUDUSD and AUDJPY being a textbook 15M trade for myself.
Any questions you have just drop them below 👇

GBPUSD - GBPJPY - USDJPY Trade Recaps 28.07.25Three positions taken last week. Some vital findings within my self-review process which showed a stop loss error with GBJPY causing me to miss a solid 4% trade, and a manual close on GBPUSD to bank a little extra profit.
Full explanation as to why I executed on these positions and the management plan with both.
Any questions you have just drop them below 👇

11.07.25 USDJPY Trade Recap + Re-Entry for +2.5%A long position taken on USDJPY for a breakeven, followed by a premature re-entry that I took a loss on. I also explain the true re-entry I should have taken for a 2.5% win.
Full explanation as to why I executed on these positions and also more details around the third position that I did not take.
Any questions you have just drop them below 👇

EURAUD -0.7% Short and AUDUSD MistakeA short position taken on EURAUD for a small loss after manually closing before swaps. I have also included a breakdown of a +4% AUDUSD long I was looking at taking but a small error on my behalf that caused me to stay out of the trade. Full explanation as to why I executed on this position and made the decision to manually close at the level I did.
Any questions you have just drop them below 👇

BTCUSD - I WAS WRONGMARKET UPDATE
Price violated my trade thesis the previous week after having a hard time displacing to the downside to complete the Distribution Phase.
TRADE OUTCOME
I took a full 1% loss on this trade idea(my risk was managed).

Day Trade Review – TSLAThis video is a review of TSLA intraday price action based on a request. It examines how the stock could have been traded using a technical approach. The analysis covers the entire session from the open to the close, showing execution, trade management and decision-making without hindsight bias. It also includes additional insights on time and risk management trading intraday.
If you have any requests for future reviews, let me know.

How I Used COT to Profit in Crude Oil I show you my process from start to finish.
How to identify:
If a market is setup for a move of some significance.
How to confirm a setup using accumulation/distribution measurements & seasonals.
Finally, how to utilize technical methods to enter into a trade.

How I Used COT to Make $2,450 in Crude Oil This WeekI show you my process from start to finish, the same process I use every week to profit from the markets.
-Fundamental Setup
-Confirmation
-Technical Entry
-Exit/Stop

GBPNZD +4.5% Win Trade RecapA FX:GBPNZD short position I took in the last trading week, resulting in a +4.5% win.
Top down analysis explained in the video and also my reasons for the lower timeframe entry in combination with the manual close decision.

Trade Review - BYONWhen SAGE showed up in screener there was a bullish continuation pattern on the daily timeframe and a potential exhaustion on the higher timeframe.
The higher timeframe is in a downtrend, have made a measured move down (volatility projection) and is extended from the mean, thus we observe for potential reversion.
The lower timeframe provided a bullish continuation setup, which allows us to enter with a more structured approach. The target was a measured move up, as this is a projection of the current volatility.

-1% NZDJPY & +3.4% USDJPY Trade RecapsTwo short positions I took in the last trading week.
FX:NZDJPY | -1% Loss
FX:USDJPY | +3.4% Win
Top down analysis explained in the video and also my reasons for the weighted timeframe entry in combination with the management decision.

H5 Day Trade Review! Crushed $BE Trade x2🚀 H5 Day Trade Review
Check out how we absolutely nailed NYSE:BE day trades two days in a row! 👇

NZDCAD Trade RecapA short position I took the beginning of last week for a breakeven. Top down analysis explained in the video and also my reasons for the weighted timeframe entry in combination with the management decision.
FX:NZDCAD - Breakeven

Trade Review - SAGEWhen SAGE showed up in screener there was a bullish continuation pattern on the daily timeframe and a potential overextension on the higher timeframe downtrend.
The higher timeframe is in a downtrend, have made a measured move down (volatility projection) and is extended from the mean, thus we observe for potential reversion.
The lower timeframe provides a bullish continuation setup, which allows us to enter with a more structured approach. There was a failure test entry earlier, but since this was missed we look for a more clear range expansion as a confirmation. The target is a measured move up, as this is a projection of the current volatility.
In this chart you can observe the actual expansion / breakout, since there was a noticeable contraction 2 bars prior the move could be entered quicker. The stop is located 1-2 ATR from the entry point, which allows for a 1.5 to 2 R trade.

Trade Review - ALGS
When stock showed up in screener showed a bullish continuation pattern on daily timeframe and a potential failure test / pullback on the higher timeframe downtrend, a bit near mean but was added to watchlist.
Execution chart.
Trade Overview
• Structure: Bullish Continuation (D)
• Position: Near Mean (D)
• Entry Trigger: Breakout (D)
Entry Details
• Entry Price: 11.13
• Stop Price: 9.38
• Target Price: 12.96
• Expected Risk/Reward: 1.05R
Exit Strategy
• Exit Price: 14.47 / 1.91R

Trade Review - LUNR
When found in the screener, the stock showed a decent continuation pattern on the weekly chart. It was added to the watchlist to track a potential move, still were some distance to prior swing high.
Execution Chart.
Trade Overview
• Structure: Bullish Continuation
• Position: Near Mean
• Entry Trigger: Range Expansion
Entry Details
• Entry Price: 9.38
• Stop Price: 8.30
• Target Price: 12.36
• Expected Risk/Reward: 2.65 R
Exit Strategy
• Exit Price: Closed 50% into 1R and rest at 12.18.

Trade Review - WEST
When the stock showed up on the screener there was a bullish continuation setup on the daily chart and a potential overextension on the higher timeframe downtrend. Thus added to the watchlist to monitor for a move.
Execution – Entered late on a debatable Failure Test.
Trade Overview
• Structure: Bullish Continuation (D) / Downtrend Pullback (W)
• Position: Near Mean (D) / Far from Mean (W)
• Entry Trigger: Failed Breakdown (Late)
Entry Details
• Entry Price: 6.90
• Stop Price: 6.40
• Target Price: 8.46
• Expected Risk/Reward: 3.12 R
Exit Strategy
• Exit Price: Closed 75% of position into 1R and rest hit stop at breakeven.

Trade Review - NPWR
Found this stock on the screener showing a bullish continuation setup on the daily chart. On the higher timeframe downtrend, looked like the pullback had been played out. Despite it was added it to the watchlist to monitor.
Execution – Later Entry.
Trade Overview
• Structure: Bullish Continuation (D) / Bearish Pullback (W)
• Position: Near Mean (D) / Near Mean (W)
• Entry Trigger: Breakout / Range Expansion
Entry Details
• Entry Price: 9.92
• Stop Price: 8.91
• Target Price: 12.34
• Expected Risk/Reward: 2.36 R
Exit Strategy
• Exit Price: Closed 75% at 11.34 and 25% at 12.34.

Trade Review - DNA
When this stock was added to the watchlist, it displayed a bullish continuation setup on the daily timeframe. On the higher timeframe, there was also a potential for downside overextension, suggesting a possible pullback within the larger downtrend.
On the next chart, executions are shown. In anticipation of the trade, I look for a failed breakout against the trend—a failure test—where the price moves outside the lower boundary of an established consolidation. If it then closes back within the range, I sometimes enter before market close. For these trades, I often close a partial position as the price nears the upper part of the range, in case the range holds without a breakout.
Trade Overview
• Structure: Bullish Continuation (D) / Bearish Pullback (W)
• Position: Near Mean (D) / Extended from Mean (W)
• Entry Trigger: Failed Breakout (Opposite to Trend)
Entry Details
• Entry Price: 7.77
• Stop Price: 6.73
• Target Price (Range): 8.72
• Target Price (Measured Move): 11.62
Exit Strategy
• Exit Price: Closed 50% into 9.03 > Rest hit SL at 7.95.

Trade Review - KRUS
This stock was added to the watchlist based on a bullish continuation setup on the daily timeframe (noticeable upward move followed by a pullback or consolidation near the mean price).
The higher timeframe, we observed that the stock has been moving within a range, even shown a failed breakdown / failure test to the downside. Its now inside range, without interference.
Trade was entered as a breakout.
Trade Overview
• Structure: Bullish Continuation (D) / Range (W)
• Position: Near Mean (D) / Inside Range (W)
• Entry Trigger: Breakout
Entry Details
• Entry Price: 86.45
• Stop Price: 80.50
• Target Price: 103.10
• Expected Risk/Reward: 2.8 R
Exit Strategy
• Exit: Closed 50% at 1R, rest at or near target price.
