BTC Zoomed In - Flash Crash Short OpportunityFor those who have followed my bitcoin analysis you likely have conviction now that I wasn’t predicting this out or my butt.
Here is a more local opportunity to short a flash crash - incoming on Bitcoin
For this trade to be valid - we would not rise much higher than the second entry level of 73,280
Hence the short has two entries
Entry 1 - 69,400
Entry 2 (DCA) - 73,200
Stop Loss - 75,300
Targets:
1) 57,200
2) 47,500
3) 34,800 (Close 50% here)
4) 19,400
5) 7,300 (likely bottom one)
6) 4,000 (likely bottom two)
Personally I’ll close 100% at 10,000 and look to buy in between target 5 and 6
Don’t miss this opportunity - you’ll be disappointed if you weren’t prepared.
- DD
Tradesetup

SHW Simple Trade SetupThis is one of those simple chart setups that both long or short apply. All you have to do is wait. No guessing required.
A beautiful cup handle with a channel ready to go! One way or another.
The bias is to the upside bc it is still within the channel.
However, if this cracks! Lower boy, do you have yourself one hell of a CRACK! After 16 years in the channel.
In a world of Crypto Bros trying to pick bottoms every minute of the day, be smart and trade simple setups.
THANK YOU for getting me to 5,000 followers! 🙏🔥
Let’s keep climbing.
If you enjoy the work:
👉 Drop a solid comment
Let’s push it to 6,000 and keep building a community grounded in truth, not hype.

BTC - Ultimate Swing Short - Update and Next MovementsUpdate on this Bitcoin Ultimate Swing Short - already down 18% since entry.
Next movements to prepare for:
78,400 to 35,000
35,000 (likely retrace) to 50,000
50,000 to 7,400-8,000
I will say this again and again:
Bitcoins ultimate bottom is 7,300 to 8,000 range - that is the level you want to buy or long.
Happy trading,
- DD

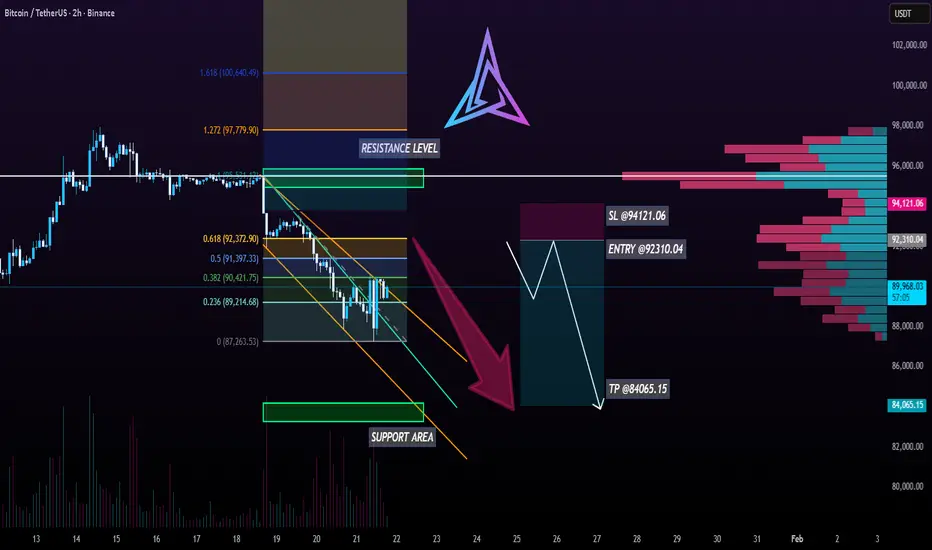
BTCUSDT 2H | Rejected at 0.382 Fib – Bearish ContinuationHello everyone,
BTC 2H chart shows clear rejection at 0.382 Fib retracement ($90,421) after brief rally attempt. Price now back below it (~$89,987 area), maintaining the descending channel structure with lower highs intact.
Key Technicals:
📌 Fibonacci Retracement (Swing High ~$95.5k → Low $87.3k):
0.236 broken, 0.382 rejected multiple times → strong overhead resistance.
📌 Next barriers: 0.5 ($91,397), 0.618 ($92,372).
📌 Descending Channel: Upper trendline capping rallies, lower highs pattern holding.
📌 VRVP: Heavy selling supply stacked $90k–$96k (dominant pink/red bars) → exhaustion on up moves.
Bearish Confluences:
✅ Multiple rejections at Fib + channel resistance despite momentum attempts.
✅ Low-volume zone = increased volatility risk on downside.
✅ Overhead supply from VRVP confirms selling pressure dominant.
SHORT Setup (High-Probability Wait):
Entry: ~$92,310 (confirmed rejection at 0.618 Fib $92,372) – look for long upper wicks, declining volume on approach.
SL: $94,121 (above key resistance) – Risk ~1.962%.
TP Range: $84,065 (1.272 to 1.618 Fib extension confluence + psychological support zone).
Why Wait for Confirmation?
Patience for rejection at resistance → tighter stop, higher probability. No clear signal = no trade.Invalidation: Clean close above $94,121 + volume breakout → bullish flip, reassess higher.
Monitoring next 24–48h for rally to $92k rejection or direct breakdown below $89k. Technical structure holds priority.
DISCLAIMER
Educational analysis documenting my trading process. Not financial advice. Crypto markets are volatile. Use proper risk management. Trade at your own risk!
PayPal Long Trading Fam,
Because I kept my stops fairly tight on my last entry into PYPL, I was stopped out. I was okay with that. However, since that time, I have received two more buy signals with my Pivot Zones indicator. I can't ignore these signals. I have re-entered at a price of $59.53 with a 1:4 rrr. Same target, but the stop is just below that last pivot low rn.
✌️Stew


ETH - Ultimate Swing Short ETH - in a similar structure as Bitcoin - has been consolidating below this breakdown of a major bearish structure - an ascending parallel channel visible on the entire chart.
Theory - this technical pattern will be utilized as a justification to reclaim all liquidity sitting down towards the uber lows. Although I call it a swing, it’s possible this moves quite quickly - same concept as my linked related Bitcoin post.
Entry - 3,300 to 3,310
Stop Loss - 3,500
Take Profits:
1) 2,920
2) 2,540
3) 2,250
4) 1,650
5) 1,230 (Close 75% of short here)
6) 610
7) 252 (Close 100% of short here)
Any questions - let me know below.
Happy trading,
Dick Dandy

BTC - Ultimate Swing ShortPer my previous analysis on Bitcoin - here are the details for my Ultimate Swing Short.
Theory - Bitcoin has fallen below two major ascending parallel channels, and will grab liquidity to the uber lows by playing out these technical bearish structures.
Although the trade is called a swing, it’s possible this moves quite quickly.
Entry - 95,000 to 95,400
Stop Loss - 99,400
Take Profits:
1) 84,200
2) 67,200
3) 43,200 (Close 50% or trade)
4) 35,100 (Close 75% of trade)
5) 20,000
6) 8,000 (Close 100% of trade)
Any questions - please comment below
Happy trading,
Dick Dandy

NVIDIA (NVDA) H4 | Bullish Continuation Setup After ATH ReversalNVIDIA (NVDA) NASDAQ H4 Timeframe Analysis NVIDIA recently showed a reaction from its All-Time High (ATH), where a clear reversal was observed. After forming the top, the price moved down and swept the sell-side liquidity, indicating that smart money has completed the downside inducement. Currently, the price is trading around a key bullish order block, which aligns with the sell-side liquidity grab. This confluence significantly strengthens the chances of a bullish momentum continuation.
Market Structure Insight
ATH formed _ short-term reversal observed
Sell-side liquidity has been taken
Price respected the bullish order block
Momentum is shifting back.
This suggests that the market is preparing for a bullish expansion phase.
Buy Trade Plan
Entry Level: 177.52
Stop Loss: 168.00
Targets:
TP1: 187.00
TP2: 199.00
Major Target: 211.00
Disclaimer
This chart is for educational purposes only and does not constitute financial advice. Trading involves high risk; always conduct your own research and use proper risk management.


BTC - Christmas Crash? BTC is again underneath these major bearish trendlines.
Is it possible we see a mega crash on Christmas Day?
We shall see. Chart is aligning in that direction.
Merry Christmas and be safe
- DD

NIFTY Moved EXACTLY As Analyzed | Live Entries, SL & Target Hit
Today’s video has been recorded live during market hours —> no hindsight, no edited stories.
I tracked the price action candle-by-candle, explained the structure as it was forming, and shared the exact trades I took.
You will see:
• My stop-loss getting hit (full transparency)
• My targets getting hit
• Why the analysis played out perfectly
• How to adjust your plan when the market shifts
• How I manage trades in real time
This is pure live price action + real psychology.
If you follow the whole breakdown, you’ll understand exactly why the market moved the way it did and how I planned the next setups.
Let me know if you want more live breakdowns like this.

BTC SHORT SETUP 📉 BTC UPDATE — Short Setup in Play
Bitcoin is showing rejection from a key resistance zone, and current structure suggests bearish continuation if price respects this level. Momentum is favoring sellers while liquidity rests below.
📌 Trade Levels :
🔓 Entry: 87348
❌ Stop Loss: 89820
🎯 Target: 86192
Patience is key — let price confirm and manage risk properly.
Trade the levels, not the emotions.

BTC - Short the BottomBitcoin has been following and setting up the flash crash pathway.
Short the bottom - we will drop a lot further.
85,400 to 34,700
35,000 to 57,000
57,000 to 8,000
8,000 - Buy
God speed and buckle up.

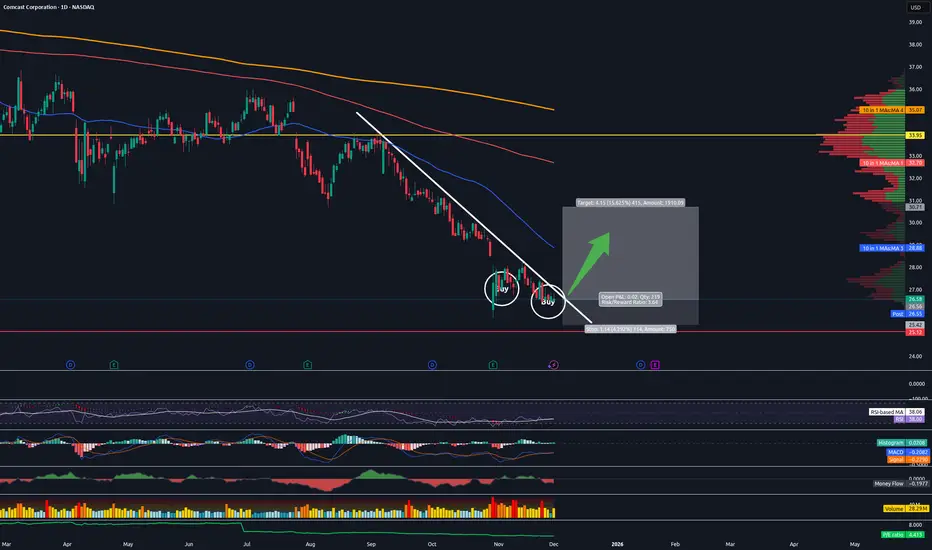
Long Comcast CMCSATrading Fam,
Not getting many long signals from my indicator these days. When I do, I pay attention. In this case, I've received two long signals on the same stock. Though, I am currently only short (and in the profit on both: TSLA and PLTR), I've decided to enter here long on Comcast. My indicator rarely fails me when it signals on these high MC/high vol. stocks. So, I will listen.
On the technical side, I am seeing a nice trendline, which, if my indicator is correct, we will break to the upside on soon. Should at least fill that recent gap down and hit the 50 SMA fairly quickly. It may be worth taking some profit at that point and raising stops to break even. I expect we'll hit our heads on that 50 SMA and draw back for a day or two at least while we wrestle around with it for a little. And then, should we break to the upside, we'll move quick. My final target may even be set too low at this point. I am trading cautiously. But we could tag the underside of that 200 SMA in red before buying subsides to some degree. I'll probably leave a little on the table for this scenario while trailing my stops up as I grab profit.
Conservative target is around $30 with a SL at around $25.50 for a 2:1 rrr. Setting a final target of that 200 SMA would increase your rrr to 5:1 with a potential profit of 23%.
✌️Stew
GBPJPY | Long IdeaLooking for GBPJPY to make a move up this week to continue it's brutal uptrend.
GBPJPY bounced from Monday low this morning and making a nice move up.
Retest could still be possible if you haven't entered yet.
Stay safe out there and do your own due diligence, this is not investment advise!

XAUUSD🔓 SHORT SETUP ACTIVATED | CLEAN RISK–REWARD TRADE
Market has reached a strong resistance zone and price action is showing signs of weak momentum. This setup is based on structure, rejection, and confluence, not emotions.
📌 Trade Plan
🔓 Entry Level: 4336
❌ Stop Loss: 4315
🎯 Target: 4350
📊 Why this trade?
✔ Resistance + rejection
✔ Momentum slowdown
✔ Favorable R:R
✔ Discipline over prediction
Remember: Trading is about probabilities, not certainty. Manage risk, follow your plan, and let the market do the rest.
👍 If this idea aligns with your analysis, hit like,
💬 share your view in comments,
🔔 and follow for more structured trade ideas.
⚠️Disclaimer: This is not financial advice; it reflects only my personal market analysis. Please do your own research before trading.

XAUUSD – Rejection From PDH | Price Respecting Demand ZoneGold swept Previous Day High (4258), grabbed buy-side liquidity, and sharply rejected.
Price has now returned to the demand zone around PD Low (4192–4201) where buyers previously stepped in.
Key Observations:
Daily Wick 50% acted as intraday resistance
Strong reaction from weekly liquidity zone above
Bullish recovery forming from demand
Break above 4234 may open path back toward PDH & Weekly High
Bias:
As long as price holds above PD Low, intraday bullish continuation is favored.
A breakdown below the yellow zone shifts bias toward deeper sell-side liquidity.
Levels to Watch:
Resistance: 4234 / 4258 / 4264
Support: 4201 / 4192
Price is rebuilding structure — waiting for confirmation before the next impulse.

BTC/USD – Band Rejection + Gap Squeeze Play (Textbook Execution)Caught a clean 30m bullish band rejection on BTC/USD, aligned with a textbook gap-up squeeze setup. Price gapped above the lower Bollinger Band after a clear downtrend, forming a strong engulfing candle. Entry triggered on break of the rejection candle high at 89,276.
Trade Highlights:
- Entry: 89,276 (2 lots)
- Target 1: Midline (9 EMA) hit at 89,372 (+0.11%)
- Target 2: Upper Band hit at 89,672 (+0.44%)
- Stop: 89,044 (below rejection low)
- Result: Full 1:1 RR achieved on both lots
Setup Confluence:
- Lower band rejection with hammer
- Gap-up ≥ 1% with strong close
- X/Y band stretch> 1.6 confirms squeeze
- No opposite rejection before midline
Takeaway: A+ setup with high-probability structure and mechanical execution. Kill fast, ride smart.

Quick AUDUSD Top Down AnalysisIn this video, I go over AUDUSD from the 4Hr and the 1Hr perspective.
There are clean setups happening, and we are in a ranging zone for the next breakout move.
Watch the video for a detailed breakdown!
Like and follow to get more analysis and updates like this.

GIFT NIFTY long at 26120GIFT NIFTY long setup at 26120
SL - 26108
TGT - 26311 / 26434 / 26487 / 26557

ETH - Short Update - Next Three MovesAs an update on my ETH Short plan, the following lists the sequence of the next expected movements.
1. SHORT
Entry - 2,895
Stop Loss - 3,000
Target - 1,300
2. LONG
Entry - Wick Bottom expected to be 1,229 - 1,250
Stop Loss - 1,150
Target - 1,750
3. SHORT
Entry - 1,800 to 1,830 (top of retrace)
Stop Loss - 2,000
Target - 250
Happy Trading.
DD

BTC - Next MoveFor those following my Bitcoin Crash prediction from the top, here is a smaller broken down trade that’s the first wave down in this crash.
Entry - 86,500
Stop Loss - 89,600
Take Profit - 36,000
Will report back when the next move is ready, which will likely be a long.
Happy trading.
-DD
