BTC Bitcoin Bear Market If you haven`t bought BTC before the recent rally:
Historically, Bitcoin has shown a tendency to retrace in December before starting a recovery around March. This pattern could repeat this season, with BTC facing selling pressure as year-end portfolio rebalancing and macro uncertainties weigh on the market.
While a brief Santa Claus rally might provide temporary relief, the bearish trend is expected to dominate until March. By then, BTC could trade below $84K before regaining momentum, aligning with its historical recovery trend as market conditions stabilize in spring.
Trading!

CHFJPY Sellers In Panic! BUY!
My dear followers,
This is my opinion on the CHFJPY next move:
The asset is approaching an important pivot point 194.37
Bias - Bullish
Safe Stop Loss - 194.13
Technical Indicators: Supper Trend generates a clear long signal while Pivot Point HL is currently determining the overall Bullish trend of the market.
Goal - 194.80
About Used Indicators:
For more efficient signals, super-trend is used in combination with other indicators like Pivot Points.
Disclosure: I am part of Trade Nation's Influencer program and receive a monthly fee for using their TradingView charts in my analysis.
———————————
WISH YOU ALL LUCK

Gold price analysis November 21📌 XAUUSD Trend Analysis – Technical Perspective
The intraday price action is leaning towards a bearish scenario as the 4041 support zone continues to be under pressure. If the H4 chart closes below this zone, a sell signal will be triggered and the next target will be at 3936.
The rising trendline is still playing an important role in the contested zone. However, the price has repeatedly failed to surpass 4100, indicating that buying power is weakening, while increasing the risk of the trendline being broken and the market returning to deeper support zones.
The trading strategy is basically unchanged from yesterday, but it is important to pay special attention to the reaction at the 4041 zone – the area that is deciding the next direction of gold.
📉 SELL
Trigger when: H4 candle closes below 4041
Strategy: SELL on breakout
Target: 3936
📈 BUY
Trigger when: Clear price rejection signal appears at trendline / support zone 4041
Expected target: 4200
Risk: Invalid if candle closes below 4041

EURUSD Massive Long! BUY!
My dear friends,
Please, find my technical outlook for EURUSD below:
The price is coiling around a solid key level - 1.1516
Bias - Bullish
Technical Indicators: Pivot Points High anticipates a potential price reversal.
Super trend shows a clear buy, giving a perfect indicators' convergence.
Goal - 1.1554
About Used Indicators:
The pivot point itself is simply the average of the high, low and closing prices from the previous trading day.
Disclosure: I am part of Trade Nation's Influencer program and receive a monthly fee for using their TradingView charts in my analysis.
———————————
WISH YOU ALL LUCK

Strong Support Holding - BTCUSD Buy OpportunityHello Followers, I am going to share you my opinion on BTCUSD next move.
BTCUSD is currently respecting the 89,000-90,000 support zone, indicating strong buying interest. A breakout and hold above support zone presents a high-probability buying opportunity towards the next move targets. As long as price remains above support, bullish continuation toward targets 93,600 and then 96,000 remains likely. If BTCUSD break the support zone then protect downside risk with a stop loss at 87,500.
KEYPOINTS:
Entry-level 90600
Target Area 93600
Target Area 96000
Stop loss point 87500
Support area 89000/90000

BTC/USDT – WEEKLY ANALYSIS (W1)🔵 BTC/USDT – WEEKLY ANALYSIS (W1)
Structure: Elliott Wave 5 (current wave = (4) correction)
This updated version of your chart adds Fibonacci extension targets for Wave (5), giving a much clearer projection.
1️⃣ Wave (4) Is Near Completion
Price has:
✔ Dropped sharply into the BIG Liquidity Zone (80k – 83k)
✔ Swept long-term trendline liquidity
✔ Tagged the 0.9 retrace marker (typical deep wave-4 behavior)
✔ Formed a weekly BOS during the drop
✔ Entered a historically strong demand zone
This fits perfectly with a complex corrective Wave (4).
2️⃣ Expectation: Reversal Soon
Wave (4) typically ends:
At big liquidity
At the trendline
Before violating Wave (1) territory
After a weekly BOS + wick
Your chart shows all these ingredients → a bottom is likely forming inside 80k–83k.
A bullish engulfing weekly candle here = wave (5) confirmation.
3️⃣ Wave (5) Target Zones (Fibonacci Extensions)
Your chart shows 4 major upside levels:
🎯 Target 1 — 100,757
First reaction level.
This is the 1.0 extension zone — often the first major resistance.
🎯 Target 2 — 109,998
Strong historical resistance + 1.272 extension.
Wave 5 usually passes this easily if momentum is strong.
🎯 Target 3 — 124,069
Major mid-range target.
This is where Wave 5 often pauses or makes a micro-correction.
🎯 Target 4 — 140,241 (−0.272 Fib)
This matches perfectly with standard Wave-5 overextensions.
Final upside zone before a large cycle top.
This is also the level shown at the top of your chart — very good placement.
4️⃣ Summary: BTC Weekly Outlook
✔ Wave (4) in progress but almost complete
✔ Liquidity grab is textbook
✔ Next move = impulsive Wave (5)
✔ Upside targets: 100.7k → 110k → 124k → 140k
✔ Macro trend remains strongly bullish
BTC is following nearly perfect Elliott Wave symmetry from your W1 structure.

Bitcoin is in a clean daily downtrend right nowBitcoin is in a clean daily downtrend right now – every bounce is just providing fuel for the next leg until the structure says otherwise.
Good evening traders, Brian here with a higher-timeframe look at BTCUSD.
Fundamental analysis
Bitcoin has been under sustained pressure even as some funds continue to accumulate spot positions. A few key points:
Macro uncertainty and tighter dollar liquidity are weighing on high-beta assets. While gold has held up relatively well, the performance gap between BTC and XAU has been widening in recent weeks, highlighting a clear risk-off tone towards crypto.
On-chain and fund flows suggest that a number of crypto investors are actually de-risking and pulling capital out, which reduces market depth and makes downside moves more violent when liquidity is thin.
Narrative is still mixed: long-term holders and some institutions are happy to buy lower, but in the short term the order flow is dominated by forced selling, deleveraging and risk reduction.
Bottom line: the macro backdrop does not yet justify an aggressive “buy the dip” approach on BTC. Trend-following shorts remain safer than trying to call the bottom.
Technical analysis
Daily structure is clearly bearish:
We have a confirmed market structure shift on the left of the chart, with the prior higher-low support broken and a series of decisive lower lows since then.
The main bullish trendline from earlier in the year has given way, and price is now travelling within a steep descending leg.
BTC recently tagged the 1.618 Fibonacci extension of the last major swing, aligning with a prior liquidity pocket. That produced a sharp intraday bounce, but so far it looks like a reaction inside a downtrend, not a full reversal.
Around 75.4k we have an important daily support zone. If this level is broken and accepted below, it opens the door to a deeper flush towards the next large support band lower on the chart.
Overhead, there is a clean imbalance/FVG and prior distribution area around 108k, with an intermediate resistance block around 96–97k and a nearer supply zone around 88k. These are prime locations to look for fresh shorts if price retraces.
For now my bias is simple: look to sell rallies into premium levels; any longs are tactical, short-term trades off key support only.
Key levels
Resistance / short zones:
88,000 – first reaction zone, “pay attention to the reaction”
96,500–97,200 – main short entry area for medium-term positions
108,000 – higher FVG / major daily supply
Support / long-only intraday zones:
75,400 – key support + 1.618 Fib/liquidity zone
74,000–72,000 – deeper support if 75.4k fails
Trade scenarios (for reference, not financial advice)
1. Short the first meaningful pullback – 88k area
Entry: 88,000
Stop: 90,000 (above local structure)
Targets: 82,000 → 78,000 → 75,500
Idea: treat 88k as the first supply zone in a downtrend. If price bounces from current levels and stalls here, I’m looking for rejection (wick rejections, failed break, or a clear shift in intraday structure) to join the trend. Once price moves in favour, I would look to pull the stop to breakeven and let the position run.
2. Core swing short – 96.5k–97.2k zone
Entry: 96,500–97,200
Stop: 99,000
Targets: 88,000 → 82,000 → 75,500
This is my preferred “medium-term” sell area. It aligns with a more significant daily supply block and offers better risk–reward if the larger bearish leg continues. Any squeeze into this region after a series of lower lows is, in my view, a controlled opportunity to reload shorts.
3. Tactical long only at deep support
Entry: 75,400–74,800
Stop: 73,800
Targets: 82,000 → 88,000
Here I would only consider a short-term long if we see a clean liquidity sweep into the 1.618 extension and strong rejection (long lower wicks, aggressive buy-back). The idea is simply to trade the bounce back into resistance, not to fight the higher-timeframe downtrend.
If BTC loses 75.4k and starts closing below it on the daily, I would become much more cautious on any long exposure and focus almost entirely on short setups towards the lower “important support” zone on the chart.
Trade with the trend, respect your risk, and don’t get trapped trying to be a hero at the bottom of a falling market.
If this BTC breakdown adds value to your plan, make sure you follow Brian for more daily BTC and gold analysis, and share your own view in the comments so we can compare scenarios.

Ethereum - new short after range or pullbackEthereum - new short after range or pullback
Price is inside of a down trned
new short better to take after bigger pullback

EUR/GBP BEARS WILL DOMINATE THE MARKET|SHORT
EUR/GBP SIGNAL
Trade Direction: short
Entry Level: 0.8820
Target Level: 0.8811
Stop Loss: 0.8826
RISK PROFILE
Risk level: medium
Suggested risk: 1%
Timeframe: 1h
Disclosure: I am part of Trade Nation's Influencer program and receive a monthly fee for using their TradingView charts in my analysis.
✅LIKE AND COMMENT MY IDEAS✅

USD/CAD SENDS CLEAR BEARISH SIGNALS|SHORT
Hello, Friends!
Previous week’s green candle means that for us the USD/CAD pair is in the uptrend. And the current movement leg was also up but the resistance line will be hit soon and upper BB band proximity will signal an overbought condition so we will go for a counter-trend short trade with the target being at 1.403.
Disclosure: I am part of Trade Nation's Influencer program and receive a monthly fee for using their TradingView charts in my analysis.
✅LIKE AND COMMENT MY IDEAS✅

Spot + Hedge — The Fundamental Framework for Investors Who TradeYou don’t have to treat holding and trading as two separate worlds. The most effective market participants combine both. They anchor their strategy in long-term conviction while using short-term tools to manage volatility and protect capital. This balance allows them to participate in structural growth without exposing their portfolio to unnecessary drawdowns.
Spot holdings are the foundation. A well-built spot position compounds through cycles, absorbs volatility, and benefits from every wave of adoption that pushes the market forward. Staking adds an additional layer by generating yield during periods of consolidation. For traders who think in cycles rather than days, spot is the engine that keeps building value in the background.
A hedge position serves a different purpose. It is not designed for aggressive speculation. It is a tactical layer that reduces exposure when conditions become unstable. Futures shorts, when sized properly, act as a defensive tool that preserves the value of your long-term assets without forcing you to sell them. This approach keeps you invested while giving you room to breathe during sharp corrections.
When hedging makes sense:
– After a strong rally pushing into major resistance levels.
– When funding rates are extremely positive and the market is crowded with leveraged longs.
– When macro data shifts, liquidity tightens, or a regulatory event increases uncertainty.
– When your portfolio has grown significantly and you want to lock in part of that increase without taking profits.
The purpose of the hedge is stability. You are not aiming to turn the short into a profit engine. You are using it as portfolio insurance. A well-timed hedge limits the damage during pullbacks and keeps you positioned for the next leg of the cycle.
Simple implementation example: assume you hold $20,000 of ETH spot as your long-term allocation. To hedge, you short 25–30 percent of the position using ETH perpetual contracts. If ETH drops 10 percent, the hedge cushions the downside by generating gains on the short. If ETH continues rising, your spot position captures the upside and the hedge becomes the cost of protection, similar to an insurance premium.
This framework helps traders stay in the market, avoid emotional exits, and preserve capital during volatile periods. It combines conviction with discipline and gives long-term holders a practical way to navigate uncertainty without breaking their overall strategy.

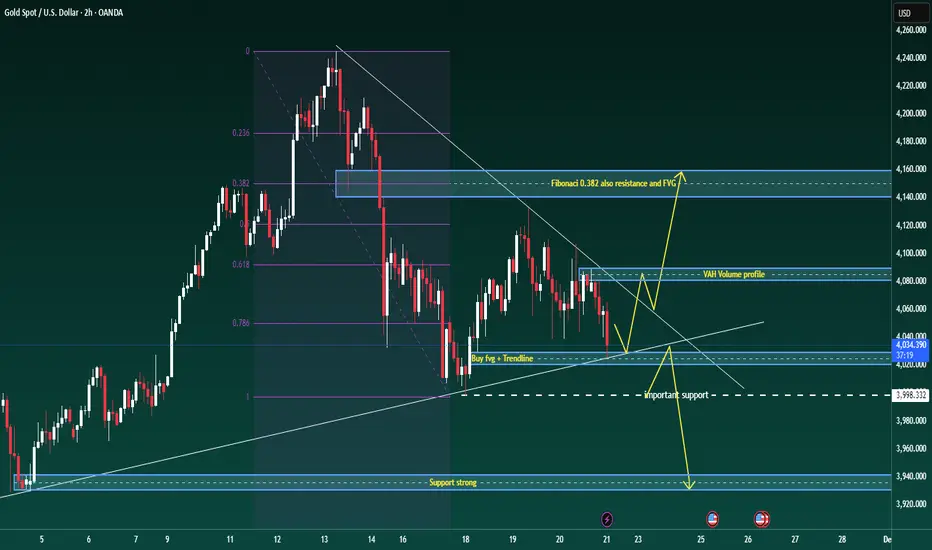
Gold is stuck in a wide range, ready for a decisive break.Good evening traders, Brian here with a fresh look at gold on the 2-hour chart.
Price is compressing in a broad sideways range, building energy for the next leg – the break from this structure will set the tone for the coming sessions.
Fundamental analysis
The core driver remains the Fed’s December decision. The market is effectively split on whether we see a cut or a delay:
A camp of institutions argues that rising unemployment and softer data could still justify a 25-basis-point cut in December, keeping pressure on the dollar and supporting gold on dips.
Others point out that the Fed is short of clean, up-to-date data and may prefer to wait until next year before committing to an easing cycle.
As a result, pricing for a December cut is roughly “fifty–fifty” and highly sensitive to the next run of labour-market and activity data.
In short: the macro backdrop is undecided, so intraday direction will be driven mainly by levels and liquidity until the next data catalyst hits.
Technical analysis
On the H2 chart, gold is in a broad consolidation after the recent sell-off:
Price is trading inside a descending structure, repeatedly respecting the short-term trendline from the recent high.
The Fibonacci retracement of the latest impulse shows the 0.382 level lining up with a prior fair-value gap and horizontal resistance – this forms a key rejection zone overhead.
Below price, there is a confluence of support where the rising trendline meets a small bullish FVG around 4027–4029, followed by a more important horizontal support band near 3998.
The volume profile highlights a Value Area High (VAH) around 4075–4080, which is likely to act as a reaction zone if price rotates back into it.
Until we break convincingly out of this structure, I treat it as a large accumulation range with a slight downside bias: sellers are still defending lower highs, but buyers are stepping in aggressively at trendline support.
Key levels
Resistance zones:
4080–4085 (VAH / short-term supply)
4135–4145 (Fibonacci 0.382 + FVG + structural resistance)
Support zones:
4027–4029 (trendline + FVG confluence buy area)
3995–4000 (important horizontal support)
3940 region (deeper support if the range finally breaks down)
Trade scenarios
1. Primary long – buy the trendline/FVG confluence
Entry: 4027–4029
Stop: 4023
Targets: 4035 – 4050 – 4068 – 4080
Idea: look for price to react at the rising trendline where it overlaps with the small FVG. A clean rejection candle or shift in intraday order flow from that zone sets up a rotation back towards the VAH and potentially the upper boundary of the range.
2. Break-and-retest short – if the trendline fails
Trigger: clear H1/H2 close below the rising trendline and the 4027 area
Plan: wait for price to retest the underside of the broken trendline / prior support
Entry: on rejection of that retest
Initial targets: 4000, then 3940 if momentum accelerates
This scenario treats any breakdown as a structural shift, using the retest as a lower-risk point to join the move rather than chasing the first leg.
3. Intraday scalp zones
These are discretionary, short-term opportunities for active traders:
Reaction sells: around 4085, and higher up if we spike into the 4135–4145 resistance band. Look for exhaustion or rejection patterns back into the range (potential targets 4060 then 4033).
Reaction buys: into 3998–4000 if we see a liquidity sweep below the current range, with tight stops and quick profit-taking back towards the mid-range.
GOLD Will Go Lower From Resistance! Sell!
Please, check our technical outlook for GOLD.
Time Frame: 1h
Current Trend: Bearish
Sentiment: Overbought (based on 7-period RSI)
Forecast: Bearish
The market is trading around a solid horizontal structure 4,030.36.
The above observations make me that the market will inevitably achieve 4,000.32 level.
P.S
The term oversold refers to a condition where an asset has traded lower in price and has the potential for a price bounce.
Overbought refers to market scenarios where the instrument is traded considerably higher than its fair value. Overvaluation is caused by market sentiments when there is positive news.
Like and subscribe and comment my ideas if you enjoy them!

USDCHF Will Go Lower! Short!
Here is our detailed technical review for USDCHF.
Time Frame: 9h
Current Trend: Bearish
Sentiment: Overbought (based on 7-period RSI)
Forecast: Bearish
The market is testing a major horizontal structure 0.804.
Taking into consideration the structure & trend analysis, I believe that the market will reach 0.798 level soon.
P.S
We determine oversold/overbought condition with RSI indicator.
When it drops below 30 - the market is considered to be oversold.
When it bounces above 70 - the market is considered to be overbought.
Like and subscribe and comment my ideas if you enjoy them!

USDCAD Will Go Down! Sell!
Take a look at our analysis for USDCAD.
Time Frame: 1D
Current Trend: Bearish
Sentiment: Overbought (based on 7-period RSI)
Forecast: Bearish
The market is approaching a key horizontal level 1.409.
Considering the today's price action, probabilities will be high to see a movement to 1.395.
P.S
Overbought describes a period of time where there has been a significant and consistent upward move in price over a period of time without much pullback.
Like and subscribe and comment my ideas if you enjoy them!

GBPJPY Will Move Higher! Buy!
Please, check our technical outlook for GBPJPY.
Time Frame: 9h
Current Trend: Bullish
Sentiment: Oversold (based on 7-period RSI)
Forecast: Bullish
The market is approaching a significant support area 205.634.
The underlined horizontal cluster clearly indicates a highly probable bullish movement with target 208.475 level.
P.S
Please, note that an oversold/overbought condition can last for a long time, and therefore being oversold/overbought doesn't mean a price rally will come soon, or at all.
Like and subscribe and comment my ideas if you enjoy them!
