US100 Free Signal! Sell!
Hello,Traders!
US100 is reacting inside the horizontal supply, where bearish orderflow continues to cap every rally attempt. With liquidity sitting below the prior swing lows, price is positioned for a corrective push lower.
--------------------
Stop Loss: 25,210
Take Profit: 24,901
Entry Level: 25,048
Time Frame: 2H
--------------------
Sell!
Comment and subscribe to help us grow!
Check out other forecasts below too!
Disclosure: I am part of Trade Nation's Influencer program and receive a monthly fee for using their TradingView charts in my analysis.
Trading

GOLD Local Short! Sell!
GOLD is sliding away from the horizontal supply zone, with bearish displacement hinting at continuation toward the next liquidity pocket below. Any minor pullback may simply serve as distribution before the markdown resumes. Time Frame 1H.
Sell!
Comment and subscribe to help us grow!
Check out other forecasts below too!
Disclosure: I am part of Trade Nation's Influencer program and receive a monthly fee for using their TradingView charts in my analysis.

NZDCAD WILL KEEP GROWIING|LONG|
✅NZDCAD rebounded from a strong demand level, signaling possible continuation toward the liquidity pocket above 0.7980. A retracement into fair value gap could offer optimal entry. Time Frame 3H.
LONG🚀
✅Like and subscribe to never miss a new idea!✅

EUR-GBP Will Keep Growing! Buy!
Hello,Traders!
EURGBP is retesting a horizontal demand area, aligning with premium–discount dynamics. If the level holds, bullish delivery could target liquidity resting above 0.8850. Time Frame 4H.
Buy!
Comment and subscribe to help us grow!
Check out other forecasts below too!
Disclosure: I am part of Trade Nation's Influencer program and receive a monthly fee for using their TradingView charts in my analysis.

ALGO Pullback Opportunity – Ready for the Next Leg Higher?After a strong 28% move up from our last call, Algorand (ALGO) has pulled back into a key support zone, potentially setting up for another bullish wave. This type of retracement after a breakout is typical in trending markets and often offers high-probability re-entry points.
📌 Trade Setup:
Entry Zone: $0.15 – $0.16
Take Profit Targets:
→ Tier 1: $0.22 – $0.26
→ Tier 2: $0.28 – $0.33
Stop Loss: Just below $0.13
This setup offers a favorable risk-to-reward ratio, targeting a continuation of the prior move while protecting against deeper downside. Volume confirmation and market conditions should be monitored closely for added conviction.

GOLD On The Rise! BUY!
My dear friends,
Please, find my technical outlook for GOLD below:
The instrument tests an important psychological level 4125.1
Bias - Bullish
Technical Indicators: Supper Trend gives a precise Bullish signal, while Pivot Point HL predicts price changes and potential reversals in the market.
Target - 4139.79
Recommended Stop Loss - 4117.21
About Used Indicators:
Super-trend indicator is more useful in trending markets where there are clear uptrends and downtrends in price.
Disclosure: I am part of Trade Nation's Influencer program and receive a monthly fee for using their TradingView charts in my analysis.
———————————
WISH YOU ALL LUCK

EURUSD Set To Fall! SELL!
My dear subscribers,
EURUSD looks like it will make a good move, and here are the details:
The market is trading on 1.1629 pivot level.
Bias - Bearish
My Stop Loss - 1.1642
Technical Indicators: Both Super Trend & Pivot HL indicate a highly probable Bearish continuation.
Target - 1.1607
About Used Indicators:
The average true range (ATR) plays an important role in 'Supertrend' as the indicator uses ATR to calculate its value. The ATR indicator signals the degree of price volatility.
Disclosure: I am part of Trade Nation's Influencer program and receive a monthly fee for using their TradingView charts in my analysis.
———————————
WISH YOU ALL LUCK

EURJPY Sellers In Panic! BUY!
My dear subscribers,
This is my opinion on the EURJPY next move:
The instrument tests an important psychological level 179.30
Bias - Bullish
Technical Indicators: Supper Trend gives a precise Bullish signal, while Pivot Point HL predicts price changes and potential reversals in the market.
Target - 179.52
My Stop Loss - 179.18
About Used Indicators:
On the subsequent day, trading above the pivot point is thought to indicate ongoing bullish sentiment, while trading below the pivot point indicates bearish sentiment.
Disclosure: I am part of Trade Nation's Influencer program and receive a monthly fee for using their TradingView charts in my analysis.
———————————
WISH YOU ALL LUCK

BITCOIN Will Go Higher From Support! Long!
Here is our detailed technical review for BITCOIN.
Time Frame: 2h
Current Trend: Bullish
Sentiment: Oversold (based on 7-period RSI)
Forecast: Bullish
The market is testing a major horizontal structure 96,949.13.
Taking into consideration the structure & trend analysis, I believe that the market will reach 100,800.47 level soon.
P.S
We determine oversold/overbought condition with RSI indicator.
When it drops below 30 - the market is considered to be oversold.
When it bounces above 70 - the market is considered to be overbought.
Like and subscribe and comment my ideas if you enjoy them!

EURUSD Will Go Up From Support! Buy!
Take a look at our analysis for EURUSD.
Time Frame: 9h
Current Trend: Bullish
Sentiment: Oversold (based on 7-period RSI)
Forecast: Bullish
The market is approaching a key horizontal level 1.161.
Considering the today's price action, probabilities will be high to see a movement to 1.168.
P.S
Overbought describes a period of time where there has been a significant and consistent upward move in price over a period of time without much pullback.
Like and subscribe and comment my ideas if you enjoy them!

EURAUD Will Go Lower! Short!
Please, check our technical outlook for EURAUD.
Time Frame: 2h
Current Trend: Bearish
Sentiment: Overbought (based on 7-period RSI)
Forecast: Bearish
The market is approaching a significant resistance area 1.781.
Due to the fact that we see a positive bearish reaction from the underlined area, I strongly believe that sellers will manage to push the price all the way down to 1.773 level.
P.S
Please, note that an oversold/overbought condition can last for a long time, and therefore being oversold/overbought doesn't mean a price rally will come soon, or at all.
Like and subscribe and comment my ideas if you enjoy them!

AUDNZD Will Go Up! Long!
Here is our detailed technical review for AUDNZD.
Time Frame: 1h
Current Trend: Bullish
Sentiment: Oversold (based on 7-period RSI)
Forecast: Bullish
The market is on a crucial zone of demand 1.149.
The oversold market condition in a combination with key structure gives us a relatively strong bullish signal with goal 1.154 level.
P.S
The term oversold refers to a condition where an asset has traded lower in price and has the potential for a price bounce.
Overbought refers to market scenarios where the instrument is traded considerably higher than its fair value. Overvaluation is caused by market sentiments when there is positive news.
Like and subscribe and comment my ideas if you enjoy them!

GOLD Will Move Lower! Sell!
Take a look at our analysis for GOLD.
Time Frame: 1h
Current Trend: Bearish
Sentiment: Overbought (based on 7-period RSI)
Forecast: Bearish
The price is testing a key resistance 4,235.87.
Taking into consideration the current market trend & overbought RSI, chances will be high to see a bearish movement to the downside at least to 4,172.53 level.
P.S
We determine oversold/overbought condition with RSI indicator.
When it drops below 30 - the market is considered to be oversold.
When it bounces above 70 - the market is considered to be overbought.
Like and subscribe and comment my ideas if you enjoy them!

GBP/NZD BULLS ARE GAINING STRENGTH|LONG
GBP/NZD SIGNAL
Trade Direction: long
Entry Level: 2.317
Target Level: 2.336
Stop Loss: 2.304
RISK PROFILE
Risk level: medium
Suggested risk: 1%
Timeframe: 4h
Disclosure: I am part of Trade Nation's Influencer program and receive a monthly fee for using their TradingView charts in my analysis.
✅LIKE AND COMMENT MY IDEAS✅

GBP/AUD SELLERS WILL DOMINATE THE MARKET|SHORT
Hello, Friends!
It makes sense for us to go short on GBP/AUD right now from the resistance line above with the target of 2.006 because of the confluence of the two strong factors which are the general downtrend on the previous 1W candle and the overbought situation on the lower TF determined by it’s proximity to the upper BB band.
Disclosure: I am part of Trade Nation's Influencer program and receive a monthly fee for using their TradingView charts in my analysis.
✅LIKE AND COMMENT MY IDEAS✅

GOLD Massive Long! BUY!
My dear friends,
Please, find my technical outlook for GOLD below:
The price is coiling around a solid key level - 4172.5
Bias - Bullish
Technical Indicators: Pivot Points Low anticipates a potential price reversal.
Super trend shows a clear buy, giving a perfect indicators' convergence.
Goal - 4195.5
Safe Stop Loss - 4159.1
About Used Indicators:
The pivot point itself is simply the average of the high, low and closing prices from the previous trading day.
Disclosure: I am part of Trade Nation's Influencer program and receive a monthly fee for using their TradingView charts in my analysis.
———————————
WISH YOU ALL LUCK

#AN029: USA, Shutdown Ended, Trump Signs the Deal.
After 43 days of total federal government shutdown, the longest shutdown in US history, the government is officially back in business. Hello, I'm Forex Trader Andrea Russo, an independent trader and prop trader, as well as the author of "The Institutional Code of Forex, 14 Steps to Read the Markets Like a Bank," with over $200,000 in capital under management. Thank you in advance for your time.
Donald Trump signed the funding bill approved by Congress, restoring temporary funding for federal agencies and guaranteeing back pay for federal employees.
But the market knows: this isn't a solution, it's a truce.
🔍 What was actually approved?
The package signed by Trump is a continuing resolution that funds the government only until the end of January.
No solution to the central issue—the Affordable Care Act subsidies—just the promise of a future vote.
In other words: the shutdown is over, but the uncertainty is not.
📉 Short-term economic impact
Initial estimates suggest a cost of between $10 and $15 billion in lost productivity, lower consumption, and frozen contracts.
In the short term, we will see:
- Technical rebound in consumption: wages, arrears, and federal contracts are resuming.
- Resumption of public services: TSA, USDA, CDC, and NIH are fully operational again.
- Distorted macro data: Many economic releases have been postponed and will now be released in a concentrated form, making it difficult to accurately assess real economic momentum.
The risk?
Another shutdown in a few weeks, if Congress doesn't find a real compromise.

XAUUSD H1 – Watching 4178 & 4158 for the next impulsive reversalAfter reacting cleanly from the 4232–4236 Supply OB, Gold confirmed a shift in intent with a sharp CHoCH → BMS sequence, showing that buyers were trapped in premium and Smart Money has rotated the market back toward discount zones.
The current structure suggests that price is seeking mitigation + liquidity below before any meaningful continuation.
Two key Buy Zones stand out on the chart:
💎 Key Technical Zones
OB BUY ZONE 4178–4174 (SL 4170)
→ First discount reaction zone and potential intraday long setup if M5 CHoCH confirms.
OB BUY ZONE 4158–4154 (SL 4148)
→ Deeper mitigation area aligned with the previous displacement leg and liquidity resting below.
OB SELL ZONE 4232–4236 (SL 4242)
→ Proven supply zone where yesterday’s reversal began.
As long as price holds above the new Lower Low (4156), the broader structure remains corrective rather than bearish — setting the stage for a possible continuation toward 4205 → 4230 after liquidity is collected.
🪶 Execution View
I’m waiting for price to dip into one of the Buy Zones, sweep liquidity, and show confirmation before looking for longs.
Chasing price in premium offers no edge — value lies in patience and reaction. 🌙
💭 Karina’s Note
Smart Money always rotates price from premium to discount before continuing.
Read the intent, not the impulse. 💛
This is my personal view based on SMC principles – not financial advice.
✨ Like & Follow for daily Plan updates ✨

ARB/USDT – The zone is interesting for starting accumulation.Arbitrum - is an Ethereum layer-two (L2) scaling solution. It uses optimistic rollups to achieve its goal of improving speed, scalability and cost-efficiency on Ethereum. Arbitrum benefits from the security and compatibility of Ethereum. Another benefit is the higher throughput and lower fees compared to Ethereum. That is made possible thanks to moving most of the computation and storage load off-chain.
Arbitrum’s native token is called ARB and is used for governance. Offchain Labs, the developers behind Arbitrum, announced the shift to a decentralized autonomous organization (DAO) structure — the Arbitrum DAO. ARB holders can vote on proposals that affect the features, protocol upgrades, funds allocation and election of a Security Council.
CoinMarketCap : #51
The hyped-up Arbitrum! 😂
📉 January - February - March 2024: Bloggers trapped a huge number of people, and now we’re seeing a massive -87% decline!
Looking at the main trend, a large descending channel is forming. The price is currently at the support of the inner channel, and if the market makes a final liquidity grab with a downward wick, the price could head toward the support of the outer channel, targeting a -30% drop.
In my previous trading idea, I marked the 1.1552 zone, which is exactly where the price reversed. Everything is marked on the chart—the potential profit is very solid, especially for spot trading. The price will react strongly to the resistance zones of both the inner and outer channels.
🚀 These are the moments to watch for position accumulation—when no one is interested and belief in growth is dead, not when everyone is screaming "BUY NOW!" at local tops!
*I will update the trading idea as the trend develops.

XAUUSD H1 – Liquidity shift ahead: patience before next moveAfter a sharp impulsive leg, Gold (XAUUSD) is now moving within a narrow intraday range — balancing between a fresh Buy Zone (4190–4185) and a potential Sell Zone (4242–4246).
This structure suggests that Smart Money may be engineering liquidity on both sides before committing to the next directional move.
The current BMS at 4180 confirms bullish intent, but the premium area near 4240+ aligns with FIB 1.5–1.618 extensions, making it a high-probability zone for a short-term reaction or liquidity grab before continuation.
Meanwhile, the Buy Zone (4190–4185) remains a clean mitigation area in confluence with prior displacement — a classic “re-entry pocket” if price retraces to rebalance inefficiency.
💎 Trading Outlook
SELL ZONE: 4242 – 4246 (SL 4250) → Watch for a liquidity sweep and reaction confirmation.
BUY ZONE: 4190 – 4185 (SL 4180) → Wait for CHoCH confirmation before long entries.
TARGET: 4240 → 4246 → 4210 (liquidity ladder setup).
At this stage, chasing impulsive candles offers little edge.
The better approach is to let liquidity build, wait for reaction, and trade confirmation — not emotion. 🌙
💭 Karina’s Note
Every imbalance tells a story — of where liquidity was taken and where it will be delivered next.
Your patience is the real entry. 💛
This is my personal view based on SMC principles – not financial advice.
✨ Like & Follow for daily London session updates ✨

NZDUSDNZDUSD price is approaching key support levels at 0.55931 and 0.55541. If the price fails to break above 0.55086, we expect a rebound, which may take some time to test the key support levels before entering a buy position.
🔥Trading futures, forex, CFDs and stocks carries a risk of loss.
Please consider carefully whether such trading is suitable for you.
>>GooD Luck 😊
❤️ Like and subscribe to never miss a new idea!

Gold price analysis November 13
Gold continues to maintain its bullish momentum after successfully breaking above the 4150 resistance zone. This breakout confirms the strength of the uptrend, with the recently broken area now acting as a solid support base. The next target that buyers are likely aiming for is around 4250, before testing the all-time high zone.
From a trading perspective, the focus remains on BUY setups—either on breakout entries or pullbacks to support. As long as price holds above 4150, the bias stays bullish and traders can consider holding positions to extend profits along the trend.
BUY setup: Watch for price reaction around 4150 support
💬 Feel free to share your thoughts and analysis below. I’d love to hear different perspectives from the community!

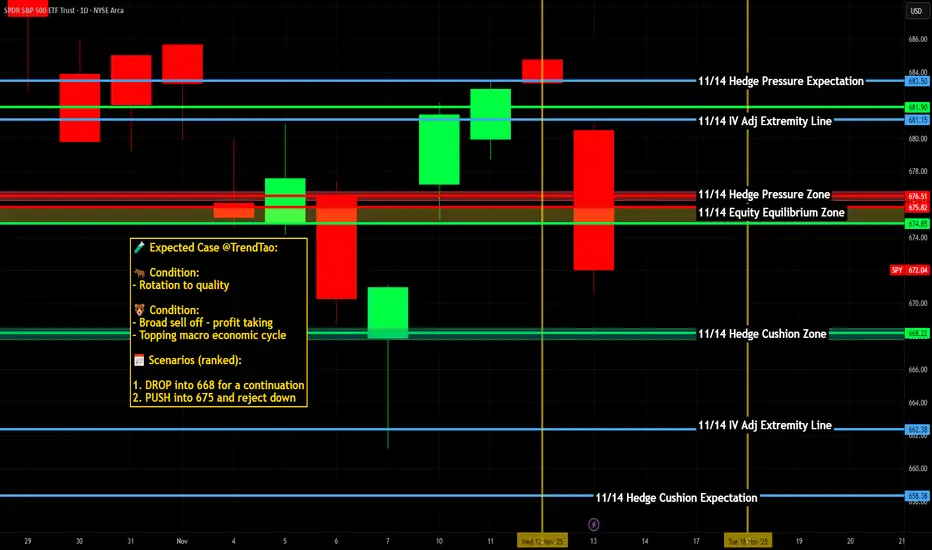
SPY & SPX Scenarios — Friday, Nov 14, 2025🔮 SPY & SPX Scenarios — Friday, Nov 14, 2025 🔮
🌍 Market-Moving Headlines
🚨 Shutdown disruption continues: The entire Retail Sales + PPI complex — normally one of the biggest monthly movers — is still at risk of nondelivery. Markets will trade on expectations, not prints.
📉 Volatility watch: With CPI, Claims, and Retail Sales all in backlog, positioning remains thin and reactive to yields + global risk sentiment.
💵 Bond market tone dominates: Without fresh inflation data, Treasury moves may guide SPX levels more than usual.
📊 Key Data & Events (ET)
All major data below is shutdown-risk flagged.
⏰ ⚠️ 8:30 AM — Retail Sales (Oct)
Forecast: -0.2%
Shutdown delay risk — high
⏰ ⚠️ 8:30 AM — Retail Sales ex-Auto (Oct)
Forecast: +0.2%
Shutdown delay risk — high
⏰ ⚠️ 8:30 AM — Producer Price Index (PPI, Oct)
Headline: +0.1%
Core: +0.3%
Shutdown delay risk — high
⏰ ⚠️ 10:00 AM — Business Inventories (Sept)
Forecast: +0.2%
Shutdown delay risk — medium
👉 All above data normally moves markets, especially Retail Sales + PPI.
Today, traders only get the reaction if the numbers publish.
⚠️ Disclaimer: Educational and informational only — not financial advice.
📌 #SPY #SPX #trading #inflation #PPI #RetailSales #macro #economy #Fed #markets #risk #shutdown