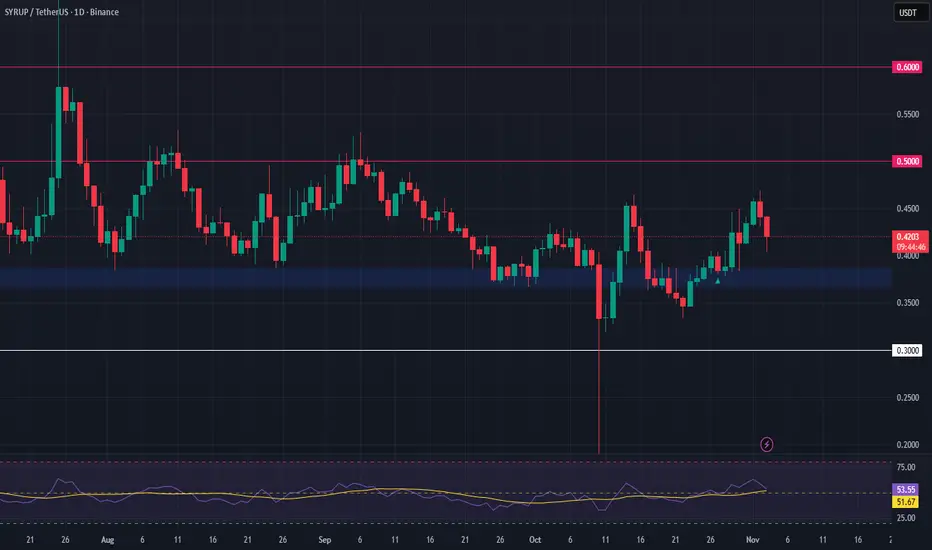
SYRUPUSDT – Watching for Pullback OpportunityAfter a strong 24% surge since our last analysis, SYRUP is starting to show signs of a potential retracement. This could be a healthy move, offering a chance to reset before a possible continuation higher on the higher time frames.
We’re now closely monitoring the $0.37 support zone, a level that aligns with previous consolidation and demand. If price pulls back and holds this zone, we may see a bullish reversal setup forming—a potential entry point for a spot long trade. Confirmation from candlestick structure or volume would strengthen the case.
📈 Trade Plan:
Entry Zone: $0.37
Take Profit Targets: $0.50, $0.60
Stop Loss: $0.30
Trading
USDJPY breaking out of long pennantThis could be quite a significant breakout for USDJPY. The monthly pennant with the peak that formed in June 2024 is finally breaking out to the upside. If this holds, the pair is likely to retest that all time high at 162.00 and possibly break higher.

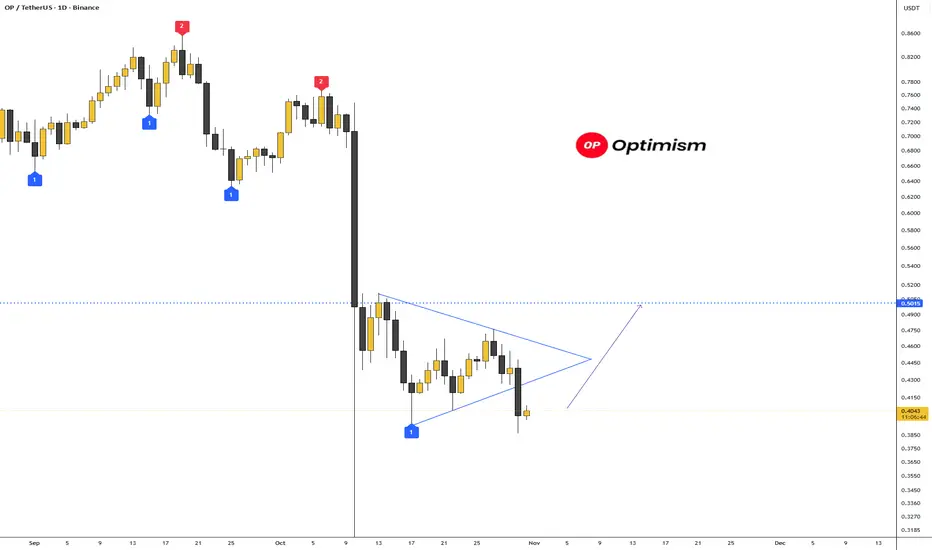
There's also an interesting entry point on OptimismThere's also an interesting entry point on NASDAQ:OP #Optimism.
The trade is almost 1 to 5.
Entry: $0.4059
Take Profit: $0.5015
Stop Loss: $0.3849
It looks a lot like a false breakdown downward and growth along with Bitcoin and Ethereum is quite possible.
Short traders' liquidity has already accumulated.
#Crypto #Trading #DayTrading
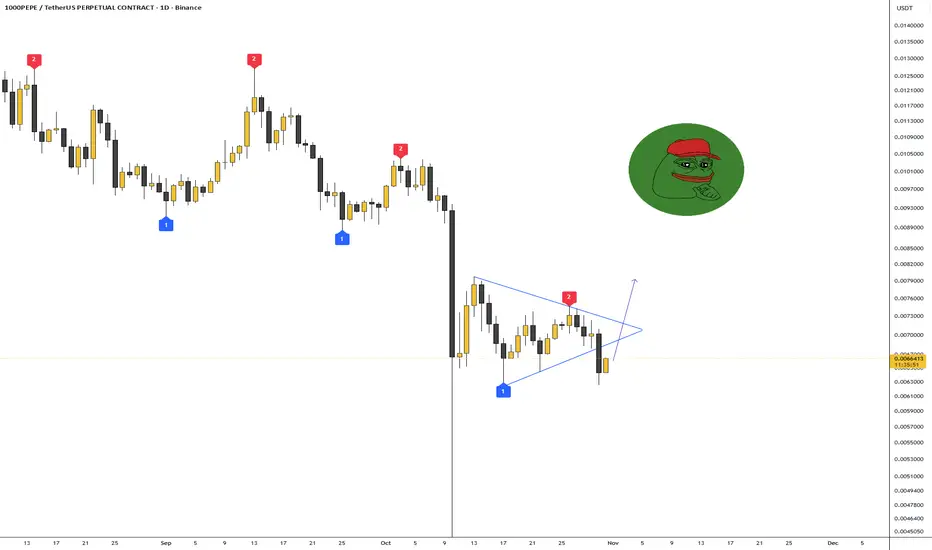
I'm seeing a pretty good long setup on PEPEI'm seeing a pretty good long setup on CRYPTOCAP:PEPE #PEPE 🤔.
The trade is 1 to 4.
Entry: $0.0066162
Take Profit: $0.0079400
Stop Loss: $0.0062400
Based on the liquidation map, the trade is justified. You can give it a try.
Gold price analysis November 3🟡 XAUUSD – Recovery Signal Forming
Gold prices are showing signs of returning to an uptrend after a short-term correction. The 4026 area is now acting as an important key level – a stable price above this area would be a confirmation signal that buying pressure is returning to the market.
With recent economic data still supporting the gold uptrend, the current priority strategy is to wait for BUYs following the trend. The sellers can only regain control if the price breaks through the support trendline around 3970, then the downtrend can be re-established.
📈 Sample trading plan:
Buy early around: 4000
Buy intensified when the price breaks above: 4026
Expected target: 4150
Risk: The uptrend is negated when the price closes below the 3970 trendline

USOIL Is Very Bullish! Buy!
Please, check our technical outlook for USOIL.
Time Frame: 6h
Current Trend: Bullish
Sentiment: Oversold (based on 7-period RSI)
Forecast: Bullish
The market is trading around a solid horizontal structure 60.808.
The above observations make me that the market will inevitably achieve 62.277 level.
P.S
Overbought describes a period of time where there has been a significant and consistent upward move in price over a period of time without much pullback.
Like and subscribe and comment my ideas if you enjoy them!

USDCHF Is Going Down! Short!
Here is our detailed technical review for USDCHF.
Time Frame: 1D
Current Trend: Bearish
Sentiment: Overbought (based on 7-period RSI)
Forecast: Bearish
The market is testing a major horizontal structure 0.807.
Taking into consideration the structure & trend analysis, I believe that the market will reach 0.797 level soon.
P.S
Please, note that an oversold/overbought condition can last for a long time, and therefore being oversold/overbought doesn't mean a price rally will come soon, or at all.
Like and subscribe and comment my ideas if you enjoy them!

GBPCAD Will Grow! Long!
Take a look at our analysis for GBPCAD.
Time Frame: 1D
Current Trend: Bullish
Sentiment: Oversold (based on 7-period RSI)
Forecast: Bullish
The market is approaching a key horizontal level 1.844.
Considering the today's price action, probabilities will be high to see a movement to 1.869.
P.S
The term oversold refers to a condition where an asset has traded lower in price and has the potential for a price bounce.
Overbought refers to market scenarios where the instrument is traded considerably higher than its fair value. Overvaluation is caused by market sentiments when there is positive news.
Like and subscribe and comment my ideas if you enjoy them!

GBPNZD Will Go Lower From Resistance! Sell!
Please, check our technical outlook for GBPNZD.
Time Frame: 1h
Current Trend: Bearish
Sentiment: Overbought (based on 7-period RSI)
Forecast: Bearish
The market is approaching a significant resistance area 2.296.
Due to the fact that we see a positive bearish reaction from the underlined area, I strongly believe that sellers will manage to push the price all the way down to 2.289 level.
P.S
We determine oversold/overbought condition with RSI indicator.
When it drops below 30 - the market is considered to be oversold.
When it bounces above 70 - the market is considered to be overbought.
Like and subscribe and comment my ideas if you enjoy them!

GOLD BEARS ARE GAINING STRENGTH|SHORT
GOLD SIGNAL
Trade Direction: short
Entry Level: 4,004.18
Target Level: 3,900.47
Stop Loss: 4,072.59
RISK PROFILE
Risk level: medium
Suggested risk: 1%
Timeframe: 4h
Disclosure: I am part of Trade Nation's Influencer program and receive a monthly fee for using their TradingView charts in my analysis.
✅LIKE AND COMMENT MY IDEAS✅

EUR/JPY SELLERS WILL DOMINATE THE MARKET|SHORT
EUR/JPY SIGNAL
Trade Direction: short
Entry Level: 177.527
Target Level: 175.590
Stop Loss: 178.808
RISK PROFILE
Risk level: medium
Suggested risk: 1%
Timeframe: 1D
Disclosure: I am part of Trade Nation's Influencer program and receive a monthly fee for using their TradingView charts in my analysis.
✅LIKE AND COMMENT MY IDEAS✅

USD/CAD BEST PLACE TO SELL FROM|SHORT
Hello, Friends!
Previous week’s green candle means that for us the USD/CAD pair is in the uptrend. And the current movement leg was also up but the resistance line will be hit soon and upper BB band proximity will signal an overbought condition so we will go for a counter-trend short trade with the target being at 1.388.
Disclosure: I am part of Trade Nation's Influencer program and receive a monthly fee for using their TradingView charts in my analysis.
✅LIKE AND COMMENT MY IDEAS✅

CAD/CHF BEARISH BIAS RIGHT NOW| SHORT
CAD/CHF SIGNAL
Trade Direction: short
Entry Level: 0.573
Target Level: 0.568
Stop Loss: 0.576
RISK PROFILE
Risk level: medium
Suggested risk: 1%
Timeframe: 12h
Disclosure: I am part of Trade Nation's Influencer program and receive a monthly fee for using their TradingView charts in my analysis.
✅LIKE AND COMMENT MY IDEAS✅

USD/CAD BEARS ARE GAINING STRENGTH|SHORT
Hello, Friends!
We are now examining the USD/CAD pair and we can see that the pair is going up locally while also being in a uptrend on the 1W TF. But there is also a powerful signal from the BB upper band being nearby, indicating that the pair is overbought so we can go short from the resistance line above and a target at 1.396 level.
Disclosure: I am part of Trade Nation's Influencer program and receive a monthly fee for using their TradingView charts in my analysis.
✅LIKE AND COMMENT MY IDEAS✅

AUD/NZD BULLS ARE GAINING STRENGTH|LONG
Hello, Friends!
AUD/NZD pair is in the downtrend because previous week’s candle is red, while the price is evidently falling on the 1H timeframe. And after the retest of the support line below I believe we will see a move up towards the target above at 1.136 because the pair oversold due to its proximity to the lower BB band and a bullish correction is likely.
Disclosure: I am part of Trade Nation's Influencer program and receive a monthly fee for using their TradingView charts in my analysis.
✅LIKE AND COMMENT MY IDEAS✅

EUR/GBP SENDS CLEAR BULLISH SIGNALS|LONG
Hello, Friends!
We are going long on the EUR/GBP with the target of 0.869 level, because the pair is oversold and will soon hit the support line below. We deduced the oversold condition from the price being near to the lower BB band. However, we should use low risk here because the 1W TF is red and gives us a counter-signal.
Disclosure: I am part of Trade Nation's Influencer program and receive a monthly fee for using their TradingView charts in my analysis.
✅LIKE AND COMMENT MY IDEAS✅

EUR/CAD BEARS ARE STRONG HERE|SHORT
Hello, Friends!
EUR/CAD pair is trading in a local uptrend which we know by looking at the previous 1W candle which is green. On the 6H timeframe the pair is going up too. The pair is overbought because the price is close to the upper band of the BB indicator. So we are looking to sell the pair with the upper BB line acting as resistance. The next target is 1.627 area.
Disclosure: I am part of Trade Nation's Influencer program and receive a monthly fee for using their TradingView charts in my analysis.
✅LIKE AND COMMENT MY IDEAS✅

GBPCHF Trading Opportunity! SELL!
My dear friends,
GBPCHF looks like it will make a good move, and here are the details:
The market is trading on 1.0605 pivot level.
Bias - Bearish
Technical Indicators: Supper Trend generates a clear short signal while Pivot Point HL is currently determining the overall Bearish trend of the market.
Goal - 1.0571
About Used Indicators:
Pivot points are a great way to identify areas of support and resistance, but they work best when combined with other kinds of technical analysis
Disclosure: I am part of Trade Nation's Influencer program and receive a monthly fee for using their TradingView charts in my analysis.
———————————
WISH YOU ALL LUCK

EURUSD Will Explode! BUY!
My dear friends,
Please, find my technical outlook for EURUSD below:
The instrument tests an important psychological level 1.1515
Bias - Bullish
Technical Indicators: Supper Trend gives a precise Bullish signal, while Pivot Point HL predicts price changes and potential reversals in the market.
Target - 1.1538
Recommended Stop Loss - 1.1503
About Used Indicators:
Super-trend indicator is more useful in trending markets where there are clear uptrends and downtrends in price.
Disclosure: I am part of Trade Nation's Influencer program and receive a monthly fee for using their TradingView charts in my analysis.
———————————
WISH YOU ALL LUCK

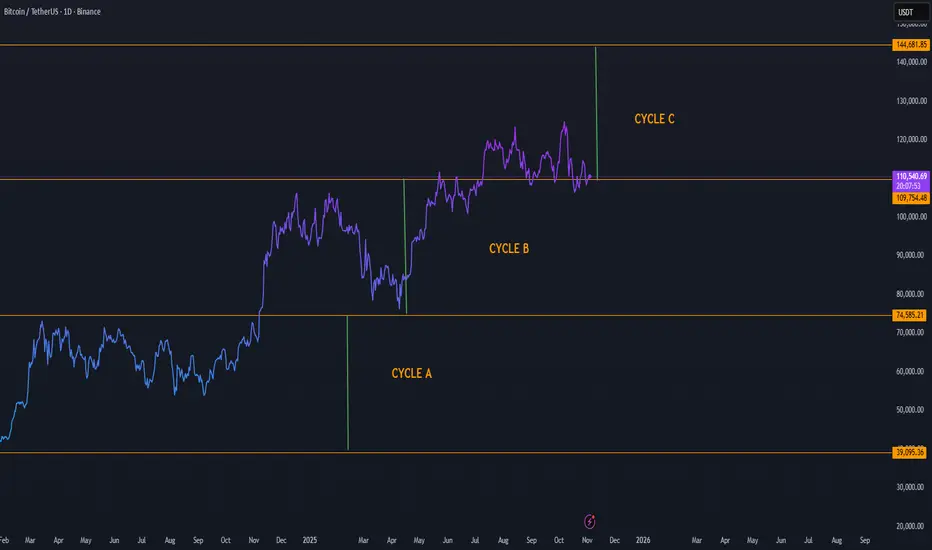
Bitcoin Cycle Analysis Entering Cycle C with Target Toward $144KBitcoin’s long-term market structure continues to evolve in well-defined phases, as visible through Cycle A, Cycle B, and the current Cycle C formation. Each previous cycle has followed a similar pattern: accumulation, expansion, correction, and new leg upward — and Cycle C appears to be following this same rhythm.
Here’s what the structure shows:
Cycle A: Represented the deep accumulation zone and base formation, bottoming near $39K–$75K.
Cycle B: Brought a strong recovery and expansion phase, establishing a stable mid-level support around $110K.
Cycle C (Current): Price is consolidating around the $110K area, likely preparing for the next expansion wave.
If Bitcoin maintains this cyclical rhythm, the next major target lies near $144K, aligning with the top boundary of Cycle C. This zone represents the next major resistance level and potential completion point of the current macro cycle.
Key observations:
Holding above $109K keeps Cycle C active and healthy.
Increasing volume during the next upward move could confirm a breakout continuation.
A successful push beyond $120K would strengthen momentum toward the $144K region.
LiamTrading - $XAUUSD$: Second Scenario – BUY Priority After...LiamTrading - OANDA:XAUUSD $: Second Scenario – BUY Priority After BREAKING $4002$
With Support from the U.S. Treasury Secretary
Hello traders community, LiamTrading is back with a detailed analysis of OANDA:XAUUSD $ for the start of the week!
The Gold market is receiving strong support from policy: U.S. Treasury Secretary Scott Bessent calls on the Fed to continue cutting interest rates as PCE inflation is currently at $2.7\%$.
This call, aimed at reducing mortgage rates and supporting the housing market, strengthens the long-term outlook for Gold.
Technical Analysis: We prioritize continuing to buy in line with the main trend. The best strategy is to enter at strong resistance/support zones to ensure the lowest risk.1.
📰 MACRO FUNDAMENTALS: CALL FOR RATE CUT
Impact: The Treasury Secretary's statement on cutting interest rates to support the "transitioning" economy increases expectations for policy easing, which is a strong support factor for Gold (though not yet an official decision).
Suitable Strategy: Market sentiment is being driven by expectations of policy easing, reinforcing the priority for a BUY (Long) position.
📊 TECHNICAL ANALYSIS: IMPORTANT PIVOT POINT
Resistance Zone $4002$: This area acts as an important pivot point.
Buy Entry will be activated after the price breaks $4002$ and retests.
Sell Entry: Look for short-term scalping at the resistance zone $4030$ to secure profits. Highlighted Zone: Prioritize entries at confirmed Trendline zones.
🎯 DETAILED TRADING PLAN (ACTION PLAN)
We will wait for Gold to break structure and create a BUY setup.
🟢 Main BUY Scenario (BUY Break & Retest)
Logic: Buy at $4002$ after breaking resistance and retesting, leveraging new upward momentum.
Entry (BUY): $4002$
SL: $3995$ (tight SL)
TP1/TP2: $4020$ | $4035$
TP3: $4070$
🔴 SCALPING SELL Scenario (SELL Scalping)
Logic: Short-term scalping at the strong resistance zone $4030$ (near Sell Liquidity zone).
Entry (SELL): $4030$
SL: $4038$
TP1/TP2: $4015$ | $4004$
TP3: $3990$4.
📌 SUMMARY & DISCIPLINE (Liam's Note)
Our BUY strategy is reinforced by policy outlook and technical breakout at $4002$. Strictly adhere to SL $3995$ to manage risk before the upward structure is confirmed.
Are you ready for Gold's movement at $4002$? Please LIKE and COMMENT!

Bitcoin Bullish Breakout Toward 112,000 TargetBitcoin (BTC/USD) is showing bullish momentum, trading above the trend line support. The price is targeting the 112,000 level, with potential resistance zones ahead. A sustained move above 110,000 could confirm further upside continuation.

LiamTrading - $XAUUSD$: NEW WEEK TRADING SCENARIO...LiamTrading - OANDA:XAUUSD $: NEW WEEK TRADING SCENARIO – PRIORITIZE SELLING After BREAKING THE TRENDLINE
Hello traders community,
The new week opens with a clear strategy: Prioritize SELLING after Gold has broken the previous upward trendline.
Although fundamental economic news (such as interest rate policies and politics) supports Gold potentially reaching $5,000$ USD, we must trade according to
current Price Action. Technical selling pressure is strong. We will SELL at key resistance areas and continue SELLING when the price breaks the downward structure.
📰 FUNDAMENTALS & LONG-TERM OUTLOOK
Prospect of $5,000$: Fundamental and political factors still support the scenario of Gold reaching $5,000$ USD in the long term (due to geopolitical risks and the potential loss of Fed's independence).
Short Term 🔴: Gold is under technical selling pressure after breaking through the $4,000$ USD mark.
📊 TECHNICAL ANALYSIS: BREAKING THE TRENDLINE
Structure: Gold has exited the upward price channel and is retesting the broken trendline.
Priority: SELL at the retest resistance area of $4024$.
🎯 DETAILED TRADING PLAN (ACTION PLAN)
🔴 SELL Scenario (SELL Primary) - Preemptive Resistance
Entry 1: $4024$ (Sell retest trendline area)
SL: $4032$
TP1/TP2: $4012$ | $4000$
TP3: $3989$
Entry 2 (Continued SELL): When the price breaks the next trendline at $3992$
SL: $4000$
TP: $3940$
🟢 BUY Scenario (BUY Reversal) - Buy at Strong Support
Logic: Only buy when the price hits a strong liquidity support area, potential for short-term recovery.
Entry (BUY): Around $3960$ (Buy Scalping area)
SL: $3954$
TP1/TP2: $3972$ | $3988 FWB:TP3 : $4000$
📌 SUMMARY & DISCIPLINE (Liam's Note) Don't let the $5,000$ USD prospect affect short-term risk management. Trade according to Price Action. Adhere to SL and prioritize SELL positions at resistance areas.
Are you ready for the SELL strategy at the start of this week?
