Don't Trade These Trend Lines. Forex Gold Trading Basics
A lot of traders apply trend lines for trading and making predictions on different financial markets.
Trend line can also be an important element of price action patterns.
However, only few knows that some trend lines are better to be avoided .
In this article, I will share with you the types of trend lines that you should avoid and not rely on for making trading decisions.
Invalidated Trend Line
Even the strongest trend lines may lose their significance with time.
Before you take a trade from a trend line, make sure that it still remains valid.
If the trend line is not respected by the buyers and then by the sellers,
or by the sellers and then by the buyers, we say that such a trend line lost its significance, and it is better to not trade it.
Have a look at that rising trend line on USDCAD.
We see strong bullish reactions to that, and we may expect a bullish movement from that, once it is tested.
However, it was violated and after a breakout it should turn into a vertical resistance.
Retesting that, the price easily went through the broken trend line.
The trend line lost its significance, and it is better to not trade that in the future.
2 Touches Based Trend Line
When you are looking for a strong trend line to trade, remember that the trend line should be confirmed by at least 3 touches and 3 consequent bullish / bearish reactions to that.
Above is the example of a valid and reliable trend line.
However, quite often, newbie trade 2 touches based trend lines.
Most of the time, such trend lines are neglected by the market.
Moreover, relying on 2-touches-based trend lines, your chart will look like a complete mess .
Simply because there are too many trend line meeting that criteria.
Receding trend line
There are the trend lines that go against your trade with time while remaining valid.
Have a look at a major falling trend line on NZDCHF on a daily time frame.
You may open a swing long position from that on a daily or a day trade on intraday time frames like an hourly.
You can see that the market may easily go against your predictions for a long time, while perfectly respecting a trend line.
The price was sliding on that trend line for 6 consequent days before it finally started to grow.
Such trend lines are better to be avoided .
Make sure that a trend line and your trade have the same direction.
Trend lines can provide very safe points for trading entries. However, the trend lines are not equal and while some of them can be very profitable, some of them can lead to substantial losses.
❤️Please, support my work with like, thank you!❤️
I am part of Trade Nation's Influencer program and receive a monthly fee for using their TradingView charts in my analysis.
Tradingbasics

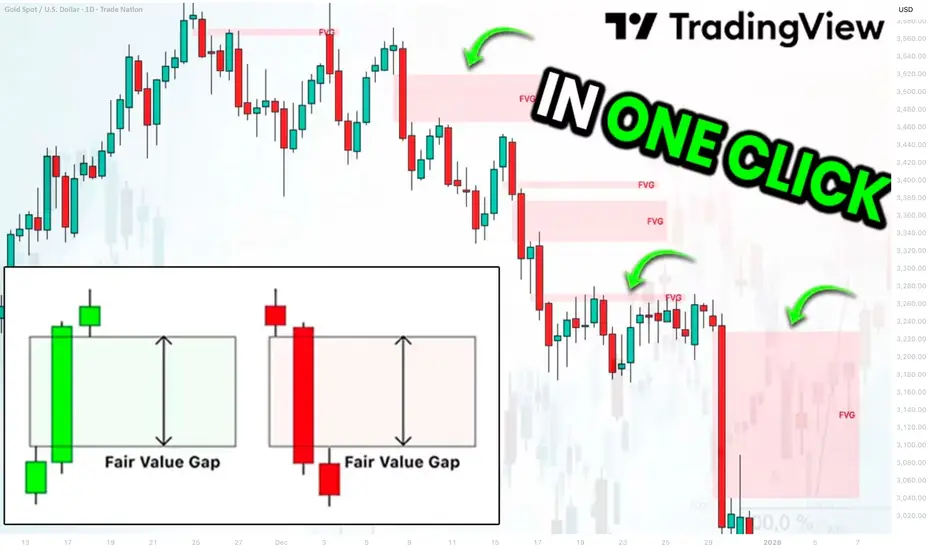
Best Free Fair Value Gap FVG Technical Indicator on TradingView
This free indicator accurately identifies Fair Value Gaps FVG on any market.
It is available on TradingView and it is very easy to set it up.
In this article, I will show you how to use this indicator and how to find a fair value gap easy in one click.
Let's start with my definition of a fair value gap because it is different from trader to trader.
FVG is a sudden, sharp price move that happens so fast that it leaves behind a price zone where very little trading actually occurred.
Because this zone saw almost no trading, it creates an imbalance .
Such a move is usually created by a large candle.
A candle with a big body and almost no wicks.
Among classic Japanese candlesticks, there is one such a candle.
It is called Marubozu.
Here are bullish and bearish structures of that candle.
A green one represents extremely strong bullish momentum. The price opened at the low of the period and closed at the high of the period. There were no pullbacks ; buyers were in complete control from the opening bell to the close.
Its bearish variation has the same logic.
The price opened at the high of the period and closed at the low of the period, with a very little trading activity within.
Our technical indicator will look for such a candle.
The indicator that we will use is called "All Candlestick Patterns".
In the settings of this indicator, we should select Marubozu White (bullish candle) and Marubozu Black (bearish candle).
After we click "OK", the indicator will immediately start working.
The indicator will show valid and significant Fair Value Gaps FVG on any time frame and any trading instrument.
Like any other indicator, it will miss some Fair Value Gaps, but while you are learning to identify them, it will help you to spot the most important ones.
❤️Please, support my work with like, thank you!❤️
I am part of Trade Nation's Influencer program and receive a monthly fee for using their TradingView charts in my analysis.
DON'T TRADE THESE SUPPORTS AND RESISTANCES (FOREX GOLD)
When it comes to technical analysis,
the understanding of which support and resistance levels to not trade can be as important as knowing which ones to trade.
In this article, I will show you the structure levels that professional traders avoid to maximize their profits and minimize losses.
Invalidated support and resistance
Invalidated support/resistance is the structure that has a clear historical significance, but that lost its strength and was neglected by the market during the last 2 tests.
Have a look at that key horizontal support.
We can see that in the recent past, the price bounced from that multiple times, confirming its significance.
Then, the price suddenly broke and closed below that support.
According to the rules, that structure should turn into a resistance after a violation.
However, after its test, the price bounced and violated that to the upside.
The structure became invalid , and you should not trade that in future.
Resistance in a Bullish Trend
If the market is trading in a bullish trend, according to the rules its last higher high composes a key horizontal resistance.
USDJPY is trading in a strong bullish trend.
The price dropped once it set a new higher high higher close.
It composes a key horizontal resistance.
Always remember, that in a bullish trend, the price tends to set new higher highs and higher lows over time.
Quite often, the test of the level of the last high leads to a further bullish continuation and a formation of a new higher high.
For that reason, it is better not to trade such resistances.
Support in a Bearish Trend
In a bearish trend, the last lower low is always considered to be a key horizontal support.
Above is a price action on USDCHF.
The pair is bearish and recently set a new lower low.
It is a key horizontal support now.
However, in a bearish trend, the price tends to set a new low after a retracement. Most of the time, it does not respect the support based on the last lower low.
I recommend you not to trade such supports.
I always repeat to my students that key levels work, but they are not equal in their significance. While some of them are very strong, some are better to be avoided.
❤️Please, support my work with like, thank you!❤️
I am part of Trade Nation's Influencer program and receive a monthly fee for using their TradingView charts in my analysis.

How to Set a Stop Loss in Price Action Trading Forex Explained
Wrong stop loss is one of the main reasons why newbie traders lose money.
I will share with you a proven stop loss strategy for price action trading Forex.
I will explain how to identify a safe stop loss level for any chart part, trend line and a breakout that you trade.
Learn how to set a safe stop loss easily on any time frame and no matter whether you are day trading, scalping or swing trading.
To correctly put a stop loss for trading price action in forex market, first, let's discuss 2 major types of price action patterns that you should know.
Trend line based patterns
The first type of patterns is called trend line based patterns.
In this category, we put all the patterns where trend lines are used as entries or confirmations.
Here is the list of these patterns:
Rising/falling parallel channels,
Rising/falling wedges,
Rising/falling expanding wedges/channels.
For example, in a rising parallel channel, its support is a strong vertical structure. It provides a safe place to buy the market from.
Alternatively, its breakout will provide a strong confirmation to sell.
Horizontal neckline based patterns
The second type of patterns is called neckline based patterns.
In this category, we include all chart patterns that lie on a horizontal neckline.
A signal that we rely on to trade these patterns is a breakout of their necklines.
Here is the list of these patterns:
Double top/bottom,
Head and shoulders and inverted one,
Ascending/descending triangle,
Cup and handle and inverted one.
Here is how we set a stop loss in trend line based patterns.
If we buy the market from a support line of a wedge or a channel, expecting a growth, we will need to the last bearish movement from the high of the pattern to the point where it touches a support line - our entry.
Our safe stop loss will be 1.272 fibonacci extension (from its high to low) of this movement.
If we sell the market after a breakout of a support line of a wedge or a channel, we will take the last bearish movement from the high of the pattern to the low of a breakout candle.
Our safe stop loss will be 1.272 fibonacci extension (from its low to high) of this movement.
Look how it works in practice:
If we sell the market from a resistance line of a wedge or a channel,
we will take the last bullish movement from the low of the pattern to the point where it touched a resistance line.
Our safe stop loss will be 1.272 fibonacii extension (from its low to high) of this movement.
Look how it works in practice:
Here is a safe stop loss for selling USDJPY forex pair from a resistance of a falling wedge.
If we buy a bullish breakout of a resistance line of a wedge or a channel, we will take a bullish movement from the low of the pattern to a high of the breakout candle.
Our safe stop loss will be 1.272 fibonacci extension (from its high to its low) of this movement.
Here is how easily we can set a stop loss, using this strategy, buying a breakout of a resistance line of a falling channel on NZDUSD forex pair.
And here is how we set stop loss for neckline based patterns.
If we see a breakout of a neckline of a bearish pattern, and we want to sell, we will need to find a pattern range: a low of the neckline of the pattern and highest high of the pattern.
Based on that, we will draw fibonacci extension (from its lows to high).
Our safe stop loss will be 1.272 extension.
That is how we put a stop loss, using this method on EURUSD, trading head & shoulders.
If we buy a breakout of a neckline of a bullish pattern, our safe stop loss will be based on 1.272 extention (from high to low) of the range of the pattern - the highest high of the neckline and the lowest low of the pattern.
That is how a safe stop loss for a cup & handle pattern on EURUSD looks. I drew fib.extension from the neckline's high to pattern's low.
This simple method will help you to always put a safe stop loss.
Integrate that in your trading plan and avoid losses, trading price action.
❤️Please, support my work with like, thank you!❤️
I am part of Trade Nation's Influencer program and receive a monthly fee for using their TradingView charts in my analysis.
Support and Resistance VS Supply and Demand Explained
In the today's post, I will compare support and resistance levels with supply and demand zones.
I will explain to you the difference between them and share important tips and examples.
What are support and resistance levels?
We also call them key levels. These are particular levels on a price chart from where in the past we saw significant bullish or bearish movements.
Key support will be a one single level, that has a historical significance and from where a bullish reaction will be anticipated.
The all-time low on USDCHF will be a perfect example of a key support.
It is one single level that was respected one time in the past and from where a bullish reversal initiated.
Key resistance will be a one single level on a price chart that has a historical significance and from where a bearish movement will be expected.
The all-time high on Gold will represent a key horizontal resistance.
That level was respected one time in the past and from that level exactly the market dropped heavily.
What are supply and demand zones?
In comparison to support and resistance levels, supply and demand zones are the areas on a price chart. The zones that are based on multiple touches and consequent strong bullish or bearish reactions.
Demand zone will be the area that was tested at least 2 times in the past, and the price should strictly respect different price levels within that area.
A similar reaction will be anticipated from the demand zone in the future.
The yellow area above will a good example of a demand zone.
You can see that the price tested that area 3 times, and each time the market respected different levels lying within that.
These 3 tests compose the demand area.
Supply zone will be the area that was tested at least 2 times in the past and the price should strictly respect different price levels within that area.
A similar reaction will be anticipated from the demand zone in the future.
In this example, a supply area on EURUSD is based on 2 touches of key levels, lying very close to each other.
On the chart above, I underlined 2 horizontal support levels - the single levels that were respected by the market multiple times, and a supply zone - the area that is based on tests of multiple levels lying close to each other.
Support and resistance levels give you SINGLE levels from where you can look for trading opportunities. While supply and demand zones represent the areas . After a test of a supply and demand zone, the market may react to a RANDOM level within that.
For newbie traders, it is highly recommendable to trade single key levels, while experienced traders can broaden their strategies and trade supply and demand zones as well.
❤️Please, support my work with like, thank you!❤️
I am part of Trade Nation's Influencer program and receive a monthly fee for using their TradingView charts in my analysis.

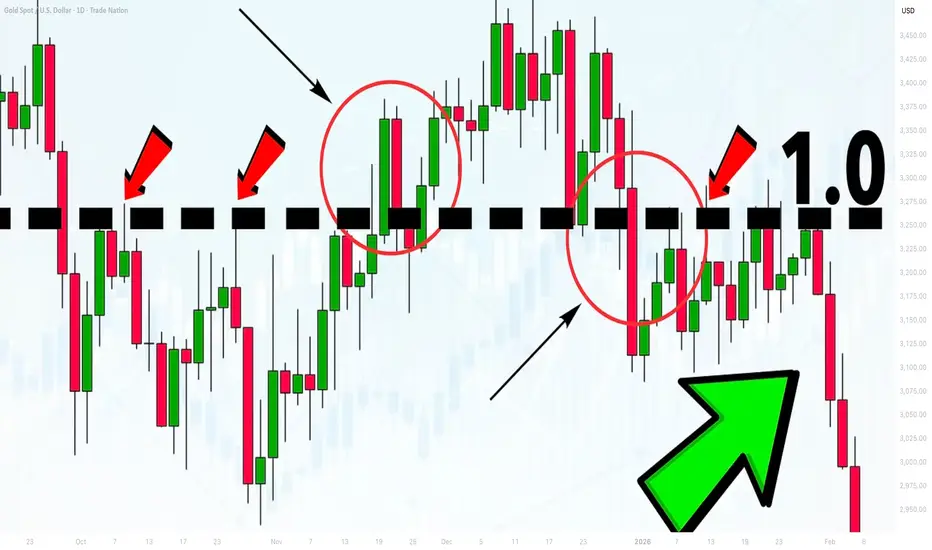
Learn the Significance of Psychological Levels and Round Numbers
When traders analyze the key levels, quite often then neglect the psychological levels in trading.
In this article, we will discuss what are the psychological levels and how to identify them.
What is Psychological Level?
Let's start with the definition.
Psychological level is a price level on a chart that has a strong significance for the market participants due to the round numbers.
By the round numbers, I imply the whole numbers that are multiples of 5, 10, 100, etc.
These levels act as strong supports and resistances and the points of interest of the market participants.
Take a look at 2 important psychological levels on EURGBP: 0.95 and 0.82. As the market approached these levels, we saw a strong reaction of the price to them.
Why Psychological Levels Work?
And here is why the psychological levels work:
Research in behavioral finance has shown that individuals exhibit a tendency to anchor their judgments and decisions to round numbers.
Such a decision-making can be attributed to the cognitive biases.
Quite typically, these levels act as reference points for the market participants for setting entry, exit points and placing stop-loss orders.
Bad Psychological Levels?
However, one should remember that not all price levels based on round numbers are significant.
When one is looking for an important psychological level, he should take into consideration the historical price action.
Here are the round number based levels that I identified on AUDUSD on a weekly time frame.
After all such levels are underlined, check the historical price action and make sure that the market reacted to that at least one time in the recent past.
With the circles, I highlighted the recent reaction to the underlined levels. Such ones we will keep on the chart, while others should be removed.
Here are the psychological levels and proved their significance with a recent historical price action.
From these levels, we will look for trading opportunities.
Market Reaction to Psychological Levels
Please, note that psychological levels may trigger various reactions of the market participants.
For instance, a price approaching a round number may trigger feelings of greed, leading to increased selling pressure as traders seek to lock in profits.
Alternatively, a breakout above/below a psychological level can trigger buying/selling activity as traders anticipate further price momentum.
For that reason, it is very important to monitor the price action around such levels and look for confirmations.
Learn to identify psychological levels. They are very powerful and for you, they can become a source of tremendous profits.
❤️Please, support my work with like, thank you!❤️
I am part of Trade Nation's Influencer program and receive a monthly fee for using their TradingView charts in my analysis.
5 Elements of the Best Key Level in Forex, Gold Trading
What are the best key levels to trade?
This year I analyzed more than 1500 key structures on Forex, Gold, Crypto and Indexes.
In the today's article, I prepared for you a list of 5 elements of a perfect support and resistance for trading.
As always, remember that the best key levels are always on a daily time frame . So all the structures that we will discuss will be strictly on a daily .
Also, all the structures that I analyzed and traded are available on my TradingView page, so you can back test them by your own.
1. Clear historical significance
The structure that you spotted should act as a significant historical support or resistance.
Here are the important historical support and resistance that I spotted on USDCAD on a daily time frame.
2. Psychological significance
The structure that you identified should match with round numbers.
All the structures that we spotted on USDCAD match with psychological numbers.
3. Confluence with other technical tools
The best structure should align with other trading tools such as trend lines or Fibonacci levels , strengthening its significance.
After adding fibonacci levels and a significant falling trend line on the chart, the confluence was found in Resistance 6, Resistance 3, Resistance 2, Resistance 1, Support 2. Other structure does not match with technical tolls.
4. Volume
The level experiences high trading volumes, indicating strong participation and interest from market participants, especially smart money.
All the structures that we underlined show significant volume spikes. By volume spike, I mean a volume being higher than the average volume - a blue curve on volume.
5. Multiple touches
The more, the better. There are numerous instances where price has respected and reacted to the structure, confirming its strength (at least 2).
Only these 3 structures were confirmed by the multiple touches. These resistances will be considered the strongest ones.
That checklist will help you to identify the most significant structures from where you will be able to catch impulsive movement and make nice profits.
❤️Please, support my work with like, thank you!❤️
I am part of Trade Nation's Influencer program and receive a monthly fee for using their TradingView charts in my analysis.
Best Trading Confirmation. Learn 95% Accurate Entry Signal
I have analyzed 1300 forecasts and signals that I shared on TradingView last year and found 95% accurate trading confirmation.
In this article, we will discuss multiple types of confirmations and their winning rate on Forex, Gold, Indexes, Crypto & Commodities.
First, let me introduce you to the types of analysis that I provided.
1 - Structure based forecast
I have shared more than 55 trading setup with key levels analysis:
Where the price is approaching a key daily horizontal support and resistance.
Here is the example of such a post.
Test of a key horizontal or vertical support/resistance turned out to be a poor trading signal.
Total accuracy of structure based forecasts is 38%.
Please, note that if we consider the market trend in our calculations,
the trend-following structure based setup will be 42% accurate, while a performance of a counter trend setup drops to 35%
2 - Structure breakout based forecast
I analyzed and posted 73 posts with a key structure breakout as a confirmation on a daily.
Above is the example of a such a forecast.
Key levels breakout turned out to be a strong bullish or bearish confirmation with 59% accuracy.
Trend direction did not affect the efficiency of a key structure breakout that much, with a 60% accuracy of a trend following setup versus 57% of counter trend.
3 - Structure based forecast with a single intraday confirmation
I shared more than 500 setups with a test of a key structure on a daily and a single price action based bullish or bearish confirmation on a 4h/1h time frame.
My intraday confirmation is a formation of a price action pattern with a consequent breakout of its neckline/trend line in the projected direction.
Please, check the example of such a signal.
Just a single intraday confirmation dramatically increases the accuracy of a structure based setup.
Average winning rate is 66%.
4 - Structure based forecast with multiple intraday confirmations
I spotted and posted 200+ forecasts with a test of a key structure on a daily and multiple price action based bullish or bearish confirmations on a 4h/1h time frame.
Multiple confirmations imply the formation of multiple price action patterns on 4/1h t.f.
Here is the example of such a setup on EURGBP.
Two or more confirmations on a key structure increase the average winning rate to 72%.
Among multiple confirmations, I found a 95% accurate bearish signal:
The market should be in a bearish trend.
The price should test a key daily structure resistance.
The market should form a rising wedge pattern on a 4h/1h time frames and the highs of the wedge should strictly test the key structure and should not violate them.
After a test of structure, the price should form a bearish price action pattern on the highs of the wedge.
Above is a setup with the best trading confirmation.
A bearish breakout of the neckline of the pattern and a support of the wedge was a 95% accurate trading signal last year.
Of course, there are various confirmations, depending on a trading style. The ones that I shared with you are structure/price action based.
And I am truly impressed by their accuracy.
❤️Please, support my work with like, thank you!❤️
I am part of Trade Nation's Influencer program and receive a monthly fee for using their TradingView charts in my analysis.
6 Best Tips for Small Trading Accounts (Forex, Gold)
This useful trading tips will help you to efficiently start trading with a small trading account.
A quick note: by a small account, I mean an account size from 10$ - 2000$.
1 - Trade less often
Small account implies a limited amount of money for trading. It means that among dozens of trading opportunities that you spot during a trading day, you should carefully pick only the most promising ones.
I recommend opening maximum 3 trades per day.
2 - Stick to one strategy
One of the ways to trade less frequently is to stick to one single trading strategy. Most of the traders do completely opposite: instead of focusing on one approach, they prefer to trade multiple ones simultaneously.
Trading various strategies requires a lot of capital. The more strategies you follow, the more margin is needed.
With a small trading account, you are risking being left without a free margin for all the trading opportunities that the strategies provide.
3 - Trade liquid instruments with low spreads
When you are picking the financial instruments for your trading, make sure that you select the most liquid ones. You can assess the liquidity of the instrument by a spread. The bigger is the spread, the less liquid is the asset.
Take a look at a spread difference between EURUSD and CHFJPY.
The spread on EURUSD is 0.1 pip.
While the spread on CHFJPY is 2.7 pips.
Spreads directly affect the costs of trading. Bigger spreads reduce the potential profits and increase the risks.
Make sure that you choose the assets with the lowest spreads possible.
4 - Shorten the list of trading instruments
One more option to trade less often is to narrow down the list of your trading instruments. I recommend choosing the maximum of 7 instruments.
7 USD Major Forex Pairs:
EURUSD,
GBPUSD,
USDJPY,
USDCAD
NZDUSD
AUDUSD
USDCHF
is a perfect watch list for a small account trader.
5 - Don't trade higher time frames
Be careful when deciding a time frame to trade.
Remember that the higher is the time frame, the bigger are the stop losses for your traders.
On the left chart is the swing trade that I took with my students on EURUSD chart on a daily. While on the right is the scalping trade taken on 30 minutes time frame.
A stop loss for swing trade is 90 pips and a stop loss of scalping position is 19 pips.
Big stop losses require more free margin and limit the amount of the trades that you can take simultaneously.
For that reason, prioritize lower time frame trading with a small trading account.
6 - Don't risk more than 2% per trade
When traders trade with a small trading account, they often risk a huge portion of their trading account per a single trade.
If you have 100$ trading account, and you risk 20$ per trade, the nominal value of that risk does not look huge. But from a percentage standpoint, it is 20% of the total balance.
Just a 5 trades losing streak will blow such an account.
Make sure that you apply a position size calculator and risk no more than 2% of your account per trade.
Following these recommendations, you will be able to build an effective trading plan that will help you to grow your capital quickly.
❤️Please, support my work with like, thank you!❤️
I am part of Trade Nation's Influencer program and receive a monthly fee for using their TradingView charts in my analysis.
10 POWERFUL INVESTING & TRADING QUOTES OF ALL TIME
Here are powerful quotes of professional traders, investors and experts in financial markets.
Let their words inspire you and help you in your trading journey.
"To succeed in the market, you must learn to think like everyone else and do the opposite." - Sir John Templeton 📈💭💡
"The four most dangerous words in investing are: 'This time it's different.'" - Sir John Templeton ⏳📉🛑
"The more you learn, the more you earn." - Warren Buffett 📚💰📈
"The key to trading success is emotional discipline. If intelligence were the key, there would be a lot more people making money." - Victor Sperandeo. 💪💰🚫🧠
"Investing is not about making predictions, it's about having a plan and sticking to it." - Tony Robbins 📊🔄📌
"The best time to buy a stock is when the blood is running in the streets." - Baron Rothschild 💀🔪💰
"The best investment you can make is in yourself." - Warren Buffett 💼💡💰
"The stock market is not a casino; it's a crooked casino." - Charlie Munger 🎰🎲🏛️
"Losses are part of the game. You can't win every trade." - Martin Schwartz. 📉😔💔
"The fundamental law of investing is the uncertainty of the future." - Peter Bernstein. ⚖️❓🔮
The More I trade, the more I realize how precise and meaningful are these phrases. Take them seriously, and they will help you achieve the financial success.
❤️Please, support my work with like, thank you!❤️
I am part of Trade Nation's Influencer program and receive a monthly fee for using their TradingView charts in my analysis.
Learn 2 Essential Elements of Forex Gold Trading
In the today's post, we will discuss how Forex Gold trading is structured, and I will share with you its 2 key milestones.
Trading with its nuances and complexities can be explained as the interconnections of two processes: trading rules creation and trading rules following.
1️⃣ With the trading rules, you define what you will trade and how exactly, classifying your entry and exist conditions, risk and trade management rules. Such a set of consistent trading rules compose a trading strategy.
For example, you can have a following trading plan:
you trade only gold, you analyze the market with technical analysis,
you buy from a key support and sell from a key resistance on a daily, your entry confirmation is a formation of a reversal candlestick pattern.
You set stop loss above the high/low of the pattern, and your target is the closest support/resistance level.
Here is how the trading setup would look like.
In the charts above, all the conditions for the trade are met, and the market nicely reached the take profit.
2️⃣ Trading strategy development is a very simple process. You can find hundreds of different ones on the internet and start using one immediately.
The main obstacle comes, however, with Following Trading Rules.
Following the rules is our second key milestone. It defines your ability to stay disciplined and to stick to your trading plan.
It implies the control of emotions, patience and avoidance of rationalization.
Once you open a trade, following your rules, challenges are just beginning. Imagine how happy you would feel yourself, seeing how nicely gold is moving to your target after position opening.
And how your mood would change, once the price quickly returns to your entry.
Watching how your profits evaporate and how the initially winning position turns into a losing one, emotions will constantly intervene.
In such situations, many traders break their rules , they start adjusting tp or stop loss or just close the trading, not being able to keep holding.
The ability to follow your system is a very hard skill to acquire. It requires many years of practicing. So if you believe that a good trading strategy is what you need to make money, please, realize the fact that even the best trading strategy in the world will lose without consistency and discipline.
❤️Please, support my work with like, thank you!❤️
I am part of Trade Nation's Influencer program and receive a monthly fee for using their TradingView charts in my analysis.
Learn the 3 TYPES of MARKET ANALYSIS in Gold Forex Trading
In the today's post, we will discuss 3 types of analysis of a financial market.
🛠1 - Technical Analysis
Technical analysis focuses on p rice action, key levels, technical indicators and technical tools for the assessment of a market sentiment.
Pure technician thoroughly believes that the price chart reflects all the news, all the actions of big and small players. With a proper application of technical strategies, technical analysts make predictions and identify trading opportunities.
In the example above, the trader applies price action patterns, candlestick analysis, key levels and 2 technical indicators to make a prediction that the market will drop to a key horizontal support from a solid horizontal resistance.
📰2 - Fundamental Analysis
Fundamental analysts assess the key factors and related data that drive the value of an asset.
These factors are diverse: it can be geopolitical events, macro and micro economic news, financial statements, etc.
Fundamental traders usually make trading decision and forecasts, relying on fundamental data alone and completely neglecting a chart analysis.
Price action on Gold on a daily time frame could be easily predicted, applying a fundamental analysis.
A bearish trend was driven by FED Interest Rates tightening program,
while a strong bullish rally initiated after escalation of Israeli-Palestinian conflict.
📊🔬 3 - Combination of Technical and Fundamental Analysis
Such traders combine the principles of both Technical and Fundamental approaches.
When they are looking for trading opportunities, they analyze the price chart and make predictions accordingly.
Then, they analyze the current related fundamentals and compare the technical and fundamental biases.
If the outlooks match , one opens a trading position.
In the example above, Gold reached a solid horizontal daily support.
Testing the underlined structure, the price formed a falling wedge pattern and a double bottom, breaking both a horizontal neckline and a resistance of the wedge.
These were 2 significant bullish technical confirmation.
At the same time, the escalation of Israeli-Palestinian conflict left a very bullish fundamental confirmation.
It is an endless debate which method is better.
Each has its own pros and cons.
I strongly believe that one can make money mastering any of those.
Just choose the method that you prefer, study it, practice and one day you will make it.
❤️Please, support my work with like, thank you!❤️
I am part of Trade Nation's Influencer program and receive a monthly fee for using their TradingView charts in my analysis.

What is Dynamic Support and Resistance Levels & Zones in Forex
Dynamic supports and resistances play a crucial role in technical analysis.
Unlike classic supports and resistances, these zones change and adapt to a market price action in real time.
Learn what is dynamic support and resistance in Forex, Gold trading and how to find it easily.
Discover its main types and real market examples.
Let's start with the basics.
There are 2 major types of supports and resistances in technical analysis.
The first type is called static .
Such supports and resistances are fixed and don't change with time.
It should be strictly horizontal key levels or the zones.
Market price action and momentum beyond them do not affect these supports and resistances.
In the example above, you can find static supports and resistances on Gold. The market may return to one of those levels or the zones today, tomorrow or in a month, but it will not move.
In comparison to static supports and resistances, the dynamic ones shift with time. They constantly change and adjust as the time flies.
One of the obvious types of dynamic supports and resistances is a trend line.
Above is the example of a dynamic rising support based on trend line.
As the time goes, a support shifts and becomes higher and higher.
I found a great example of a dynamic resistance on Dollar Index.
Depending on the moment when the price tests that, the resistance will be on different levels.
The later the price tests the trend line, the lower is the resistance.
When newbie traders learn dynamic supports and resistances, they usually stop on trend lines.
But it is just a beginning.
Really significant dynamic supports are resistances will be the zones .
The areas based on static horizontal supports and resistances and trend lines.
Examine a price action on GBPCHF forex pair.
We have a static horizontal support area and a dynamic rising trend line.
Two supports intersect, composing a contracting dynamic support zone.
With time, it will become narrower, accumulating buy orders within.
On NZDCAD forex pair, I underlined a contracting dynamic resistance zone that is based on an intersection of a static horizontal resistance area and a falling trend line.
Selling orders will be distributed within.
The 2 dynamic support and resistance zones that we discussed are narrowing , but that is not always the case.
A dynamic support zone that I found on GBPNZD is expanding and broaden with time.
It is based on a dynamic falling trend line and a static horizontal support.
With time its boundaries will be wider and a bullish reaction may initiate from any level within that.
A dynamic resistance area that I spotted on EURCAD forex pair is a great example of an expanding resistance.
It is based on a static horizontal resistance and a rising trend line.
We can easily recognize how it grows with time.
Of course, another types of dynamic supports and resistances exist. But they are more nuanced and rare.
As soon as you learn to recognize the clusters that we discussed in this article, you will be able to recognize the less obvious ones as well.
Next time, when you execute a support and resistance analysis, try to find a dynamic zone. You can find it on any time frame, and forex pair and gold, and it will completely change your perspective on the market.
❤️Please, support my work with like, thank you!❤️
I am part of Trade Nation's Influencer program and receive a monthly fee for using their TradingView charts in my analysis.

9 Essential TIPS For Newbie Traders (Learn from my Mistakes!)
In the today's article, I will reveal trading secrets I wish I knew when I started trading.
1️⃣ Forget about becoming a pro quickly
Most of the traders believe, that you can learn how to trade easily and that it takes a very short period of time in order to master a profitable trading strategy.
The truth is, however, that trading is a long journey.
I spent more than 3 years, trying different strategies and looking for a profitable technique to trade. Once I found that, it took more than a year to polish a trading strategy and to learn how to apply that properly.
Be prepared to spend YEARS before you find a way to trade profitably.
2️⃣ Focus on One Strategy
While you are learning how to trade you will try different techniques, tools and strategies. And the thing is that newbies are trying multiple things simultaneously. The more strategies you try at once, the more setups you have on your chart. The more setups you have on your chart, the more complex and difficult is your trading.
Remember that in this game, your attention is the key.
You should meticulously study each and every trading setup.
For that reason, I highly recommend you to focus on one strategy, one approach, one technique. Test it, try it and look for a new one only when you realize that it doesn't work.
Here is the example how the same price chart can provide absolutely different trading opportunities depending on a trading strategy.
Price action pattern trader would recognize a lot of a patterns, while indicator based trader could spot absolutely different bullish and bearish signals.
Now, try to imagine how hard it would be to follow both strategies simultaneously.
3️⃣ Start with small capital that you can afford to lose
You will lose your first trading deposit and, probably, the second one and potentially the third one as well.
Losses are the only way to learn real trading. While you are on a demo account, you feel like a king, but once you start risking your savings, the perspective completely changes .
For that reason, make sure that you trade with an account that you can afford to lose. The fact of blowing such an account should be unpleasant, but that should not affect your daily life.
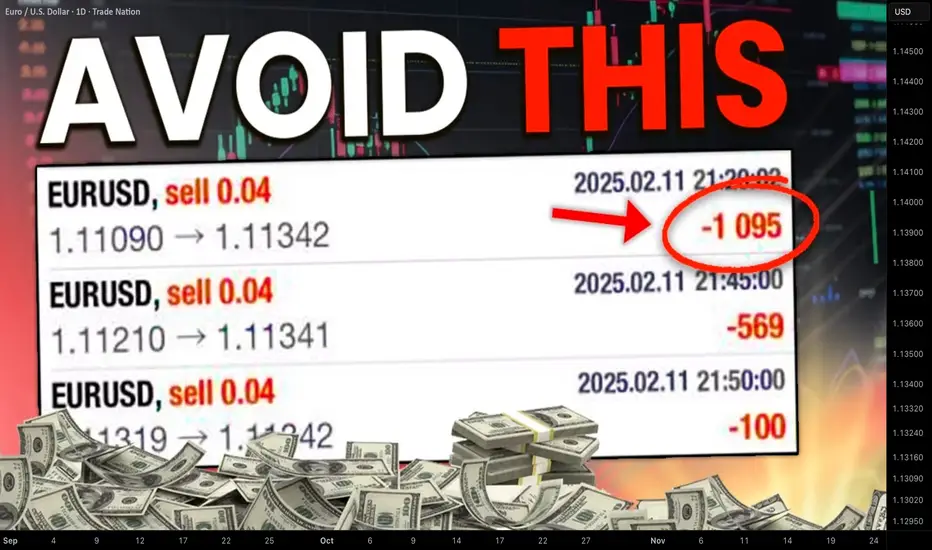
4️⃣ Use stop loss
I am doing trading coaching for more than 4 years.
What pisses me off is that the main reason of the substantial losses of my mentees is the absence of stop loss. Why can it be if naturally everyone: from your broker to Instagram trading gurus repeat that day after day.
Set stop loss, know in advance how much you risk per trade, and know the exact level on a price chart where you become wrong.
Imagine what could be your loss, if you shorted USDJPY and hold the trade while the market kept going against you.
5️⃣ Forget about getting rich quick
That is the iconic fallacy. I believe that around 90% of people who come in this game want to get rich quick , want easy money.
And no surprise, when I share a trading setup in my free telegram channel, and it loses I receive dozens of messages that I am a scammer.
People truly believe that professional trading implies 100% win rate and quick and easy money.
The truth is, traders, that trading is a very tough game. And with a good trading strategy, you have just a little statistical edge that will give you the profits that would slightly overcome your losses.
6️⃣ Train your eyes
Professional trading implies pattern recognition: it can be some technical indicators pattern, the price action or candlestick formation, etc.
Your main goal as a trader is to learn to identify these patterns.
Pattern recognition is a hard skill to acquire.
You should spend dozens of hours in front of the screen in order to train your eyes to identify certain patterns.
Here is how many patterns you would spot on GBPUSD chart, paying close attention.
7️⃣ Track and analyze your trades
Study all the trades that you take, especially the losing ones.
Look for mistakes, look for the reasons why a certain setup played out and why a certain one didn't. Journal your trades and make notes.
8️⃣ Don't use technical indicators
Newbies believe that technical indicators should do the work for them.
They are constantly looking for one or a bunch that will accurately show where the market will go.
However, I always say to my mentees that technical indicators make the chart messy and distract.
If you just started trading, focus on a naked chart, learn to analyze the market trend, key levels, classic price action patterns.
Learn to make accurate predictions relying on a price chart alone.
Only then add some technical indicators on your chart.
They won't do the work for you, but will help you to slightly increase the accuracy of a certain setup.
Above is the classic chart of a newbie trader.
A lot of indicators and a complete mess
The same chart would look much better without technical indicators.
9️⃣ Find a Mentor
There are hundreds of trading mentors on Instagram, YouTube, TradingView. Find the one with a trading style that you like.
Follow him, learn from his trading experience, listen to his trading recommendations.
11 years ago I found a guy on YouTube, his name was Jason.
I really liked his free teachings, and they were meaningful to me.
I decided to purchase his premium coaching program.
It was 200$ monthly - a huge amount of money for me at that time.
However, with his knowledge I saved a lot, I learned a lot of profitable techniques and tricks that helped me to become a professional forex trader.
Of course, this list could be much bigger.
The more I think about different subjects in trading, the more important tips come to my mind. However, I believe that the tips above are essential and I truly wish I knew all that before I started.
I hope that info will help you in your trading journey!
Good luck to you.
❤️Please, support my work with like, thank you!❤️
I am part of Trade Nation's Influencer program and receive a monthly fee for using their TradingView charts in my analysis.

SMC Trading Basics. Change of Character - CHoCH (GOLD FOREX)
In the today's post, we will discuss one of the most crucial concepts in SMC - Change of Character.
Change of Character relates to market trend analysis.
In order to understand its meaning properly, first, we will discuss how Smart Money traders execute trend analysis.
🔘Smart Money Traders apply price action for the identification of the direction of the market.
They believe that the trend is bullish ,
if the price forms at least 2 bullish impulse with 2 consequent higher highs and a higher low between them.
The market trend is considered to be bearish ,
if the market forms at least 2 bearish impulses with 2 consequent lower lows and a lower high between them.
Here is how the trend analysis looks in practice.
One perceives the price action as the set of impulse and retracement legs.
According to the rules described above, USDCAD is trading in a bullish trend because the pair set 2 higher lows and 2 higher highs.
🔘Of course, trends do not last forever.
A skill of the identification of the market reversal is a key to substantial profits in trading.
Change of Character will help you quite accurately identify a bullish and bearish trend violation.
📉In a bearish trend, the main focus is the level of the last lower high.
While the market is trading below or on that, the trend remains bearish .
However, its bullish violation is a very important bullish signal,
it is called a Change of Character, and it signifies a confirmed violation of a bearish trend.
In a bearish trend, CHoCH is a very powerful bullish pattern.
Take a look, how accurate CHoCH indicated the trend reversal on Gold.
After a massive selloff, a bullish breakout of the level of the last lower high confirmed the initiation of a strong bullish wave.
📈In a bullish trend, the main point of interest is the level of the last higher low. While the price is trading above that or on that, the trend remains bullish.
A bearish violation of the last higher low level signifies the violation of a current bullish trend. It is called a Change of Character, and it is a very accurate bearish pattern.
Take a look at the example on Dollar Index below.
In a bullish trend, bearish violation of the last higher low level
quite accurately predicted a coming bearish reversal.
Change of Character is one of the simplest , yet accurate SMC patterns that you should know.
First, learn to properly execute the price action analysis and identify HH, HL, LL, LH and then CHoCH will be your main tool for the identification of the trend reversal.
❤️Please, support my work with like, thank you!❤️
I am part of Trade Nation's Influencer program and receive a monthly fee for using their TradingView charts in my analysis.

Learn The Difference Between Beginner and Expert in Trading
In the today's post, we will discuss the evolution of a mindset of a trader as he matures in trading.
✔️Beginner
For some unknown reasons, beginners assume that a couple of educational videos and books about trading is more than enough to start trading successfully.
They believe that they got a comprehensive knowledge and that very few things remain to learn.
They start trading, but quickly realize that their knowledge is not enough to make even small gains.
✔️COMPETENT
After practicing a couple of years, traders come to the conclusion
that they know everything in that field. That they learned, tested and tried all concepts and techniques that are available.
They consider themselves to be the experts in the field BUT
for some unknown reasons, these traders still are not able to trade profitably.
✔️EXPERT
After many years of learning, training and practicing, eyes finally open.
Traders realize how limited is their knowledge and how much more there is to learn .
While they already have the skills to trade in profits, they understand now that even the entire life is not enough to learn all the subtleties of trading.
And here is a little lifehack for you:
if you are a beginner, embrace a mindset of an expert.
Start from realizing how little you actually know and how much more there is to know, that will help you a lot in your trading journey.
❤️Please, support my work with like, thank you!❤️
I am part of Trade Nation's Influencer program and receive a monthly fee for using their TradingView charts in my analysis.

AUDCAD: Pullback From Resistance Confirmed 🇦🇺🇨🇦
AUDCAD is going to retrace from a key intraday horizontal resistance.
A local bearish CHoCH and an imbalance on an hourly time frame
provide a strong bearish confirmation.
Goal - 0.88445
❤️Please, support my work with like, thank you!❤️
I am part of Trade Nation's Influencer program and receive a monthly fee for using their TradingView charts in my analysis.

Learn 6 Common Beginner Trading Mistakes (FOREX, GOLD)
In the today's post, we will discuss very common beginner's mistakes in trading that you should avoid.
1. No trading plan 📝
That is certainly the TOP 1 mistake. I don't know why it happens but 99% of newbies assume that they don't need a trading plan.
It is more than enough for them to watch a couple of educational videos, read some books about trading and Voilà when a good setup appears they can easily recognize and trade it without a plan.
Guys, I guarantee you that you will blow your trading account in maximum 2 months if you keep thinking like that. Trading plan is the essential part of every trading approach, so build one and follow that strictly.
2. Overtrading 💱
That mistake comes from a common newbies' misconception: they think that in order to make money in trading, they should trade a lot. The more they trade, the higher are the potential gains.
The same reasoning appears when they choose a signal service: the more trades a signal provider shares, the better his signals are supposed to be.
However, the truth is that good trades are very rare and your goal as a trader is to recognize and trade only the best setups. While the majority of the trading opportunities are risky and not profitable.
3. Emotional trading 😤
There are 2 ways to make a trading decision: to make it objectively following the rules of your trading plan or to follow the emotions.
The second option is the main pick of the newbies.
The intuition, fear, desire are their main drivers. And such an approach is of course doomed to a failure.
And we will discuss the emotional trading in details in the next 2 sections.
4. Having no patience ⏳
Patience always pays. That is the trader's anthem.
However, in practice, it is extremely hard to keep holding the trade that refuses to reach the target, that comes closer and closer to a stop loss level, that stuck around the entry level.
Once we are in a trade, we want the price to go directly to our goal without any delay. And the more we wait, the harder it is to keep waiting. The impatience makes traders close their trades preliminary, missing good profits .
5. Greed 🤑
Greed is your main and worst enemy in this game.
It will pursue you no matter how experienced you are.
The desire to get maximum from every move, to not miss any pip of profit, will be your permanent obstacle.
Greed will also pursue you after you close the profitable trades. No matter how much you win, how many good winning trades you catch in a row, you always want more. And that sense main lead you to making irrational, bad trading decision.
6. Big Risks 🛑
Why to calculate lot size for the trade?
Why even bother about risk management?
These are the typical thoughts of the newbies.
Newbie traders completely underestimate the risks involved in trading and for that reason they are risking big.
I heard so many times these stories, when a trading deposit of a trader is wiped out with a one single bad trade.
Never ever risk big, especially if you just started.
Start with a very conservative approach and risk a tiny little portion of your trading account per trade.
Of course there are a lot more mistakes to discuss.
However, the ones that I listed above at the most common
and I am kindly recommending you to fix them before you start trading with a substantial amount of money.
❤️Please, support my work with like, thank you!❤️
I am part of Trade Nation's Influencer program and receive a monthly fee for using their TradingView charts in my analysis.

Learn What is TRAILING STOP LOSS | Risk Management Basics
In the today's article, we will discuss a trailing stop loss. I will explain to you its concept in simple words and share real market examples.
🛑Trailing stop loss is a risk management tool that allows to protect unrealized profits of an active trading position as long as the price moves in the desired direction.
Traditionally, traders trade with fixed stop loss and take profit. Following such an approach, one knows exactly the level where the trade will be closed in a profit and the level where it will be closed in a loss.
Take a look at a long trade on USDCAD above.
The trade has fixed TP Level - 1.354 and fixed SL Level - 1.341.
Once one of these levels is reached, the trade will be closed.
Even though the majority of the traders stick to fixed sl and tp, there is one important disadvantage of such an approach – substantial gains could be easily missed .
After the market reached TP in USDCAD trade, the price temporarily dropped, then a strong bullish rally initiated and the price went way above the Take Profit level. Potential gains with that long position could be much bigger.
Trailing stop solves that issue.
With a trailing stop loss, the trader usually opens the trade with Stop Loss and WITHOUT Take Profit.
Take a look at a long trade on USDCHF.
Trader expects growth, he opens a long position and sets stop loss – 0.8924, while take profit level is not determined.
With a trailing stop loss, the trader usually opens the trade with Stop Loss and WITHOUT Take Profit.
As the market starts growing, one decides not to close the trade in profit, but modify stop loss – trail it to the level above the entry.
As the market keeps rallying, one TRAILS a stop loss in the direction of the market, protecting the unrealized gains.
When the market finally starts falling, the price hits stop loss and a trader closes the trade in a substantial profit.
The main obstacle with the application of a trailing stop is to keep it at a distance from current price levels that is not too narrow nor too wide.
With a wide stop loss distance, substantial unrealized gains might be washed out with the market reversal.
Imagine you predicted a nice bullish rally on Bitcoin.
The market bounced nicely after you opened a long position.
Trailing stop loss too far from current price levels, all the gains could be easily wiped out.
While with a narrow trailing stop distance, one can be stop hunted before the move in the desired direction continues.
A trader opens a long trade on EURJPY and the price bounces perfectly as predicted.
One immediately trails the stop loss.
However, the distance between current prices was too narrow and the position was closed after a pullback.
And then market went much higher.
In conclusion, I want to note that fixed SL & TP approach is not bad , it is different and for some trading strategies it will be more appropriate. However, because of its limitations, occasionally big moves will be missed.
Try trailing stop by your own, combine it with your strategy and I hope that you will make a lot of money with that!
❤️Please, support my work with like, thank you!❤️
I am part of Trade Nation's Influencer program and receive a monthly fee for using their TradingView charts in my analysis.

When and How to Use Weekly Time Frame in Gold Forex Trading
Ignoring weekly time frame chart analysis could cost you big losses in Forex, Gold trading!
Discover 3 specific cases when weekly time frame beats daily time frame analysis.
Learn the situations when weekly timeframe exposes what daily charts can’t, how to analyze it properly and when to check it.
1. Long-term historic levels
When the market trades in a strong bullish or bearish trend and goes beyond recent historic levels, quite often the daily time frame will not be sufficient for the identification of significant supports and resistances.
The proven way to identify the next meaningful levels will be to analyze a weekly time frame.
Examine a price action on EURAUD forex pair on a daily time frame chart. The market is trading in a strong bullish trend and just updated the high.
Checking the historic price action, we don't see any historic resistance on the left.
Switching to a weekly time frame chart, we can easily recognize a historic resistance that the price respected 5 years ago.
That's a perfect example when weekly t.f revealed a historic price action that a daily didn't.
2. Trend-lines
Weekly time frame analysis is important not only for a search of historic levels. It can help you find significant vertical structures - the trend lines.
We can easily find several meaningful historic resistances on EURUSD pair on a daily time frame.
Though, there are a lot of historic structures there, let's check if there are some hidden structures on a weekly.
Weekly time frame reveals 2 important trend lines, one being a vertical support and another being a vertical resistance.
With a daily time frame analysis, these trend lines would be missed .
3. More accurate breakout confirmations
Some false support and resistance breakouts that you see on a daily could be easily avoided with a weekly time frame analysis.
Quite regularly, a daily time frame support or resistance is in fact a weekly structure. And for its breakout, a weekly candle close will provide more accurate confirmation.
From a daily time frame perspective, we see a confirmed breakout - a daily candle close above a solid resistance zone.
It provides a strong bullish signal on AUDUSD forex pair.
However, the violation turned out to be false and dropped.
Such a false breakout , could be easily avoided, checking a weekly time frame chart.
The underlined resistance is in fact a weekly structure.
The price did not manage to close above, and perfectly respected that, starting to fall after its test.
Such a deeper analysis would completely change our bias from strong bullish (based solely on a daily) to strongly bearish (based on a daily AND weekly)
Remember This
Do not ignore and always check a weekly time frame.
It shows a unique perspective on the market and reveals a lot of hidden elements that you would not notice.
No matter whether you are a scalper, day trader or swing trader,
remember that weekly time frame structures are very impactful and accumulate large trading volumes.
❤️Please, support my work with like, thank you!❤️
I am part of Trade Nation's Influencer program and receive a monthly fee for using their TradingView charts in my analysis.

Learn What Time Frame to Trade. Gold Forex Trading Basics
If you just started trading, you are probably wondering how to choose a trading time frame.
In the today's post, I will go through the common time frames, and explain when to apply them.
1m; 5m, 15m Time Frames
These 4 t.f's are very rapid and are primarily applied by scalpers .
If your goal is to catch quick ebbs and flows within a trading session, that is a perfect selection for you.
30m, 1H Time Frame
These 2 are perfectly suited for day traders.
Executing the analysis and opening the trades on these time frames,
you will be able to catch the moves within a trading day.
4h, Daily Time Frames
These time frames are relatively slow .
They are mostly applied by swing traders, who aim to trade the moves that last from several days to several weeks.
Weekly, Monthly Time Frames
These time frames reveal long-term historical perspective and are mostly used by investors and position traders.
If your goal is to look for buy & hold assets, these time frames will help you to make a reasonable decision.
📝When you are choosing a time frame to trade, consider the following factors :
1️⃣ - Time Availability
How much time daily/weekly are you able to sacrifice on trading?
Remember a simple rule: lower is the time frame, more time it requires for management.
2️⃣ - Risk Tolerance
Smaller time frames usually involve higher risk,
while longer-term time frames are considered to be more conservative and stable.
3️⃣ - Your Trading Goals
If you are planning to benefit from short term price fluctuations you should concentrate your attention on lower time frames,
while investing and long-term capital accumulation suite for higher time frames.
Time frame selection is nuanced and a complex topic. However, I believe that these simple rules and factors will help you to correctly choose the one for you.
❤️Please, support my work with like, thank you!❤️
I am part of Trade Nation's Influencer program and receive a monthly fee for using their TradingView charts in my analysis.

How Forex Brokers Manipulate Your Trading. Real Examples
Your Forex broker could be manipulating your trades right now - and you would not even know it.
They can rig your charts, trap you in losing trades and steal your money.
In this article, I will expose how they do it, I will show you a real example how broker's manipulations can lead to bad trading decisions and significant losses.
What I’m about to show you will change the way you trade forever, and you’ll never look at your trading charts the same way again.
The story started with a trading live stream in my academy with my students.
We spotted a nice setup to trade.
We found a strong 4H support on Silver with a confirmed liquidity grab after its test.
As a confirmation, we identified a cup & handle pattern on an hourly time frame and a breakout of its neckline with a bullish imbalance.
When I got my entry signal, I opened my trading terminal to execute the trade.
And the way I trade is very specific: I use TradingView for chart analysis BUT I have a separate trading terminal for trade execution.
When I opened the same setup in my trading terminal, I saw a completely different picture and a strong bearish signal.
The broker that I use for technical chart analysis is OANDA , while my trading terminal uses ICMarkets quotes.
On the right is the price chart of SILVER with IC.
There we can see a valid breakout and a candle close below the support with its consequent retest.
From a price action perspective, it is a strong signal to sell .
I got a strong feeling that some kind of manipulation is going on here, so I decided to check Silver charts of other brokers.
Only the broker that I used for market analysis on TradingView provided a bullish signal, while other brokers had very bearish charts on Silver.
It looked very suspicious and felt like OANDA broker was inducing me to buy, knowing that the price is going to drop. So I made a decision not to take a trade.
Look what happened then.
After a retest of a broken support, Silver dropped sharply.
Checking the same trading setup on different brokers' charts can help you to avoid the manipulation.
My simple decision to examine more charts helped to avoid a losing trade.
I strictly recommend you doing the same thing before you place a trade.
IF you see a strong deviation of your charts from other brokers, stay alert and vigilant. Probably it is not a good idea to open the trade.
❤️Please, support my work with like, thank you!❤️
I am part of Trade Nation's Influencer program and receive a monthly fee for using their TradingView charts in my analysis.

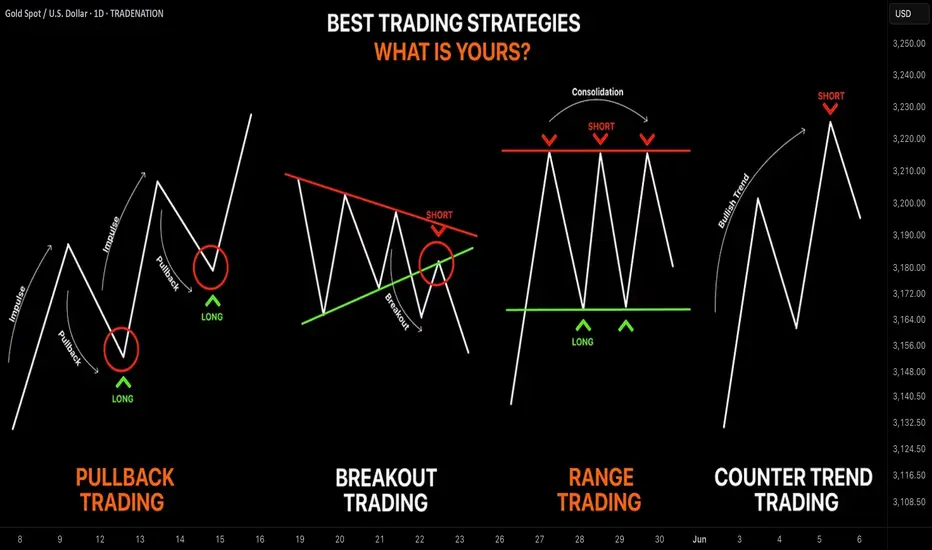
Learn the 4 Best Strategies to Maximize Your Profits in Trading
In the today's article, we will discuss 4 classic yet profitable forex and gold trading strategies.
1️⃣Pullback Trading
Pullback trading is a trend-following strategy where you open the positions after pullbacks.
If the market is trading in a bullish trend, your goal as a pullback trader is to wait for a completion of a bullish impulse and then let the market correct itself. Your entry should be the assumed completion point of a correctional movement. You expect a trend-following movement from there.
In a bearish trend, you wait for a completion of the bearish impulse, let the market retrace, and you look for short-entry after a completion of the retracement leg.
Here is the example of pullback trading.
On the left chart, we see the market that is trading in a bearish trend.
A pullback trader would short the market upon completion of the correctional moves.
On the right chart, I underlined the buy entry points of a pullback trader.
That strategy is considered to be one of the simplest and profitable and appropriate for newbie traders.
2️⃣Breakout Trading
Breakout trading implies buying or selling the breakout of a horizontal structure or a trend line.
If the price breaks a key support, it signifies a strong bearish pressure.
Such a violation will trigger a bearish continuation with a high probability.
Alternatively, a bullish breakout of a key resistance is a sign of strength of the buyers and indicates a highly probable bullish continuation.
Take a look, how the price broke a key daily resistance on a daily time frame. After a breakout, the market retested the broken structure that turned into a support. A strong bullish rally initiated from that.
With the breakout trading, the best entries are always on a retest of a broken structure.
3️⃣Range Trading
Range trading signifies trading the market that is consolidating .
Most of the time, the market consolidates within the horizontal ranges.
The boundaries of the range may provide safe points to buy and sell the market from.
The upper boundary of the range is usually a strong resistance and one may look for shorting opportunities from there,
while the lower boundary of the range is a safe place to buy the market from.
EURCAD pair is trading within a horizontal range on a daily.
The support of the range is a safe zone to buy the market from.
A bullish movement is anticipated to the resistance of the range from there.
Taking into considerations, that the financial instruments may consolidate for days, weeks and even months, range trading may provide substantial gains.
4️⃣Counter Trend Trading
Counter trend trading signifies trading against the trend.
No matter how strong is the trend, the markets always trade in zig-zags. After impulses follow the corrections , and after the corrections follow the impulses.
Counter trend traders looks for a completion of the bullish impulses in a bullish trend to short the market, and for a completion of bearish impulses in a downtrend to buy it.
Here is the example of a counter trend trade.
EURJPY is trading in a bullish trend. However, the last 3 bearish moves initiated from a rising trend line. For a trader, shorting the trend line was a perfect entry to catch a bearish move.
Such trading strategy is considered to be one of the most complicated , because one goes against the crowd and overall sentiment.
With the experience, traders may combine these strategies.
❤️Please, support my work with like, thank you!❤️
I am part of Trade Nation's Influencer program and receive a monthly fee for using their TradingView charts in my analysis.