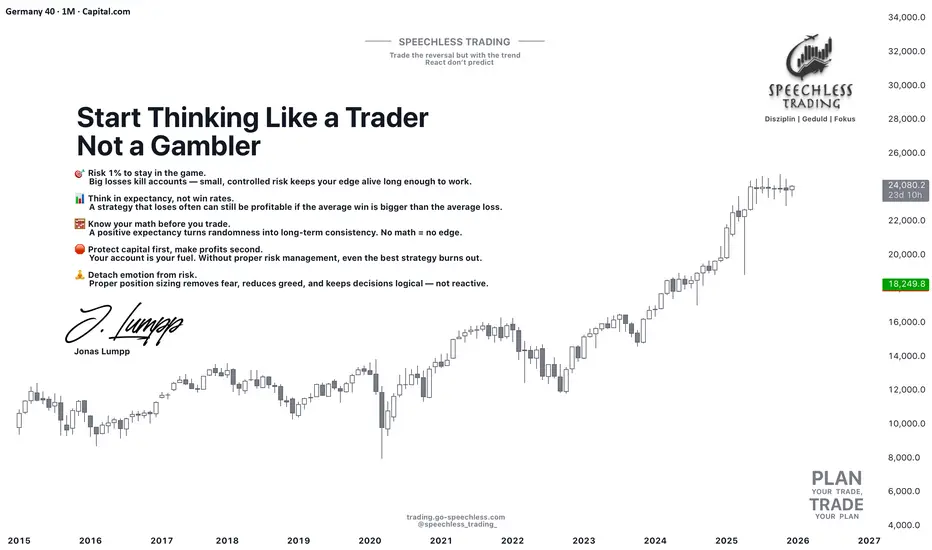
Risk Management Basics 95% of Traders IgnoreWhen traders try to improve their results, they often jump straight to indicators, new setups, or refined entries.
But here’s the uncomfortable truth:
Most traders don’t fail because of their strategy — they fail because they don’t control their risk.
Let’s break down the two fundamentals that separate professionals from the 95%:
1️⃣ The 1% Rule: Your Built-In Survival System
Most beginners risk 5–20% per trade.
Professionals risk a maximum of 1%. Why?
Because the goal isn’t to win every trade — the goal is to stay in the game long enough for your edge to play out.
Risking only 1% means:
✔ A losing streak won’t destroy your account
✔ Your emotions stay stable and rational
✔ Your system has room to unfold statistically
✔ You avoid the #1 account killer: overexposure
Here’s the key mindset shift:
Risk management is not about fear — it’s about increasing your probability of long-term profitability.
2️⃣ Positive Expectancy: The Math Behind Winning Traders
Most traders judge a setup based on the last one or two trades.
Professionals evaluate it based on expectancy — the average profit per trade across a large sample.
Here’s a simple example:
Win rate: 40%
Average win: +60 pips
Average loss: –30 pips
Expectancy =
(0.4 × 60) – (0.6 × 30) = +6 pips per trade
Meaning:
You can lose more trades than you win — and still be profitable.
This is the principle beginners never understand.
A system with positive expectancy + 1% risk per trade becomes extremely powerful.
You stop caring about individual losses and start thinking in probabilities, not emotions.
The Truth Most Traders Miss
➡️ Risk management is the strategy.
➡️ Expectancy matters more than your win rate.
➡️ Risking 1% won’t make you rich fast — but it will prevent you from blowing up.
➡️ Trading becomes easier when you remove the illusion of certainty.
If traders spent more time understanding expectancy and risk instead of chasing “perfect setups,” half of their frustration would disappear overnight.
Thanks for reading — and have a disciplined start to your trading week!
If you found this post valuable, let me know in the comments.
I might create a full series on applied risk management and expectancy modeling.
Jonas Lumpp
Speechless Trading
Disclaimer: This tutorial is for educational purposes only and does not constitute financial advice. Its goal is to help traders develop a professional mindset, improve risk management, and make more structured trading decisions.
Tradingmindset
The Discipline of Doing Nothing“A trader’s strength is not measured by how often they enter…
but by how long they can wait.”
Most traders believe progress happens when they trade.
But in reality, progress often happens in the moments when
you choose not to trade.
Waiting is not passive.
It is an active decision to protect capital.
It is choosing patience over impulse.
It is the discipline that separates a gambler from a trader.
Why Doing Nothing Is Hard
Your brain seeks stimulation, not discipline.
Silence creates discomfort.
Watching price move without you creates doubt.
So you justify a trade:
“It might run…”
“It looks like a breakout…”
“It could work…”
But price doesn’t reward “could.”
Price rewards confirmation and alignment.
What Doing Nothing Actually Means
• You skip trades that don’t fit your plan
• You conserve emotional energy
• You let the market come to your level
• You wait for structure to speak clearly
Every skipped bad trade increases your edge.
Every patient decision sharpens your mindset.
Doing nothing gives you the chance to do something right.
The Invisible Skill
Nobody sees the trades you avoid.
Nobody congratulates you for sitting on your hands.
But those unseen decisions prevent the biggest losses.
The most profitable trades
often start with stillness.
📘 Shared by @ChartIsMirror
Do you respect the moments between setups…
or do you rush to fill them? Comment below.

Gold (XAUUSD) – 1 Dec | Watching Pullback to Key POIs🟡 Gold (XAUUSD) Analysis – 1 December
Hello Disciplined Traders,
Welcome to the Chart Is Mirror Community 👋
Market Context
• Gold continues in strong bullish momentum — the previous H4 high 4245.195 has been taken out, confirming bullish alignment on both H4 and M15 .
• As per our 28 November analysis , the 4154–4149 POI zone reacted beautifully and our long setup achieved all of its targets.
• Now the market is in a healthy pullback phase after taking out the H4 high — perfectly normal within an uptrend.
• As long as M15 remains bullish, we will continue focusing on long setups only.
Key Observations
• The first POI for long setup lies at the 4210–4204 zone .
• If this zone is respected with LTF bullish confirmation , we will execute our long setup accordingly.
• The next strong demand zone is lower at 4179.5–4168.5 .
• If price retraces deeper, we will observe reactions here for a secondary long opportunity.
Execution Plan
• Wait for price to tap 4210–4204 or 4179.5–4168.5 zones.
• Only execute on LTF confirmation — no confirmation, no entry.
• Maintain bullish bias while M15 structure remains intact.
• The market is very volatile — manage your position size and risk accordingly .
A pullback into strength is not fear — it’s opportunity returning home.
📘 Shared by @ChartIsMirror

The Dopamine Trap: Why Traders Overtrade Without Realizing“Most traders aren’t addicted to the market.
They’re addicted to the feeling of being in a trade.”
Every trader says they want consistency…
Yet many still enter trades with no clear setup.
Why?
Because the market activates a psychological loop:
Anticipation → Hope → Stimulus → Relief
Not profit.
Not process.
Just dopamine.
Overtrading isn’t a strategy mistake.
It’s a brain chemistry mistake.
Why Frequent Trading Feels Good
Every click of the buy or sell button releases dopamine.
It gives the illusion of progress.
It convinces you that “activity equals improvement.”
But in reality:
More trades = more randomness
More randomness = more emotional trades
More emotions = more losses
This is why many traders say:
“I do well when I take fewer trades.”
Not because less is magic…
But because clarity increases when noise decreases.
The Hidden Cost
Overtrading causes:
• Impulsive entries
• Improper stop placement
• Revenge trading
• Breaking rules to “stay in the game”
• Anxiety when flat, panic when active
The account damage is visible.
The psychological damage silently compounds.
How to Break the Loop
• Set a maximum number of trades per session.
• Celebrate waiting — not just winning.
• Track emotional triggers in your journal.
• Only execute trades that match your best setups.
• Embrace boredom — it’s a sign of discipline.
When trading becomes boring,
you are finally doing it right.
There’s no dopamine rush in discipline…
but there is freedom.
📘 Shared by @ChartIsMirror
Do you feel the urge to trade just to “stay active”?
Share your reflection — it might help someone break their loop too.

Gold (XAUUSD) – 28 Nov | Key POI Zones in Focus🟡 Gold (XAUUSD) Analysis – 28 November
Hello Disciplined Traders,
Welcome to the Chart Is Mirror Community 👋
Market Context
• Gold continues in strong bullish momentum as the previous higher high 4173.5 has been taken out — confirming a new break of structure.
• As per our 26 Nov analysis , the 4142–4138 POI zone was respected and price delivered a strong rally toward the 4188 target , which was successfully achieved today.
• The M15 structure remains bullish and aligned with the H4 structure .
Key Observations
• A healthy pullback is expected before bullish continuation, as the next upside target is 4244.5 .
• Once price retraces into our POI zones, we will observe carefully to plan the next execution based on confirmation.
• Our first POI for long setup is the 4165–4162 zone .
• If respected with LTF bullish confirmation , we will execute a long setup accordingly.
• If price moves deeper, the next strong buy zone is the 4154–4149 zone .
• This will be our secondary long setup zone — only valid with confirmation.
Execution Plan
• Wait for retracement to 4165–4162 or 4154–4149 .
• No confirmation, no entry — stay aligned with structure.
• Upside continuation target remains 4244.5 .
• The market is very volatile — manage position size and risk accordingly .
Price returns to structure — patience returns the reward.
📘 Shared by @ChartIsMirror

Gold (XAUUSD) – 26 Nov | Watching Key POI Zones🟡 Gold (XAUUSD) Analysis – 26 November
Hello Disciplined Traders,
Welcome to the Chart Is Mirror Community 👋
Market Context
• Gold is showing strong bullish momentum as the previous day high 4159.380 has been taken out.
• The M15 structure remains bullish and aligned with the H4 structure .
• After taking out the previous high, we expect a pullback to key POI zones before continuation to the upside.
Key Observations
• The first POI for a long setup is the 4142–4138 zone .
• If this zone is respected with LTF bullish confirmation , we will plan our long setup accordingly.
• If price pulls deeper, our next strong buy zone is at 4125–4120 .
• Watch this zone closely — if respected with LTF confirmation , we will execute our next long setup.
• To the upside, the next expected target for continuation is 4188 .
Execution Plan
• Observe price behavior at 4142–4138 first — execute long only with confirmation.
• If invalidated, wait for price to reach the 4125–4120 zone before considering longs.
• No confirmation, no entry — stay aligned with structure.
• The market is very volatile — manage position size and risk accordingly .
Let structure guide your patience — the market will return to value.
📘 Shared by @ChartIsMirror

Gold (XAUUSD) – 25 Nov | Watching POI Zones 4094 & 4069🟡 Gold (XAUUSD) Analysis – 25 November
Hello Disciplined Traders,
Welcome to the Chart Is Mirror Community 👋
Market Context
• As per our yesterday’s analysis , the 4042.1–4031.2 demand zone was respected and the long setup played out beautifully.
• We witnessed nearly a 1000-pips upside momentum from this demand zone, resulting in a clear M15 structure shift to bullish .
• Price is now in the pullback phase , and we are patiently waiting for price to return to our POI zones for the next opportunity.
Key Observations
• The first potential POI for long setup is the 4094–4088 zone .
• The next potential POI for long setup lies lower at 4069–4063 .
• If either POI is respected with LTF bullish confirmation , we could see price move toward the 4162 level .
• If neither zone is respected, do not rush — we have a strong demand + HL level at 4049–4039 , which will act as the last buy zone .
• If this zone breaks downward, stay out — we will reassess the structure and plan accordingly.
Execution Plan
• Monitor price reaction at 4094–4088 and 4069–4063 .
• Only execute with LTF confirmation — no confirmation, no entry.
• If both zones fail, wait for reaction at 4049–4039 before considering any setup.
• The market is very volatile — manage position size and risk carefully .
The patient trader waits — the market always comes to structure.
📘 Shared by @ChartIsMirror

Gold (XAUUSD) – 24 Nov | Key Demand Zone 4042–4031 in Focus🟡 Gold (XAUUSD) Analysis – 24 November
Hello Disciplined Traders,
Welcome to the Chart Is Mirror Community 👋
Market Context
• On M15, the major trend remains bearish with Swing High 4107.350 and Swing Low 4022.260 defining the current range.
• However, within this range, the internal structure is forming bullish legs , indicating intraday upside until the major structure shifts again.
• Price is currently trading above the support 4055.129 , attracting retail buyers — but the market may come down to grab sell-side liquidity below this support before resuming its upward momentum.
Key Observations
• Our potential POI for a short-term long setup lies at the 4042.1–4031.2 strong demand zone .
• If the market taps this zone and gives LTF bullish confirmation , we will plan and execute our long setup accordingly.
• If this demand zone fails and price breaks below it, the zone becomes invalid for long setups . In that case, remain still and wait for new structure before participating again.
Execution Plan
• Wait for price to reach the 4042.1–4031.2 demand zone .
• Enter only if LTF confirmation aligns with long continuation.
• No confirmation, no entry — discipline protects precision.
• The market is very volatile — manage position size and risk accordingly .
Let structure invite the trade — not impatience.
📘 Shared by @ChartIsMirror

Supply & Demand vs Support & Resistance — Beyond the Lines“Two traders can look at the same level.
One sees a line.
The other sees the reason behind it.”
Most beginners start with Support & Resistance.
Advanced traders shift into Supply & Demand.
Both seem similar… and in some cases, they are the same.
But the difference lies in why price reacts — not just where.
Let’s break this down clearly.
1. Support & Resistance: The Surface Layer
Support and resistance are simple horizontal reaction levels.
Support
A price level where the market tends to bounce upward.
Resistance
A price level where the market tends to reject downward.
These levels represent crowd behavior.
Retail traders love them — which is why they often turn into liquidity pools.
Strength: easy to spot, widely used
Weakness: easily manipulated because stops cluster there
2. Supply & Demand: The Deeper Institutional Layer
Supply & Demand zones are created by imbalances — strong, one-sided moves driven by institutional orders.
To make the concept crystal clear:
Demand Zone
The last bearish candle (or group of candles) before a strong impulsive move upward, caused by institutional buying and imbalance.
Supply Zone
The last bullish candle (or group of candles) before a strong impulsive move downward, caused by institutional selling and imbalance.
These zones show where institutional buying or selling actually started.
Strength: precise entries, strong reaction zones
Weakness: requires deeper understanding and confirmation
3. How They Connect
This is where most traders get confused.
Support/Resistance = the reaction.
Supply/Demand = the reason for the reaction.
Many times:
A support level is formed because a demand zone sits right below it.
A resistance level is formed because a supply zone sits above it.
So yes — in many cases:
Demand = Support
Supply = Resistance
But only when the reaction was created by institutional imbalance.
4. When They Are NOT the Same
This is the part traders often miss.
❌ Support is NOT demand when:
• Price bounced many times (retail clustering)
• No strong bullish impulse originated there
• Candle structure shows hesitation, not institutional entry
This is just retail support, not a demand zone.
❌ Resistance is NOT supply when:
• Price tapped repeatedly (equal highs)
• No sharp drop came from that level
• The zone lacks displacement or imbalance
This is simply retail resistance, not a supply zone.
5. How to Use Both for Maximum Clarity
Here’s the practical way to combine them:
Use Support/Resistance to understand where retail will react.
Use Supply/Demand to understand where institutions will react.
Best workflow:
• Mark higher timeframe Supply/Demand
• Mark intraday Support/Resistance
• Wait for price to move between these layers
• Look for confirmation (ChoCH/BOS) at the real institutional zone
• Avoid taking trades directly at retail S/R without deeper context
This gives you direction, patience, and precision.
Example (XAUUSD)
Refer to M15 chart above:
Price respected an intraday support level,
but the real reversal happened only after tapping the demand zone below it,
where imbalance and institutional orders existed.
Support showed the bounce.
Demand explained the bounce.
One shows the line.
The other shows the truth behind the line.
📘 Shared by @ChartIsMirror
Do you trade with support and resistance, supply and demand, or a mix of both?
Share what you see — your approach reveals how you read the market’s story.

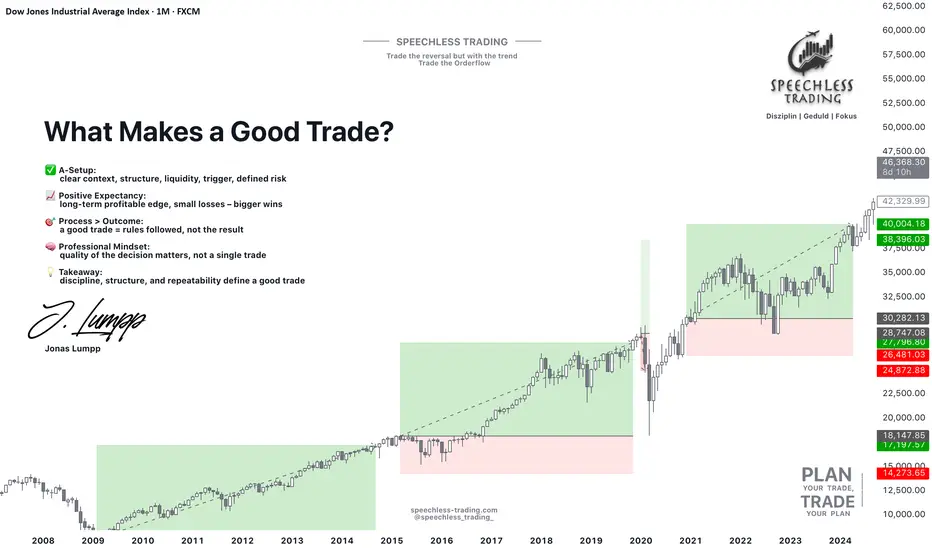
The Anatomy of a Good Trade: Focus on Decisions, Not ResultsLet's find out - what is a good trade?
Most beginners answer: a trade that makes money.
But in professional trading, a good trade has nothing to do with the outcome.
It has everything to do with the quality of the decision.
1️⃣ A good trade starts with an A-Setup:
An A-Setup is not a feeling — it’s a repeatable pattern with structure and logic.
✔ Clear market context
✔ Direction aligned with market structure
✔ Liquidity levels identified
✔ Entry trigger confirmed
✔ Risk defined before the trade
If one of these is missing, it’s no longer an A-Setup — it’s hope.
2️⃣ A good trade has positive expectancy:
Winning one trade means nothing. Winning a sample size of 100 tells you everything.
A positive expectancy means your setup:
loses small - wins bigger - and performs consistently over time
You don’t need to win every trade — you need a system where the average outcome is in your favor.
3️⃣ A good trade follows process, not emotion:
A professional doesn’t judge a trade by profit or loss. They judge it by one question:
“Did I execute my plan without breaking the rules?”
If yes → it was a good trade. Even if it ended in a loss.
Because long-term success comes from repeatable behavior, not from chasing single outcomes.
The Truth:
➡️ A good trade is not defined by green or red.
➡️ A good trade is defined by discipline, structure, and execution.
If beginners understood this idea, half of their frustration would disappear.
Thanks for reading, and have a great start to your trading week!
Let us know in the comments if you found this post valuable - and we might create a full series on applied trading psychology.
Jonas Lumpp
Speechless Trading
Disclaimer: This tutorial is for educational purposes only and does not constitute financial advice. Its goal is to help traders develop a professional mindset, improve risk management, and make more structured trading decisions.
BULLISH ANALYSIS GOLD (SMC)🇺🇸 PROFESSIONAL BREAKDOWN
(XAU/USD – 15M: Accumulation → Manipulation → Rejection → Expansion into 1H FVG)
🔸 1. Accumulation Phase
Price developed a clean range where liquidity was built on both sides.
This is the foundation of the eventual institutional move.
🔸 2. Institutional Manipulation (Fake Out)
A sweep above the consolidation highs confirms the classic liquidity grab.
This fake breakout is a signature SMC behavior before a directional move.
🔸 3. ChoCH + BOS
After the sweep, price prints:
• a Break of Structure, and
• a Change of Character
Clear confirmation of bullish intent.
🔸 4. Rejection Zone
The current pullback shows early signs of a bullish rejection pattern, pointing toward a potential retest of the buy zone.
🔸 5. Buy Setup at 4,068
Your BUY level is placed precisely where support, demand and previous imbalance converge — a high-probability entry zone.
🔸 6. Stop-Loss Updated: 4,036
The 8-pip buffer gives protection from typical gold volatility.
🔸 7. R/R 1:2.8
The new setup maintains a realistic and well-structured risk-to-reward:
• TP1: 4,111
• TP2: 4,150
Both levels align with liquidity pools and the unmitigated 1-hour FVG above.
🔸 8. 1H FVG Mitigation Expected
The unfilled imbalance above is a strong magnet, reinforcing the bullish projection.
🌟 Motivational Message
“Mastery comes from repetition and refinement. Every chart tells a story — and you’re learning to read it with institutional precision. Keep going.” GOOD LUCK TRADERS

Gold (XAUUSD) – 17 Nov | Watching Supply 4171, Demand 3997🟡 Gold (XAUUSD) Analysis – 17 November
Hello Disciplined Traders,
Welcome to the Chart Is Mirror Community 👋
Market Context
• Gold is currently in a clear M15 bearish momentum aligned with the overall H4 market structure .
• We have a confirmed bearish CHoCH followed by a BoS on M15, signaling continuation of the downside trend.
• Price is now trading inside the M15 pullback phase , offering potential intraday opportunities.
Key Observations
• For intraday shorts, the primary sell POI is 4159–4171 .
• If price pulls back to this zone and provides LTF bearish confirmation , we will plan our short setup accordingly.
• Since the trend is bearish, shorts remain the priority, with a fixed 1:5 R:R (40-pips SL : 200-pips TP) .
• For potential long setups, we have a strong demand zone at 3997.5–3965.5 .
• This zone could attract bullish pressure, offering a short-term buy opportunity if respected with LTF bullish confirmation .
• Long setups will follow a fixed 1:3 R:R (40-pips SL : 120-pips TP) , and will remain secondary to the overall downtrend.
Execution Plan
• Prioritize shorts from 4159–4171 with confirmation.
• Consider long setups only from 3997.5–3965.5 and only with clear LTF validation.
• Maintain discipline — no confirmation, no entry .
• The market remains volatile — manage your position size and risk accordingly .
Let structure guide your conviction — patience reveals the cleaner side of the move.
📘 Shared by @ChartIsMirror

Trading Without Expectation: The Real Freedom“The market doesn’t hurt you.
Your expectations do.”
Most traders don’t suffer because of analysis.
They suffer because they secretly expect the market to behave a certain way.
They expect the setup to play perfectly.
They expect the candle to push instantly.
They expect a winning streak after learning something new.
And every expectation creates tension, fear, and emotional noise.
Why Expectations Are Dangerous
An expectation is a silent demand.
You are asking the market to move according to your plan.
But the market has no obligation to fulfill what you imagine.
Expectation turns clarity into pressure.
Pressure turns patience into impulsiveness.
And impulsiveness turns a simple trade into a spiral of mistakes.
Expectation vs. Preparedness
A prepared trader accepts uncertainty.
An expecting trader tries to resist it.
One observes the market.
The other argues with it.
Preparedness feels calm.
Expectation feels heavy.
What Freedom Looks Like in Trading
Freedom is entering a trade without emotional attachment.
Freedom is accepting the stop loss before the entry.
Freedom is seeing a red candle without assuming disaster.
Freedom is letting price move naturally while you remain steady inside.
When there is no expectation, there is no fear.
When there is no fear, you can finally see the chart for what it is.
How to Trade With Less Expectation
• Replace “it should go up” with “I will respond to whatever it does.”
• Replace “this must be a winner” with “this is just one probability.”
• Replace “I hope it hits TP” with “my job ends after execution.”
• Replace wanting certainty with trusting your plan.
Expectations create emotional weight.
Awareness removes it.
You trade better when nothing inside you demands a result.
📘 Shared by @ChartIsMirror
Do you feel attached to the outcome of your trades?
Share your reflection. Many traders silently struggle with this, and awareness is the first release.

When a Few Pips Teach You More Than a Winning TradeYesterday, my stop loss got hit.
Not because my analysis was wrong, but because I mismanaged it.
A few pips, that’s all it took to turn a good setup into a loss.
And honestly, it’s not the first time. It’s happened three times just this week.
At first, I was frustrated. I kept replaying the chart in my head, thinking how easily it could’ve been avoided.
But after sitting with it for a while, I realized something deeper, this wasn’t a technical mistake. It was a mental one.
In trading, the hardest battle isn’t on the screen, it’s in your own head.
You move your SL thinking, “Maybe it just needs more space.”
You ignore your rules because you don’t want to be wrong.
And before you know it, emotion quietly takes the driver’s seat.
Those few pips weren’t a loss. They were a lesson.
A reminder that trading is 80% psychology, 20% execution.
That discipline matters more than being right.
So yes, my SL got hit, again.
But this time, it hit differently.
Because I didn’t just lose a trade.
I gained awareness.
Every stop loss is feedback.
Every mistake is a mirror.
And if you listen closely, the market always teaches what you most need to learn.

The Formula to Make $10000 Daily👋 Hello traders!
If you’re looking for a real way to make $10000 every day from the markets, forget about the so-called magic strategies or secret expert tricks.
The truth is simple: there’s no overnight success formula. But there is a realistic path built on probability, discipline, and time — and that’s what I call The Formula to Make $10000 Daily .
⚙️ Step 1: Build a High-Probability Trading System
📊 This is your foundation.
A good trading system doesn’t have to be complex, but it must have clear rules and consistent logic .
You should always know:
✅ When to enter a trade
✅ When to stay out
✅ And most importantly — why you’re entering
Choose a strategy you can truly master and apply consistently — such as Break & Retest , Supply & Demand , or Market Structure Shift .
Every trade should have a Risk-to-Reward ratio (R:R) of at least 1:2 or higher.
💡 Example:
If you risk $2000 per trade and win just two out of three trades daily, you’ll make $4000.
Increase your lot size gradually and stay consistent — $10000 a day becomes a realistic outcome.
💼 Step 2: Capital Management – The Key to Survival
🧠 You can’t make $10000 daily if you lose $10000 in one bad trade.
Capital management isn’t just about protecting your balance — it’s about protecting your mindset and system.
Follow these golden rules:
💰 Risk only 1–2% per trade
🛑 Always use a stop loss
🎯 Set a clear take-profit target
With a $50,000 account, risking 1% equals $5000.
If your R:R ratio is 1:3, one winning trade a day earns $15000.
That’s not luck — that’s mathematics working in your favor .
🧘♂️ Step 3: Master the Trader’s Mindset
Once you have a solid system and money management plan, the final piece — and the most important — is your psychology .
Most traders don’t fail because their system is bad. They fail because they can’t control themselves .
Keep these principles close:
🚫 Don’t trade when emotions take control
🚫 Don’t revenge trade after losses
🚫 Don’t increase lot size out of greed
🚫 Don’t force yourself to take trades every day
A professional trader doesn’t aim to win every trade — they aim to lose less and lose smart .
🧩 The Real Formula
💎 (High-Probability System + Strict Risk Management + Strong Psychology) × Time = Sustainable Profit
There are no shortcuts.
No magic indicators.
Only you and your discipline .
📖 Real Story
One of my students, Ken, started with a $10,000 account.
He didn’t try to go big — instead, he aimed to earn 1% a day , or $1000.
After six months, by slowly increasing his trade size and staying disciplined, his average daily profit reached $10000 .
He told me:
“I didn’t need to change my system. I just needed to change myself.”
🎯 Final Thoughts
The formula to make $10000 daily doesn’t come from any special indicator, signal, or secret course.
It comes from understanding your system deeply, managing your capital wisely, and staying disciplined every single day .
💬 The market doesn’t reward the fastest traders. It rewards the most patient, consistent, and focused ones.
If you’re on your journey to becoming a professional trader, start today.
🔥 Build your own formula — and practice it every single day until it becomes second nature.

The Illusion of Control: Why You Can’t Force the Market“The moment you try to control the market,
the market reminds you who’s really in control.”
Every trader begins by trying to master the market,
to predict it, bend it, or time it perfectly.
But with every chart and every candle,
the lesson becomes clear: control is an illusion .
The Control Trap
You enter a trade and instantly want the next candle to move your way.
You adjust your stop loss to feel safer.
You exit early just to protect a small profit.
And without noticing, your process turns into emotional management.
The market doesn’t punish mistakes.
It punishes the need to be right .
Why Control Fails
The market isn’t a machine you operate.
It’s a reflection of millions of human decisions.
Your control ends the moment your order is placed.
Once you accept that, trading feels lighter.
You stop managing outcomes and start managing yourself .
Letting Go Isn’t Giving Up
Letting go means realizing your role is to identify structure, define risk, and stay calm inside uncertainty.
You no longer trade to be right; you trade to execute well.
The need to control fades, and discipline takes its place.
Practical Reminder
• Define risk before entry.
• Accept the loss before pressing buy or sell.
• Never move your stop just to feel better.
• Let probability do the work.
You control your plan, not the outcome.
The market owes you nothing.
And that is what keeps it honest.
📘 Shared by @ChartIsMirror
Do you still find yourself trying to control what happens after entry?
Share your reflection below — awareness begins where control ends.

Gold (XAUUSD) – 6 Nov | Watching Supply 4030, Demand 3990 Zone🟡 Gold (XAUUSD) Analysis – 6 November
Hello Disciplined Traders,
Welcome to the Chart Is Mirror Community 👋
Market Context
• Gold continues to show bullish momentum after retesting the 3935–3915.6 demand zone .
• As per our yesterday’s analysis , we expected a retest of the 3942.5–3936.4 POI zone for a long setup, but the market did not retrace that deep.
• Instead, it formed a new support around 3956 and broke structure ( BoS ), confirming the M15 uptrend aligned with the H4 pullback phase .
• During the morning session, the market respected structure and resumed its bullish momentum from the 3967–3963 demand zone .
Key Observations
• There is a supply zone around 4022.5–4030.9 , aligned with the M15 major LH level , where potential rejection can occur.
• If the market respects this zone, we can plan a short setup with LTF confirmation targeting the 3990–3982.5 POI buy zone .
• For bullish continuation, our buying POI zone 3990–3982.5 remains valid — if respected with LTF bullish confirmation , we’ll plan our next long setup accordingly.
• If the market fails to hold this buy zone, it could retrace deeper to 3942.5–3936.4 , which will act as our next buy zone of interest .
Execution Plan
• Observe market reaction around 4022.5–4030.9 supply zone for short opportunities.
• Watch 3990–3982.5 for potential long setups with confirmation.
• If broken, the next key buy zone is 3942.5–3936.4 .
• No confirmation, no entry — let structure lead your participation.
Stillness between impulses defines precision.
📘 Shared by @ChartIsMirror

Gold (XAUUSD) – 3 Nov | Watching M30 Demand Zone (3935–3915.6)🟡 Gold (XAUUSD) Analysis – 3 November
Hello Disciplined Traders,
Welcome to the Chart Is Mirror Community 👋
Market Context
• Gold remains in a downtrend on H4 following a bearish structure shift (CHoCH).
• After this shift, a pullback phase has started as M15 showed a bullish CHoCH followed by a BoS — indicating that M15 is currently uptrend aligned with the H4 pullback.
• As per the present M15 structure, the Higher Low (HL) sits at 3915.6 and the Higher High (HH) at 4046.6 .
Key Observations
• We will look for short-term long opportunities as long as the M15 bullish structure remains intact.
• The M30 demand zone 3935 – 3915.6 is a strong POI and potential reaction zone for intraday long setups.
• A breakout below 3915.6 will confirm a bearish structure shift, invalidating this demand zone for longs.
Execution Plan
• If price retests 3935 – 3915.6 and respects it with LTF bullish confirmation , we will execute our long setup accordingly .
• For selling opportunities, we will monitor the 4132 – 4162 supply zone and only consider shorts on confirmation.
• The market remains volatile — manage your position size and risk accordingly .
Wait for clarity — reaction reveals direction.
📘 Shared by @ChartIsMirror

How to Build Consistency in Volatile MarketsVolatile markets test every trader. Prices move fast, spreads widen, and emotion replaces logic. Consistency comes from structure, not prediction. The traders who last stay calm, trade small, and focus on execution. Their process stays the same, no matter how the market moves.
Control Your Risk
When volatility rises, reduce position size. Risk less per trade to protect your capital.
A trader risking 2% per position during calm markets should drop to 1% or lower when volatility spikes.
The goal is survival. Without capital, you cannot stay consistent long enough to let probabilities play out.
Trade Rules, Not Feelings
Rules keep you consistent when emotions take over.
Define entries, exits, and invalidation levels before each session.
Follow them without hesitation.
Avoid impulsive trades driven by fear or excitement. Each disciplined decision builds long-term consistency.
Limit Screen Time
More screen time rarely means better trading.
Constant watching increases stress and leads to reaction-based trades.
Set trading hours. Step away when the market does not match your plan.
Patience is a trading skill. Consistency grows in quiet moments, not in constant activity.
Use Volatility as Data
Volatility is not a signal. It is a condition.
Use tools like ATR to measure it and adjust your position size.
Wait for clean setups after large moves.
Avoid chasing price. Volatile moves without confirmation create poor entries and fast losses.
Track Behavior, Not P&L
You cannot control outcomes, only execution.
Journal each trade. Note whether you followed your plan.
Measure discipline instead of profit.
When you improve your process, the results follow.
Build a Stable Routine
Consistency begins before the first trade.
Start each session by:
• Reviewing key levels.
• Setting daily loss limits.
• Writing down invalidation points.
When preparation becomes habit, decision-making becomes objective.
Final Thoughts
Consistency is built from repetition, not prediction.
Volatile markets punish reaction and reward structure.
Trade your plan. Manage your size. Stay patient.
Each disciplined session adds to your edge. Over time, stability wins.

Emotional Debt: The Hidden Cost of Revenge Trading“You don’t lose the most money when you lose a trade.
You lose it when you try to get it back.”
Every trader has felt it — that sudden urge to “win it back.”
You take one loss, then another, and before logic can speak,
you’re already in a new position — not to trade, but to heal.
That’s emotional debt —
The invisible weight carried from one mistake into the next.
What Is Emotional Debt?
Just like financial debt, it compounds.
A small emotional reaction today becomes a bigger one tomorrow.
You start trading your frustration, not your system.
You stop managing risk — because ego takes over management.
You don’t see charts anymore. You only see revenge.
How It Builds Up
Ignoring losses instead of reflecting on them
Measuring self-worth by daily profit or loss
Forcing trades to “prove” something to yourself
Confusing emotional recovery with market opportunity
The Interest You Pay
Emotional debt doesn’t just cost money — it costs focus.
It clouds your judgment, narrows your vision,
and pushes you further from the patience that once made you consistent.
Breaking the Cycle
Pause after every loss. Step away.
Write what triggered your next impulse.
Accept that no single trade can fix an emotional imbalance.
Remember: You are not your last trade.
When you clear emotional debt, you stop trading to recover —
and start trading to understand.
Let go of the need to get it back.
The market gives clarity only to those who stop chasing closure.
📘 Shared by @ChartIsMirror
Have you ever caught yourself trading from emotion instead of structure?
Share your thoughts — awareness begins with honesty.

Gold (XAUUSD) – 31 Oct | Key Demand Zones in Focus🟡 Gold (XAUUSD) Analysis – 31 October
Hello Disciplined Traders,
Welcome to the Chart Is Mirror Community 👋
Market Context
• As per our yesterday’s analysis , the market did not retest our POI zone but instead took support from the double bottom / W-pattern key level around 3960 , breaking structure above 4030.5 .
• This move confirms that M15 is now fully uptrend , aligned with the ongoing H4 pullback phase .
Key Observations
• Today, our first buying zone is the 3975.5 – 3960.5 demand zone .
• The next potential demand area lies lower at the 3937.7 – 3930 OB , as marked in yesterday’s analysis.
• There is a high probability that price may sweep liquidity below 3975.5 – 3960.5 before resuming upside momentum toward new highs.
Execution Plan
• If price pulls back to the 3975.5 – 3960.5 zone and respects it with LTF bullish confirmation , we will execute our long setup accordingly.
• If price continues lower, observe how it reacts around the 3937.7 – 3930 OB . Enter only after clear LTF confirmation .
• The market remains volatile — manage your position size and risk accordingly .
Patience before confirmation is the trader’s true stillness.
📘 Shared by @ChartIsMirror

Gold (XAUUSD) – 30 Oct | Key OB (3937.9 – 3930.3) in Focus🟡 Gold (XAUUSD) Analysis – 30 October
Hello Disciplined Traders,
Welcome to the Chart Is Mirror Community 👋
Market Context
• After the recent H4 bearish structure shift , the M15 structure has turned bullish , indicating that H4 is currently in a pullback phase while M15 remains in an active bullish trend.
• Following the M15 bullish CHoCH yesterday, the market pulled back to retest the key demand zone 3916.5 – 3905.7 , which has been respected multiple times.
• Today morning, the Asian session also took support twice from this demand zone , holding the day’s low level and showing internal structure shift to the upside , suggesting that the market is likely aiming to break the 4030.5 previous day high .
Key Observations
• The 3916.5 – 3905.7 demand zone remains a strong intraday base for buyers.
• As per current price action, we will look for a short-term long setup from the buy zone 3937.9 – 3930.3 OB .
• If the market pulls back to this zone and shows LTF bullish confirmation , we will execute our buy setup accordingly.
• A sustained move below 3905.7 will invalidate the current internal bullish structure.
Execution Plan
• Wait for price to retest the 3937.9 – 3930.3 OB zone .
• If the zone is respected and LTF confirmation aligns , we will execute our long setup accordingly .
• If price fails to hold above 3905.7, stand aside and reassess the structure before taking new positions.
• The market remains volatile — manage position size and risk carefully .
Stillness between confirmation and execution defines discipline.
📘 Shared by @ChartIsMirror

BTCUSD — Mind Games at the Range Low Pre Ny Session
🧭 Context
Bitcoin is testing the range low at 112.885, holding just above despite multiple wicks below.
Price hasn’t closed beneath structure — and until the 4H confirms, it’s still a game of perception, not breakdown.
Don’t mistake volatility for intent.
Price can sweep liquidity behind higher-timeframe wicks without flipping bias.
As long as the 4H structure holds, the map remains bullish within the 112.885–116.077 range.
🔹Technical Frame
Range intact: 112.885–116.077
4H close below 112.800 = structural shift
Volume stable, delta neutral — no confirmation of breakdown
Possible liquidity sweep event around macro news
Focus zone: 113.200–114.000 for reactive setups
💡Macro Note
With today’s data on deck, short-term volatility spikes are expected.
Let the reaction confirm direction — not emotion.
This phase is designed to shake conviction, not reward it.
Institutional Logic. Modern Technology. Real Freedom.
