CRYPTOCHECK Throwback - BEST POSTS 2025New Year loading 🥳🥂
Setting up your trading technique and sticking to it
The Dunning Kruger Effect
How to trade Bollinger Bands
How to Dollar-Cost-Average
Spotting reliable Bottom Patterns
These ideas may help you improve your strategy and become a more profitable trader. Happy Trading!
Tradingstrategies

Bitcoin: Is the Market Reaching a Historical Turning Point?📅 Update: October 2025
💡 Format: Educational analysis — not financial advice
Historical Context
Looking back at Bitcoin’s (BTC) price history, a clear pattern emerges: roughly every four years, the market experiences a major correction following a strong bullish cycle.
Key examples include:
2011
2013–2014
2018
2022
Each time, Bitcoin saw a drawdown of –75% to –93% from its previous highs. These deep retracements have historically marked the end of a growth phase and the beginning of a new accumulation cycle.
Current Elliott Wave Structure
According to Elliott Wave analysis, Bitcoin appears to have completed its third and fourth waves, while the fifth wave is currently unfolding.
However, the recent price action suggests that this fifth wave might already be nearing its conclusion.
The price remains within an upward channel, testing the trendline for the fourth time — a technical signal that often indicates weakening bullish momentum and a potential transition to a corrective phase.
Main Scenario: Possible Trend Reversal
For a confirmed shift in trend, Bitcoin would need to break below the channel’s lower boundary.
A typical technical sequence would look like this:
A breakdown below the trendline
A retest of the broken level from below
The beginning of a stronger downward move
This process usually unfolds over months, not days — a slow structural change rather than a sudden reversal.
Potential Downside Range
Based on historical patterns, a post-peak correction could bring Bitcoin into the $40,000–$30,000 range.
This is not a forecast, but rather an educational scenario grounded in the recurring market behavior seen in previous cycles.
Conclusion and Community Discussion
📊 At this stage, Bitcoin’s overall structure remains bullish, but signs of momentum exhaustion are becoming more apparent.
The key factor to watch is how price reacts to the main trendline — whether it holds as support or gives way to a deeper retracement.
❓Which scenario do you find more likely?
Continued growth and new highs
Or a corrective phase toward lower levels?
🗨 Share your thoughts and charts in the comments — let’s discuss it together.
🔔 Follow for more educational breakdowns, and suggest which tickers you’d like to see analyzed next.

ES (SPX, SPY) Analysis, Key Zones, Setups for Tue (Nov 18th)ES experienced a notable decline, concluding the day with a sharp downturn but managed a late-session rebound off a significant demand zone. At this juncture, it appears to be a robust corrective phase within an overarching uptrend, with a reasonable probability of a bounce or a range-bound trading day ahead, barring any unexpected developments from data releases or commentary from Federal Reserve speakers.
Looking ahead to tomorrow, November 18, 2025, the economic calendar is unusually packed for a Tuesday, as various U.S. data are set to be released following delays caused by a government shutdown. Key indicators to watch that could influence ES during the New York session include the import and export price indexes for October at 8:30 AM ET, industrial production and capacity utilization figures also for October at 9:15 AM ET, and the NAHB housing market index for November at 10:00 AM ET.
Additionally, several Federal Reserve officials, including Barr, Waller, Williams, and Kashkari, are scheduled to speak throughout the day. The market is particularly attuned to their insights regarding the likelihood of another rate cut, especially in light of the recently released October FOMC minutes and this week’s jobs report.
Given the abundance of potential market-moving information, I would consider the period from 9:15 to 10:15 AM ET as a critical window for "headline risk" tomorrow.
The recent market decline can largely be attributed to macroeconomic factors:
The S&P 500 cash index ended the day down approximately 0.9%, with the Dow falling around 1.2% and the Nasdaq declining by about 0.8%. This pullback has moved the indices further away from their all-time highs established last month.
The selling pressure was particularly acute among mega-cap technology stocks and the AI sector. Major players such as Nvidia, Apple, Palantir, and AMD faced heavy trading as investors began to question whether the recent surge in tech stocks, driven by AI enthusiasm, had outpaced underlying fundamentals ahead of Nvidia’s earnings release on Wednesday.
Market sentiment was further dampened by a noteworthy prediction from Stifel's chief strategist, who suggested a potential 5% drop in the S&P 500, targeting a level around 6,350 in the coming months. This outlook was based on concerns regarding high valuations and uncertainties surrounding the Fed’s future policy as delayed economic data begins to materialize.
Interestingly, the yield on 10-year Treasuries dipped slightly towards ~4.13% , indicating that today’s selloff was more of a de-risking/profit-taking maneuver specific to equities rather than a reflection of widespread risk aversion typically signaled by bond market movements.
From a technical perspective on the ES futures:
Intraday trading patterns reflected a continuation of last week’s trend of lower highs and lower lows. Prices faltered near the 6,800–6,805 mark during the overnight session before entering a clear downtrend through the morning. The volume accelerated during the late-morning selloff, ultimately reaching a low around the 6,658–6,660 band, which coincides with established daily demand zones.
Following this drop, we observed a pronounced shift in behavior: significant buying volume surged at the lows, leading to a rejected price at that demand zone and a controlled short-covering rally back above 6,690, approaching the 6,700–6,705 range as the day closed. The Nasdaq exhibited a similar trajectory, with a heavy selloff subsequently followed by a recovery.
Structurally, today’s activity reflects:
A strong continuation of downside movement, stemming from last week’s lower-high structure and macro-driven de-risking, culminating in a liquidity flush into a previously identified demand pocket followed by short-covering toward the close.
From a broader perspective, is this the beginning of a genuine downtrend?
On the daily chart, ES remains within a larger uptrend originating from the summer lows. A higher peak above 6,900 was established in late October, with the current pullback representing a decline of approximately 3–4% from that peak. Today's trading reached the 6,650–6,670 support region, which previously served as a vital higher low space, before closing back above it. Daily momentum indicators have rolled over but are beginning to flatten, indicating they are not yet deeply oversold.
In contrast, the shorter-term 4-hour and 1-hour views present a more bearish outlook: a sequence of lower highs has formed, and the retest of prior higher low levels appears to be underway. Short-term moving averages have shifted downward, and 4-hour momentum remains negative, albeit with initial signs of a slight positive divergence compared to new price lows.
In summary:
I interpret this phase as a significant corrective downswing within a larger uptrend rather than the onset of a new bear market. The potential for a more substantial correction exists, particularly if Nvidia’s earnings disappoint or if the run of delayed economic data proves weak. However, the day's trading indicates more of a necessary adjustment rather than the onset of a catastrophic decline, aligning with institutional views that this pullback signifies a "healthy reset" following a robust advance, rather than an indication of a market bubble bursting.
Should ES close below the 6,650 mark on a daily basis and subsequently begin to print lower highs under that level, I would increase my assessment of the risk of a transition into a more enduring downtrend, with targets around the 6,350–6,400 range over the coming weeks, echoing Stifel's projections. For the time being, however, buyers continue to defend this crucial daily support zone.
Key zones to monitor for tomorrow, in the futures market:
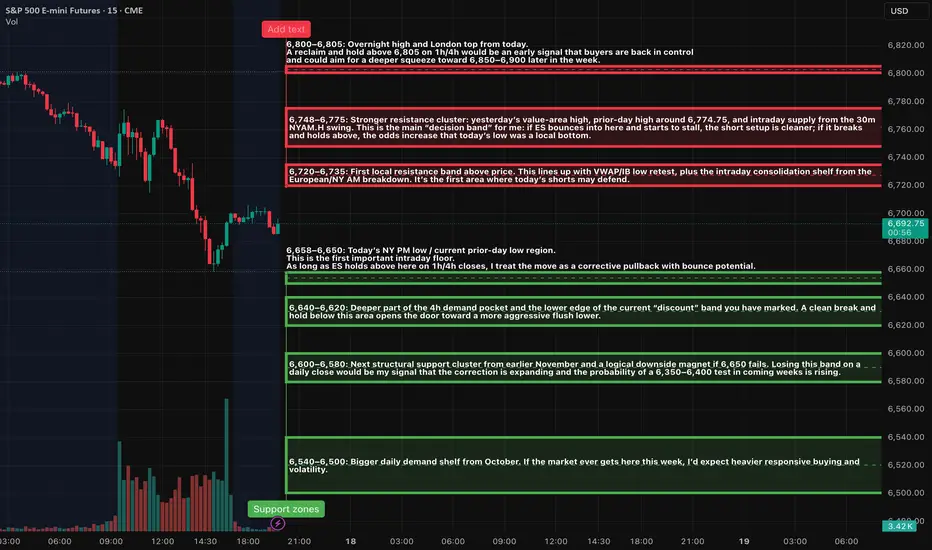
I identify the following support zones:
6,658–6,650: This region marks today’s New York PM low and aligns with the prior day’s low. It serves as the first critical intraday support level. As long as ES maintains closes above this area on 1-hour and 4-hour charts, I consider the movement to be a corrective phase rather than a broader downtrend.
ES (SPX, SPY) Analysis for Week Ahead (Nov 17th - 21st)Market Analysis: ES1 - Navigating Recent Price Action and Upcoming Economic Catalysts
Current Price Context:
The E-mini S&P 500 (ES1) is currently trading in the range of 6,755 to 6,785, following a sharp pullback from the 6,880 to 6,900 peak and a notable rebound off the 6,650 levels. While both the weekly and daily structures exhibit an overarching uptrend characterized by higher highs and higher lows, we are presently experiencing a mid-pullback phase, with prices resting below a newly established supply zone spanning 6,850 to 6,900. Importantly, we remain above the key demand shelf situated around 6,650 to 6,670.
Big Picture Overview: Weekly and Daily Trends
- Weekly Analysis: Over recent months, ES has ascended from approximately 6,000 to the 6,900 level. The past few weeks have seen a new high printed, followed by a red candle signaling a pullback towards mid-range levels. Despite this corrective move, we maintain a buffer above the preceding weekly low near the 6,500 to 6,550 range, affirming the uptrend. The current price action appears more as a corrective pause rather than a definitive peak.
- Daily Perspective: After reaching a new high just shy of the 6,900 mark, the market retreated into the mid-6,600s before bouncing back. Recent daily candles indicate a phase of consolidation within the 6,730 to 6,780 range, characterized by wicks on both ends and diminishing body sizes, alongside reduced volume compared to earlier volatility. Oscillator indicators are retreating from overbought conditions but appear to be stabilizing, suggesting a digestion phase rather than a full-scale momentum breakdown.
Shorter Timeframe Analysis (4-Hour and 1-Hour):
- On the 4-hour chart, a completed downward impulse from around 6,880 to the low 6,650s has been observed, with the price touching the 1.272 Fibonacci extension at approximately 6,653. Additional Fibonacci levels below include 6,597 (1.618) and 6,536 (2.0). The price action around the 1.272 extension has prompted a robust response, featuring significant green candles and increased volume, establishing a base between 6,700 and 6,800.
- On the 1-hour chart, the market exhibits a minor uptrend (from lower lows to higher highs) that has encountered resistance around 6,780. Currently, price action is consolidating near a pivot level of 6,750, leading to the establishment of a balance range between 6,720 and 6,780 as we head into Monday.
Summary: The broader context remains bullish on higher timeframes, with a corrective phase taking root on the medium timeframe, while the short-term landscape indicates balance. This scenario represents a classic "trend pullback parked on key support," with next week's developments likely steering us either back toward the highs or engendering a deeper test of 6,600 or 6,550, contingent on forthcoming economic data and Fed commentary.
Macro and Event Landscape: A Busy Week Ahead
The recent U.S. government shutdown has resulted in a considerable backlog of economic data releases. Market participants will be closely monitoring delayed payroll data, along with other significant indicators such as industrial production and housing metrics that are being released simultaneously. This aggregation of data is anticipated to introduce intraday volatility, particularly during the 8:30 to 10:00 AM ET windows.
Key Economic Indicators to Watch:
- Core Data Releases: In the week of November 17–21, critical releases include:
- Empire State manufacturing index
- Import and export price indices
- Industrial production and capacity utilization figures for October
- Housing starts and building permits scheduled for mid-week
- Additional delayed labor data later in the week as agencies address the backlog.
- FOMC Minutes and Fed Commentary: The release of the FOMC minutes from the late October meeting will communicate the Fed's confidence in the recent improvements in inflation and its openness to potential rate cuts in December. A lineup of Fed speakers is set to take the stage, likely influencing market sentiment and causing price reactions based on their comments.
- Corporate Earnings: Noteworthy earnings reports from Nvidia and major retailers, including Walmart, are on the calendar. Nvidia's performance will be scrutinized as a barometer for the AI segment, while insights from retail giants will provide a glimpse into consumer health as the holiday season approaches. Strong results coupled with optimistic guidance tend to buoy ES, while any disappointments could weigh on index futures, especially given the concentrated leadership from a handful of major tech stocks.
Market Sentiment and Positioning: Rate-cut expectations for December have decreased to about 40%, leaving investors cautious but not overly alarmed. This environment allows for potential relief rallies if data and Fed sentiments tilt favorably, while a series of negative reports may trigger a notable risk-off sentiment.
Conclusion: The upcoming week is poised to be event-driven, lacking a singular "mega" release like CPI but rather presenting a series of medium-to-large catalysts (Fed minutes, late payrolls, industrial production, housing statistics, Nvidia, and Walmart). Traders should be prepared for choppy conditions and liquidity fluctuations around the release times, with clearer directional moves anticipated between these events.
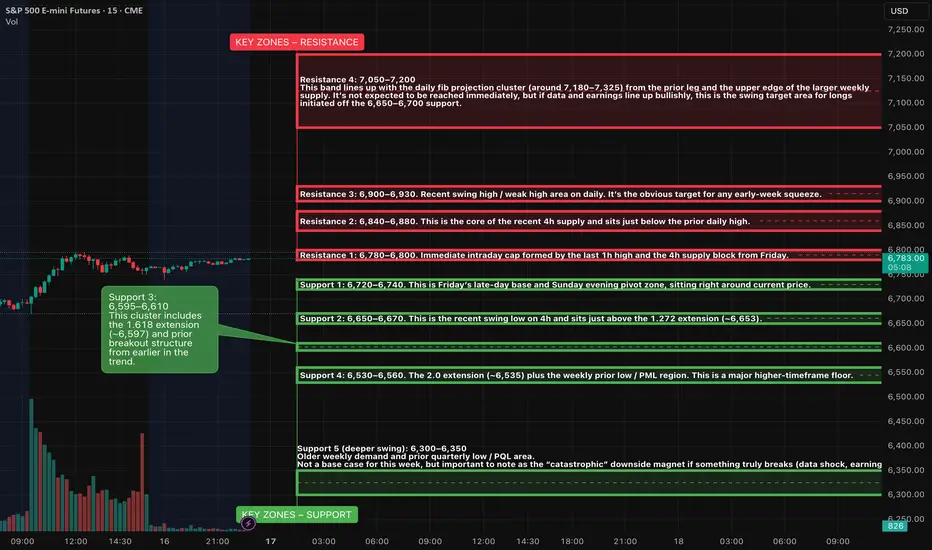
KEY ZONES – RESISTANCE
Resistance 1: 6,780–6,800
Immediate intraday cap formed by the last 1h high and the 4h supply block from Friday. This is the ceiling that has repeatedly turned price in the last session. A 1h or 4h close above 6,800 would confirm that buyers are back in control and likely aim for 6,850+ fairly quickly.
Resistance 2: 6,840–6,880
This is the core of the recent 4h supply and sits just below the prior daily high. It’s where the last strong sell program launched. If price trades into this pocket on light volume and stalls, that favours a lower-high top and another rotation back toward 6,720–6,700. If the tape pushes through decisively, shorts will be forced to cover.
Resistance 3: 6,900–6,930
Recent swing high / weak high area on daily. It’s the obvious target for any early-week squeeze. If this zone gets cleaned out and holds on the retest, the uptrend resumes and we can start talking about higher fib extensions and a run toward the 7,000 handle. A sharp rejection here, especially around Fed minutes or Nvidia earnings, would fit a double-top pattern and could kick off a deeper pullback leg.
Resistance 4: 7,050–7,200
This band lines up with the daily fib projection cluster (around 7,180–7,325) from the prior leg and the upper edge of the larger weekly supply. It’s not expected to be reached immediately, but if data and earnings line up bullishly, this is the swing target area for longs initiated off the 6,650–6,700 support.
KEY ZONES – SUPPORT
Support 1: 6,720–6,740
This is Friday’s late-day base and Sunday evening pivot zone, sitting right around current price. It lines up with the 1h equilibrium where price has been rotating. As long as ES holds above 6,720 on closing basis, buyers are defending the immediate balance and can make another push toward 6,780–6,800.
Support 2: 6,650–6,670
This is the recent swing low on 4h and sits just above the 1.272 extension (~6,653). It’s the first real higher-timeframe demand pocket of this pullback. A clean tag and strong bounce here would look like a classic trend-pullback low forming. A sustained break under 6,650 would suggest the market isn’t done repricing and opens the door to the deeper fibs.
Support 3: 6,595–6,610
This cluster includes the 1.618 extension (~6,597) and prior breakout structure from earlier in the trend. It’s the “deeper but still healthy” retrace area; if ES flushes into this band on bad data then snaps back, it can still preserve the weekly uptrend. Failing here would start to threaten the bullish structure and invite a test toward the prior weekly low.
Support 4: 6,530–6,560
The 2.0 extension (~6,535) plus the weekly prior low / PML region. This is a major higher-timeframe floor. If ES ever gets here this week, the tape is likely under stress, but it also becomes the zone where large buyers usually test the waters for a bigger swing entry. A weekly close below ~6,530 would be the first real warning that the uptrend is morphing into something more corrective or even distributive.
Support 5 (deeper swing): 6,300–6,350
Older weekly demand and prior quarterly low / PQL area. Not a base case for this week, but important to note as the “catastrophic” downside magnet if something truly breaks (data shock, earnings disaster, geopolitical flare-up).
SETUPS – WEEK AHEAD IDEA PACK
1. Trend-pullback continuation long from support
Location: 6,650–6,670 primary, 6,595–6,610 secondary.
Trigger idea:
Look for an overnight or early-week sweep into 6,650–6,670 that quickly rejects (long lower wick on 1h / 4h, strong reclaim back above 6,680). Ideally, this happens outside the heaviest data windows so it’s more order-flow driven than headline noise.
If that fails and price drives into 6,595–6,610 instead, repeat the same logic there: washout, strong reaction, then a reclaim of 6,620–6,630 as confirmation that buyers stepped in.
Upside path from this setup:
First target is the 6,780–6,800 cap. If that gives way, next magnet is 6,840–6,880, then a possible extension run at the 6,900–6,930 recent high area. Later in the week, if macro tailwinds show up, this move can stretch toward 7,000 and, in an optimistic case, into the 7,100+ fib cluster.
Risk management conceptually:
From a swing perspective, the “line in the sand” for this idea is under 6,595. A clean daily close below that level would invalidate the shallow-pullback idea and suggest we are heading toward 6,530–6,560 or lower.
2. Short-term fade from the 6,840–6,880 / 6,900 pocket
Location: 6,840–6,880 first, 6,900–6,930 as extension.
Trigger idea:
If ES trades up into 6,840–6,880 ahead of Fed minutes or the Nvidia/Walmart prints and shows tired price action (long upper wicks on 15m/1h, loss of intraday momentum, failure to hold above 6,860), that area is attractive for a tactical short aiming back toward the 6,780–6,750 pivot.
A more aggressive fade is possible into 6,900–6,930 if the first test breaches 6,880 but immediately stalls at the prior high.
Downside path from this setup:
First magnet is the 6,780–6,800 band, then the balance base at 6,720–6,740. If that gives way on a macro shock, sellers can push for a retest of 6,650–6,670.
Risk management conceptually:
For shorts initiated at 6,840–6,880, a protective stop makes sense above 6,910–6,920. Fades taken into a full sweep of 6,900–6,930 should respect a hard stop above ~6,950; above that, risk of a proper breakout toward 7,000+ increases sharply.
3. Range-trade scalps inside 6,720–6,780
While ES is stuck inside this intraday box, there is room for mean-reversion trades: buying dips into 6,720–6,730 and selling pushes into 6,770–6,780 with tight intraday stops. This is a lower-quality idea compared to the bigger levels, but it’s relevant if Monday and early Tuesday stay choppy while everyone waits for the meat of the calendar mid-week.
ES (SPX, SPY) Analysis, Levels, Setups, for Fri (Nov 14th)
Today’s session revealed a marked risk-off sentiment as the market began to discipline leading sectors, notably large-cap tech, AI, semiconductors, and high-beta growth stocks. This correction coincided with a reassessment of expectations for near-term Federal Reserve easing and an environment defined by unequal economic data in the wake of the record shutdown.
Despite the abrupt decline, the E-mini S&P 500 (ES) remains in a pullback phase within a broader uptrend, still functioning within a weekly premium and supply zone. This movement exhibits characteristics typical of a sharp correction and repositioning rather than the definitive onset of a bear market. Importantly, prices have yet to break below the last significant daily higher-low region, weekly market structure continues to show constructive signs, and the “stress indicators” monitored by institutional investors are elevated but not yet at levels indicative of a crisis.
Dashboard Context
Volatility: Implied volatility surged today, with equity volatility pushing above previously complacent levels, albeit the term structure remains predominantly upward-sloping rather than inverted. This nuance is critical; while funds are investing more for protection and short-term hedges, the volatility landscape does not yet suggest a disorderly liquidation phase.
Options Positioning: The index and overall put/call ratios have transitioned from a state of complacency to caution, reflecting increased demand for hedging. However, levels are not yet extreme enough to signal panic. Skew is elevated, indicating that investors are bidding for downside protection, although it remains within the upper bounds of a normal range. This suggests that while major institutions are leaning into protective strategies and tactical downside plays, the broader market is not universally positioned for a crash.
Breadth: The internal damage today was notable, with decliners outpacing advancers significantly across major exchanges. This shift in breadth oscillators from positive to negative in a single session points to a broad-based distribution rather than a narrow selloff concentrated in a few prominent names. Historically, such internal damage requires several sessions for a market to recover.
Credit and Funding: High-yield spreads have widened modestly from recent lows, and high-yield ETFs have pulled back from their peaks. Nevertheless, there are no current signs of a credit crisis. Spreads remain well within ranges that do not indicate severe stress, and funding markets continue to operate smoothly. Provided that credit conditions stay stable, current equity weakness is likely more reflective of a valuation and positioning reset than systemic risk.
Cross-Asset Risk: The crypto market experienced a sharp selloff, while global equity indices broadly fell. This behavior confirms a classic cross-asset risk-off scenario, as investors reduced exposure to the highest-beta, most speculative areas while simultaneously de-leveraging from U.S. equity leaders. Conversely, traditional defensive stocks and segments of quality value showed relative resilience, a behavior consistent with a managed de-risking rather than an all-encompassing liquidation.
In summary, the dashboard indicates a shift from “overbought complacency” to a higher-volatility, risk-off environment. However, we have yet to enter a full-scale, credit-driven bear market. This context is essential for interpreting today’s decline in the E-mini S&P 500.
Multi-Timeframe Technical Structure (Weekly → Daily → 4H → 1H)
Weekly: The E-mini remains in an upward trajectory, printing higher highs and higher lows. Prices have retreated from a premium zone established at recent highs. The current weekly bar suggests rejection, yet critically, price levels remain comfortably above the last key weekly higher low near the 6,000 mark. Weekly momentum, previously overstretched to the upside, is rolling over, signaling a potential cooling phase – likely a period of consolidation or corrective drift rather than immediate trend failure.
Daily: On the daily chart, the ES has formed a distinct upper range beneath a weak high. Today’s trading produced a significant red candle, indicating a drop from the upper range back toward its center. The prior swing low around 6,620–6,580 remains intact, but the daily oscillator shows mild bearish divergence relative to the last high – a common occurrence in maturing upswings. This situation conveys the message of “bullish but extended, now in corrective mode,” rather than a definitive shift to a pattern of lower highs and lower lows.
4-Hour: The 4-hour structure has entered a short-term downtrend. A lower high was established in the 6,900–6,920 range, leading to an impulsive sell-off toward demand around 6,730–6,700. This selloff exhibited characteristics of liquidation: substantial red candles, minimal counter-rotation, and strong volume. The 4-hour oscillator shows bearish pressure but is beginning to flatten near support, consistent with an early basing attempt after a sharp sell-off, though additional downside remains possible if negative overnight flows persist.
1-Hour: The 1-hour chart portrays today’s price movement as a decisive liquidation wave.
Today's market decline was driven by three converging factors.
First, we saw a mix of valuation adjustments and crowded positioning. Sectors such as AI, semiconductors, and large-cap growth stocks had experienced significant upward momentum. As a result, profit-taking and forced de-leveraging became evident, especially when the largest index components corrected. This simultaneous adjustment made it challenging for the overall index to hold its ground.
Second, the narrative surrounding interest rates and policy has shifted. Recent commentary from the Federal Reserve has adopted a more cautious tone regarding the pace and scale of future interest rate cuts. With inflation remaining above target and some data being impacted by the government shutdown, policymakers appear hesitant to endorse the market's most optimistic expectations for easing. This recalibration towards a "higher for longer" mindset is detrimental to long-duration growth equities and affects the valuations assigned to market leaders.
Third, while the government shutdown has concluded, the subsequent rhythm of the economic calendar has been disrupted. Several critical data releases have been delayed or are now under scrutiny, prompting investors to navigate through somewhat erratic information. In this context, there has been a notable reluctance to take on risk at elevated valuations without clearer data confirmation. Consequently, we are witnessing a trend of de-risking, characterized by a swift rotation from expensive stocks into cash, defensive positions, and protective strategies.
The outcome has been a pronounced selloff, exhibiting broad downside movement and a surge in volatility. Importantly, this occurred without significant turmoil in credit or funding markets, suggesting that we are dealing with a valuation reset rather than a systemic crisis.
Looking ahead, the question arises: Is this the beginning of a more substantial downtrend or merely a temporary flush? From a structural perspective, the market has yet to breach the typical thresholds that signal the onset of a major downtrend. The previous daily higher low remains in place, the weekly uptrend is still intact, and we have not observed the combination of lower highs and lower lows that would signify a broader bearish phase.
Currently, we are witnessing a rejection from a weekly premium/supply zone, with momentum weakening at both daily and weekly levels. Additionally, there is a clear lower high alongside a liquidation move visible on the four-hour chart, which aligns with the expected behavior during the early stages of a significant correction following an extended rally.
As it stands, the prevailing view is that we are experiencing a sharp corrective phase or volatility spike within the upper range of the ongoing uptrend. While the risk of a more profound correction is heightened, particularly if the support range of 6,600 to 6,535 is breached, the current indicators do not yet suggest a completed market top or a fully developed bearish trend.
A genuine trend transition would likely require:
– a decisive break of S3 and a failed retest from below;
– a sustained period of weak breadth rather than a single-day air pocket;
– and, on the macro side, a clear deterioration in credit and funding conditions alongside a persistent inversion of the equity volatility term structure.
At present, those conditions are not fully in place.
Level-KZ Execution Framework for Tomorrow
Asia/London Participation: If overnight trade pushes the ES down into the 6,710–6,680 range and subsequently prints a rejection with a definitive 15-minute close above that zone, consider it a tactical bounce location. This could target a move back toward the 6,770–6,800 region. Given the event risk, participation should be smaller than usual and approached as preparatory rather than primary risk.
PPI Window (08:30–09:15 ET): The initial 15–30 minutes post-PPI release should be regarded as a discovery phase. If the first impulse upward drives the price into R1/R2 but then closes back below 6,780–6,800 with upper wicks and a failure of the 5-minute structure, it sets up a potential short from the underside of the shelf. Targets for this short could be at 6,720 and then 6,680. Conversely, if the initial market reaction results in a drop to S2/S3 that quickly wicks back and closes above that zone on a 15-minute chart, it presents a tactical bounce long toward the 6,740–6,780 area. The decisive 15-minute close after the data release will provide clarity on which side gains control for the session.
NY AM Kill Zone (09:30–11:00 ET): For short positions, the optimal area remains a rejection from 6,780–6,815 after the PPI reaction is digested. A long upper wick and a return close within that range on a 15-minute chart, paired with a failure in the 5-minute attempts to maintain above, supports a short position. Stops should be placed just above the rejection high, with profit targets initially toward 6,720 and subsequently toward 6,680. Conversely, for long opportunities, an ideal scenario involves a constructive reaction from the 6,700–6,660 support band. This would look for a higher low on the 15-minute chart, reclaiming and holding above 6,700, while sellers falter at S1. In this case, stops would belong below the reaction low, targeting 6,770 and 6,810. Standard A-tier protocol applies: anticipate at least 2R to the first target based on a 15-minute-anchored stop, limit attempts per level, and enforce daily risk guardrails.
NY PM Window (13:30–16:00 ET): Should the ES remain constrained between 6,700 and 6,800 by early afternoon, the trade dynamic typically shifts from discovery to mean-reversion. Thus, the afternoon should primarily focus on managing existing positions from the morning rather than initiating new aggressive plays. Fresh entries based on trending strategies should only be considered if there is a clear breakout from the established intraday range, whether below S3 or above R3, accompanied by confirmation.
Big-Picture Takeaway: Fundamentally, today’s decline indicates a reassessment of overly optimistic growth and AI valuations, along with near-term Federal Reserve easing, partly prompted by a complicated post-shutdown data environment. Technically, the ES is retreating from a weekly premium into various support zones while maintaining the core bullish structure. Stress indicators favored by large professional investors—such as volatility, options positioning, breadth, credit, and cross-asset behavior—suggest a serious risk-off event has occurred, but they don't exhibit the persistent stress and credit strain typically seen before a full bear market materializes.
As long as the ES decisively holds above the 6,600–6,535 zone and doesn’t reject that area from below, the higher-probability play in the coming sessions is a volatile corrective range, offering tactical opportunities to sell rallies into resistance and buy deeper, well-defined demand zones—always bearing in mind the heightened volatility and macro event risks on the calendar.

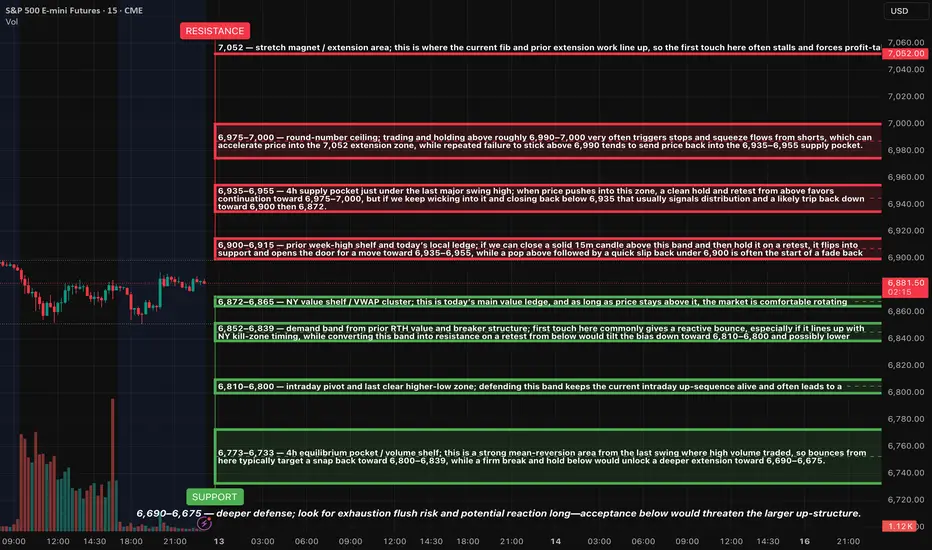
ES (SPX, SPY) Analysis, Levels, Setups for Thu (Nov 13th)HTF Analysis
Daily Chart: The overall trend remains bullish. Currently, the price is situated near the upper range, just below the previous swing high in the 6,960–6,980 zone. The market structure is characterized by a sequence of higher highs and higher lows, indicating that we are experiencing a temporary pause rather than a confirmed peak.
4-Hour Chart: We’re observing a robust V-shaped recovery from the 6,63x–6,66x support zone, with the price now consolidating sideways beneath overhead resistance. The recent 4-hour candles are overlapping within today’s range, suggesting a coiling pattern under resistance rather than a decisive breakout.
15-Minute to 30-Minute Charts: There’s a well-defined range forming. The highs are established around the 6,900–6,915 level, while the lows are consistently found between the 6,872–6,865 shelf, with further lower shelves below. Today's price action has effectively mapped out a framework for potential trading opportunities moving into tomorrow.
MACRO / EVENTS
The government shutdown has officially ended, and normal operations are resuming across agencies. This removes the associated headline risk. The market can now return its focus to the usual macroeconomic drivers: inflation data, the Federal Reserve's policy path, and corporate earnings.
However, there remains some uncertainty regarding the timing and form of upcoming inflation releases due to previous disruptions in data collection. The 8:30 AM ET time slot is still considered a potential source of market volatility. Aside from that, the economic calendar is relatively light, meaning that trading activity around our key levels will likely drive most of the intraday market movements.
SETUPS FOR TOMORROW (LEVEL–KZ STYLE)
Long setup 1 – bounce from 6,872–6,865
Idea: Look for Asia or London to probe into 6,872–6,865 and hold. If we see a clean rejection candle on 15m or 5m and then price reclaims 6,880 and holds above, that sets up a continuation long.
Trigger concept: Reclaim and hold above 6,880 after testing 6,872–6,865.
Risk anchor: Below 6,865, with a little room for noise depending on spread and volatility.
Initial target: 6,900–6,915.
Secondary target: 6,935–6,955.
Stretch idea: If 6,955 holds as new support and order flow remains strong, leave a small runner with eyes on 6,975–7,000.
Long setup 2 – deeper dip buy at 6,852–6,839 or 6,810–6,800
Idea: If 6,872–6,865 fails cleanly but overnight selling is controlled, watch for a fade into 6,852–6,839 or, in a stronger flush, 6,810–6,800. Look for exhaustion and quick reclaim of the upper edge of the band as a signal that buyers are stepping back in.
Trigger concept: Fast rejection wick through the band followed by a close back above the upper edge on 5m–15m.
Risk anchor: Below the lower edge of the chosen band (either under 6,839 or under 6,800).
Targets: First push back to 6,872–6,865, then 6,900–6,915 if momentum improves.
Short setup 1 – fade 6,900–6,915 pop-and-fail
Idea: If price rips into 6,900–6,915 during NY AM without first testing the lower shelves and then quickly fails to hold above 6,900, that is often a spot to fade the top of the range.
Trigger concept: Wick above 6,900–6,915 with a 5m–15m close back below 6,900.
Risk anchor: Above 6,915–6,920.
Initial target: 6,872–6,865.
Extended target: 6,852–6,839 if 6,872 cracks and holds below.
Short setup 2 – rejection from 6,935–6,955
Idea: If we get a clean breakout above 6,900–6,915 but the first test of 6,935–6,955 stalls with heavy wicks and no follow-through, you can look for a tactical fade of that 4h supply pocket.
Trigger concept: Failure to hold above 6,955, with a rotation back under 6,935 on a 15m close.
Risk anchor: Above 6,960–6,965.
Initial target: 6,900–6,915.
Secondary target: 6,872–6,865 if selling expands.
RISK NOTES
Avoid trading in the middle of the 6,872–6,865 and 6,900–6,915 band; let price push into the edges and then trade the reaction.
Size down if price is very slow and overlapping ahead of the 8:30 ET window; there is no need to swing full size into dead tape.
If you see a sudden spike around the data or headline window, focus first on how price behaves at the key shelves 6,872, 6,900, and 6,935 rather than trying to guess the news.
ES (SPX, SPY) Analysis, Levels, Setups for Wed (Nov 12)Price closed near the prior week’s highs after a clear four-hour impulsive leg from last Friday’s low. Momentum appears constructive while the 15-minute swing structure holds higher lows above the New York value shelf.
Setups:
Play A — Acceptance Long: Wait for a 15m full-body close ≥6,900 and a 5m pullback that holds ≥6,892–6,895. Enter on a 1m HL reclaim. Hard SL = 15m trigger-wick low minus 0.25–0.50. TP1 6,915. TP2 6,935. TP3 6,955–6,975. Viability gate: TP1 must be ≥2.0R versus the 15m stop.
Play B — Rejection Fade: If 6,900–6,915 rejects with a 15m close back inside ≤6,889, enter on a 5m re-close lower and a 1m LH. Hard SL = 6,905–6,912 (above rejection wick). TP1 6,872. TP2 6,852. TP3 6,839→6,810 if momentum accelerates.
Bias & Invalidation: Bias is mildly bullish while 6,865–6,872 holds on 15m closes. Bias flips neutral-to-bearish on decisive 15m body-through below 6,839.
Kill-Zones (ET): NY AM 09:30–11:00 for entries. Manage through Lunch. NY PM 13:30–16:00 for follow-through or fades into exhaustion.
News & Events (tomorrow): No CPI risk on the docket. Watch the U.S. 10-Year Note auction around 13:00 ET and headline risk from the OPEC and IEA monthly oil reports in the morning; both can sway rates and index tone.

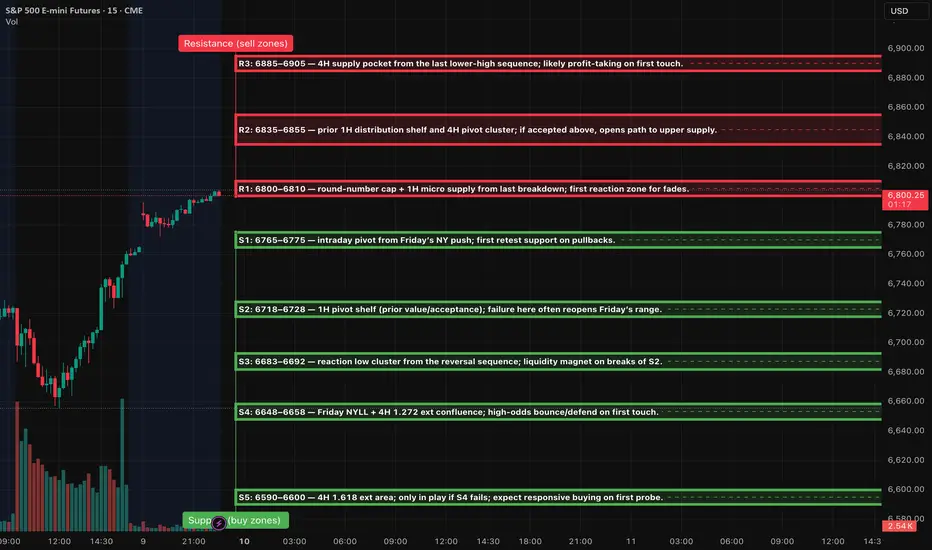
ES (SPX, SPY) Week Ahead Analysis, Levels (Nov 10th - 14th)Context (HTF)
Price action has shown a notable rebound from the 6655 level, currently approaching the 6800 to 6810 range, which is characterized by recent supply identified on the 1-hour and 4-hour charts. Despite the ongoing lower-highs structure observed on the 4-hour timeframe, momentum appears to be shifting positively following Friday’s significant low. Traders should anticipate a period of two-way trading early in the week, likely within the 6650 to 6850 corridor, until mid-week economic data provides clearer direction.
Setups (Level-KZ Protocol 15/5/1)
1) Rejection Fade @ 6800–6810 (Tier-1 if first touch)
15m rejection back inside → 5m re-close below with LH → 1m first pullback fail.
Entry: 6798–6808 on 1m fail. SL: 15m wick-high +0.25–0.50.
TP1: 6768–6775 (S1). TP2: 6723 (S2). Viability gate: TP1 ≥ 2.0R using the 15m-wick stop.
2) Acceptance Continuation > 6810
15m full-body close above → 5m pullback holds 6805–6810 → 1m HL entry.
Entry: 6808–6812. SL: 6794–6798 (15m wick).
TP1: 6838–6848 (R2). TP2: 6885–6905 (R3). No trailing before TP2; at TP1 close ~70%, set runner to BE.
3) Quick-Reclaim Bounce @ 6765–6775 (Tier-2)
Sweep S1 → instant reclaim on 5m → 1m HL.
Entry: 6767–6774. SL: 6756–6759.
TP1: 6798–6810. TP2: 6835–6845.
4) Exhaustion Flush Bounce @ 6648–6658 (Tier-3)
Capitulation wick into S4 → 5m reversal signal → 1m HL.
Entry: 6651–6657. SL: 6639–6642.
TP1: 6686–6692. TP2: 6718–6728.
What can move ES this week (keep risk light around release windows)
• Tue (Nov 11): Veterans Day — equities open, U.S. bond market closed; liquidity can be thinner.
• Thu (Nov 13, 8:30 ET): October CPI.
• Thu (Nov 13, 8:30 ET): Initial jobless claims (weekly).
• Fri (Nov 14, 8:30 ET): October PPI and Advance Retail Sales.
• Fed speakers/boards: See the Fed’s official calendar for any added talks this week.
• Earnings of note: Several large caps report mid-week (e.g., Cisco; Disney). Expect single-name volatility spillover.
Notes for execution: mark the zones on 15m; wait for your 15→5→1 confirmation sequence; enforce the 2.0R viability gate using the 15m wick stop; no partials before TP1; max two tries per level.
STAY IN THE WAVE TO CATCH THE WAVE - THE ART OF RANGE MANAGEMENTHey Everyone,
Here at GVFX, we are currently buying dips. What that means is that we buy on the dips and therefore only concentrate on long positions/buys. As mentioned before, having both sell and buy positions open in your account will affect your psychology and in turn, your trading decisions.
Now a question that typically arises here is why would it still be advisable to buy when the market is pushing down? Firstly, let me assure you that the same algorithms, experience and strategies that we use with our bullish directional bias also gives us the heads up, or down if you will, on when the market is going down. Don't think for a moment that we only know how to analyse a bull market or up trends. We share trade ideas for both Bullish and Bearish moves but choose not to hedge out of choice.
In my experience, it is much safer to get out of a stuck buy position than a stuck sell position. That's not to mention the clean PSYCHOLOGICAL PROFILE that is achieved when trading in just one direction. And although hedging can in theory work, it requires years of experience and in the end, is simply not worth the effort and psychological stress.
Let us look at an example of the current short/mid term trend to further highlight this point. When you have short-term bearish momentum down, we take buys from key supports or MAs which act as dips. Remember that the market does not go up or down in a straight line (with the rare exception of short-lived parabolic moves). So, when the market is going down and hits one of our key levels, a buy from that point will go back up for 30 to 40 pips (this number of pips has been calibrated based on back testing) before resuming back down.
You can think of it like this. The market moves in a zigzag manner. The zig is that part of the leg which is going down to create lower lows (if the downward trend is continuing). The zag is that part of the leg which takes a breather and pushes back up with momentum for our entry and quick pip-take range to create a lower high (if the downward trend is continuing) before heading back down again. We catch the right and safest waves (buys) in and out and surf to success. When price hits a key structural support or stops creating lower lows and lower highs, we then reassess for entries with a wider range of pip capture.
Hope this post helps our followers to understand how we ride waves by staying committed to one direction in order to always fall naturally into the wave rather then chasing a wave!!
GoldViewFX

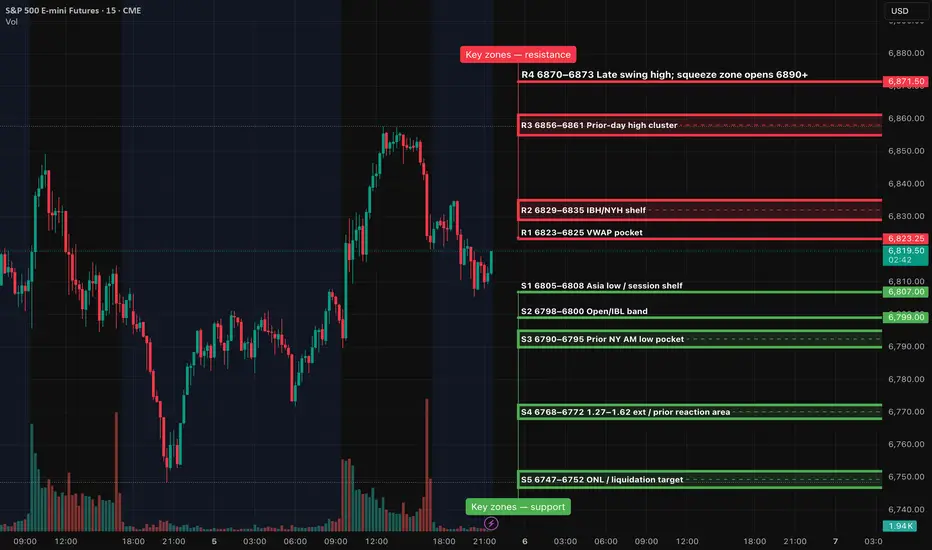
ES (SPX, SPY) Analysis, Key Zones, Setups for Thu (Nov 6)The daily trend has softened following the formation of a lower high. Analysis of the 4-hour chart indicates a bounce that encountered resistance near the 6860–6870 range, subsequently retreating to the 6810 support level. As we look ahead to tomorrow's trading, consider the 6805–6808 range as the key intraday “threshold” while the 6830–6835 zone will serve as the first significant resistance level to watch.
Setups (Level-KZ Protocol 15/5/1; NY KZ 09:30–11:00 & 13:30–16:00 ET)
1. Acceptance long from support
Trigger: 15m holds S1 6805–6808 → 5m reclaim 6823 VWAP → 5m close above 6830.
Entry: 6831–6834 on first 1m HL after the 5m re-close.
SL: 6821 (hard) or 15m trigger-wick −0.25–0.50 pt.
TP1: 6856–6861 (≥2R gate).
TP2: 6870–6873.
TP3: 6890–6895 if squeeze.
Management: No partials before TP1; at TP1 close 70%, set 30% runner to BE; no trail before TP2.
2. Rejection fade short from resistance
Trigger: Pop into 6856–6861, stall, then 5m full-body re-close back below 6856 with 1m LH.
Entry: 6850–6854.
SL: 6864.25 (hard) or 15m wick +0.25–0.50.
TP1: 6830–6832.
TP2: 6823 VWAP.
TP3: 6805–6808.
Note: If 5m re-claims 6861 after entry, exit early; setup invalid.
3. Breakdown continuation short
Trigger: 5m body close below 6805 with retest fail from beneath.
Entry: 6800–6803.
SL: 6810.75 (hard) or 15m wick +0.25–0.50.
TP1: 6790–6795.
TP2: 6768–6772.
TP3: 6747–6752.
Note: If reclaim and 5m closes back above 6808, cancel.
4. Breakout continuation long
Trigger: 5m acceptance above 6861 and hold on retest.
Entry: 6862–6865 on first 1m HL.
SL: 6853.25.
TP1: 6870–6873.
TP2: 6885–6890.
TP3: 6905–6912.
Note: If acceptance fails (5m body back under 6861), flip bias back to fade R3.
Event map for Thursday (ET)
FOMC meeting Day 1 (runs Thu–Fri; Fed is not affected).
EIA Weekly Natural Gas Storage 10:30.
Most BLS/DOL macro releases (e.g., Productivity & Costs, Weekly Jobless Claims) are suspended during the shutdown. Expect fewer 8:30 prints and thinner liquidity until the cash open.
5 Essentials of Trading Success
Trading is the greatest roller coaster you’ll ever ride.
Trading has its thrills, challenges, and endless potential for growth.
But, before you hit “Buy” or “Sell,” it’s crucial to lay down a solid foundation.
Too many traders jump in without preparation, and without knowing the real life variables.
When things go great, they feel normal and you feel in charge.
When things go bad, you feel it’s the end of the world.
So you need to learn to harness each of the 5 essentials to trading success.
Essential #1: Build a Solid Foundation of Knowledge
You wouldn’t drive a car without knowing the rules of the road, right?
Trading is no different.
Before placing your first trade, you’ll need to understand the key concepts and market basics that will serve as your roadmap.
Key areas to cover include:
Market types:
Know the difference between stocks, forex, commodities, and cryptocurrencies. Know which is the best stock screener. Also you need to know which markets will work for you and your trading personality.
Trading terminology:
Terms like “bearish,” “bullish,” “short-selling,” “leverage,” and “margin” might sound like jargon now, but they’ll soon become your everyday vocabulary.
Order types:
Limit orders, market orders, stop-loss, take-profit. Each of these orders serves a specific purpose. Mastering them is essential for making controlled and effective trades.
Essential #2: Select what you want to trade first: The Art of Asset Allocation
Trading is thrilling, but let’s face it.
No one knows what the market will do tomorrow.
That’s why choosing the right mix of assets—and learning the art of asset allocation—is crucial for long-term success.
What does asset allocation mean in practice?
Diversify your portfolio: Don’t put all your eggs in one basket. Invest and trade across different asset classes to spread out risk.
It’s better to trade different portfolios with stocks, Forex, indices and even commodities.
Successful trading isn’t about picking one “winning” asset.
It’s about managing risk and creating a balanced portfolio that can weather market storms.
Diversification is KEY!
Essential #3: Risk Management: Strategies to Protect Your Capital
If you only remember one thing from this article, let it be this:
Risk management is your best friend in trading.
Not only do you learn how to be a trader, but also a risk portfolio manager.
A smart trader doesn’t only think about potential gains—they think about how to protect their capital when things don’t go as planned.
Simple, powerful ways to manage risk include:
Set stop-loss orders: Automatically sell a position when it drops to a certain price to minimize losses.
Use position sizing: Avoid putting too much of your capital into a single trade. Limit each trade to a small percentage of your total funds—usually no more than 0.5%-2%.
Apply the “2% rule”: Never risk more than 2% of your capital on a single trade. This can help prevent one loss from wiping out your progress.
Remember, every trader has losses; it’s part of the game.
But with a solid risk management strategy, those losses won’t be catastrophic.
Essential #4: Charting the Path: Introduction to Technical Analysis
Charts are a trader’s treasure map. Learn to interpret them, and you’ll have insights into market trends, price movements, and potential buy/sell signals. Technical analysis allows traders to make data-driven decisions rather than relying on gut feelings.
Key tools for technical analysis:
Candlestick patterns: These can show trends, reversals, and market sentiment. Patterns like “doji,” “hammer,” and “engulfing” candles can offer powerful insights.
Indicators: Tools like moving averages, RSI (Relative Strength Index), and MACD (Moving Average Convergence Divergence) help you assess price momentum and potential reversal points.
As you might know by now. I like to stick to three indicators: Breakout patterns, 2 Moving Averages and Trend lines.
We need to learn to simplify our strategy because we will be following it over our entire trading career.
Trendlines: Drawn on charts, trendlines reveal price direction and potential breakout or breakdown levels.
Essential #5: The Psychology of Success: Developing a Trader’s Mindset
Trading isn’t just about strategies and technical skills; it’s also a mental game.
Emotions—fear, greed, EGO, frustration — can interfere with sound decision-making.
If you can’t manage your mind, you can’t manage your portfolio.
And that’s why it’s essential to develop a mechanical, professional and calm mind when trading.
Developing a disciplined mindset is what separates successful traders from those who burn out.
Conclusion
Let’s sum up the 5 ESSENTIALS to trading success.
Essential #1: Knowledge First: Understand trading terminology, market types, and order types.
Essential #2: Asset Allocation: Diversify your portfolio based on your risk profile.
Essential #3: Risk Management: Protect your capital with stop-losses, position sizing, and the 2% rule.
Essential #4: Technical Analysis: Learn chart patterns, indicators, and trendlines to guide decisions.
Essential #5: Trader’s Mindset: Control emotions, maintain discipline, and focus on long-term success.
Trading isn’t just a skill—it’s an adventure that rewards preparation, patience, and resilience.
Keep learning, stay focused, and remember: your success is built one trade at a time.
REVEALED: What REAL Trading isWhat is Financial Trading in a nutshell?
For the last 20 years I’ve summed up trading as just ONE BIG AUCTION.
It sounds like a fast-paced, high-risk, Wall Street movie scene with shouting brokers and skyrocketing graphs.
But, here’s the truth:
Trading is the most relaxing thing – when done right!
It’s a lifestyle, a process, and a mindset.
It’s one thing where YOU can take your finances on an exciting adventure — if you do it right.
Whether you’re a complete newbie or a seasoned trader, here is a refresher to dive into what trading really is.
Trading Is More Than Just an Auction of buying or selling…
Let’s clear up one thing first.
For the last 20 years I’ve summed up trading as just ONE BIG AUCTION.
And yes it is one big market of buying and selling – but that’s only part of it.
TRADING is all about solving a puzzle of analyzing probabilities, managing risks, and navigating uncertainty.
Every time you enter a trade (buy or sell), you’re making an educated guess on where the market is LIKELY to go next.
And you’re placing a bet on human behavior — how millions of people around the world (with their emotions, news reactions, and strategies) will affect the price of an asset.
That’s the technical side of trading. Here’s where I want you to integrate trading into your life…
Trading Is A Lifestyle
It’s not just about making money — it’s about integrating trading into your lifestyle.
You need to find the right markets, time, time frame, styles, strategy and approach.
Trading is like hitting the gym; it requires discipline, consistency, and a whole lot of sweat equity.
And just like you don’t get a six-pack or lose weight after ONE workout.
You shouldn’t expect to master trading overnight.
It’s a routine you build day by day.
A typical trading day might include:
Pre-market analysis (Weekly bias):
You need to check what’s happening in the world with other markets with both Asian, American, European and even London session.
You also need to look at the US Economic Calendar to see what news is arising for the week.
Analyse and Execute trades:
Once done the pre analysis, you need to do the actual analysis. See what trades are lining up according to your proven strategy. And if anything looks good to go EXECUTE.
Review and track your trades:
This is where you will reflect on what went right and what went wrong. This is where you’ll track and review your trades that lined up to add to your journal.
The key takeaway: Trading isn’t just what you do; it’s who you become.
Trading Is a Forever Game
When it comes to trading, think long-term.
Like, REALLY long-term. Because trading is a forever game.
Unlike sports with seasons or video games with levels, trading doesn’t end.
The markets will be there tomorrow, next week, and 100 years from now.
And as a trader, your mission is to stay in the game for the long haul.
That means managing your risk, protecting your capital, and always looking to improve your skills.
Trading Is A Business Where YOU Are The Boss
The beauty of trading?
You’re in control.
Trading is a business, and you are the CEO.
You call the shots, decide when to enter and exit trades, and ultimately, you take control of your financial destiny.
Like any business, trading requires:
Planning and strategy:
Risk and reward management:
Tracking performance and improving:
And, just like in any business, you’ll make mistakes.
But those mistakes are not failures; they’re lessons.
You learn from them, adapt, and get better. That’s what makes trading such an empowering journey.
Final Words:
Financial trading is more than a job, a hobby, or a side hustle.
It’s a process-driven approach to decision-making, a lifestyle to live, a forever game to play, and a business where you’re in charge.
If done right, trading can be one of the most rewarding pursuits you’ll ever undertake.
Key Takeaways
Trading is a process: Follow a set strategy, criteria, and rules for success.
Trading is a lifestyle: Incorporate trading into your daily routine and stick with it consistently.
Trading is a forever game: It’s not a one-time event; it’s a lifelong pursuit.
Trading is a business: You’re the CEO — plan your moves, manage your risk, and take charge of your financial destiny.

The Real 3 Thrills of Trading: (Hint: It’s Not When You Think)Trading.
It’s a game.
A challenge.
A journey.
It’s a lifestyle.
And yes having a passion to trade is half the battle won.
But it’s not just about winning.
If you feel thrill when you win a trade. Then you’re enjoying the wrong parts of successful trading.
If you’re in a winning streak and feel thrill – Same story.
Because you know the losses are inevitable.
And you know the drawdown is coming too.
So that’s why you need to enjoy the FULL journey…
And here’s where you should feel the THRILL for trading.
THRILL #1: When you survive the drawdown
Like I said earlier, your next drawdown is coming.
Your BIGGEST drawdown is coming.
So you need to embrace and prepare for these times.
I have gone through more drawdowns than you can imagine.
And yet my portfolio keeps heading to all time highs.
HOW?
Well you need to endure the drawdown.
You need to keep following your rules and strategy.
And when the market environment is more favourable, your portfolio will turn from down to up.
And it will continue to go up until you not only recover – but your portfolio breaks to all time highs.
And when you survive the drawdown – FEEL THRILL!
THRILL #2: Knowing your strategy works (through the good and bad)
The markets are like an ocean.
Waves come and go, the tide shifts, and sometimes there’s a storm.
If you go look at the US Economic Calendar you’ll know the market is about to swivel in ways you can’t even imagine!
The thrill doesn’t come from riding one good wave (winner).
It should come from taking every trade that lines up perfectly with the strategy.
If you followed your rule and criteria to a T – Feel THRILL that you are on the right path to success.
Regardless of whether the trade is a winner or a loser.
See the bigger picture and what it can do for you!
THRILL #3: The Love for the Game and the benefits of trading
Remember I said trading is more than just money.
Trading helps with everything in your life!
It teaches you to be a risk manager.
It teaches you how to toughen your mind.
It teaches you how to be disciplined, consistent.
And it teaches you how you can CREATE your own wealth without depending on a BOSS.
The Challenge, the Mental Toughness, and the Growth
And the thrill?
FINAL WORDS – Celebrate the Right Thrills
The thrill of trading isn’t about the quick wins, the big gains, or riding the market waves.
It’s about resilience. Mastery. Passion. Patience. And growth.
Well fall in love with what trading has offered and taught you, other than the money aspect.
It’s not just about making money; it’s about becoming better. Sharper. Wiser.
Every trade you take is a lesson.
Every loss is a learning opportunity.
And every time you wake up excited to face the market, that’s the thrill of passion.
Because trading isn’t just a job.
It’s a craft.
A skill.
A calling.
If you find yourself waking up early, excited to start your day, knowing full well there’s a challenge waiting for you—you’ve found the thrill.
If you find weekends are not ending early enough because you want to trade – that’s a thrill!
Let’s sum up some reasons to feel THRILL when trading.
THRILL #1: When you survive the drawdown
THRILL #2: Knowing your strategy works (through the good and bad)
THRILL #3: The Love for the Game and the benefits of trading
Do you agree and how has trading changed your life?
POWERFUL Quote about TradingHere is a quote I want you to write down and hold close to your heart.
Trading is a Game of Focus, Sheer Will, and Unstoppable Determination
Trading is not for the faint-hearted.
It’s a game of focus, sheer will, and the kind of determination that doesn’t back down when the market throws punches.
If you’ve been in the trading world long enough, you know it’s not about making a quick buck.
It’s about holding your ground when the waves get rough and staying in the game even when the winds are blowing against you.
Let’s break this down…
Focus Is Your Superpower
To succeed, you need to zero in on your strategy and trust the process, no matter how loud the noise around you gets.
Focus is what separates a good trader from a great one.
It’s about staying laser-focused on your plan.
Do not get rattled when the market throws a curveball.
If you’re jumping from one strategy to another or chasing every shiny new stock, you’re spreading your energy too thin.
And in trading, scattered focus equals scattered results.
How to Strengthen Your Focus:
Create a daily routine and stick to it. Consistency fuels discipline.
Set specific trading goals for each session.
Block out distractions. Social media can wait.
Review your trades regularly to keep your mind sharp.
Sheer Will Gets You Through the Tough Times
Let’s not sugarcoat it:
There will be rough patches.
Trading will test you.
Your willpower will be stretched like a rubber band, and sometimes it might snap.
But those who make it are the ones who refuse to quit.
There’s a misconception that the best traders are the ones who never lose. Wrong.
The best traders are the ones who keep getting back up.
You will lose trades.
It’s part of the game.
But if you have the will to persist, those losses become your greatest teachers.
Ways to Build Your Willpower:
Start small. Set short-term, achievable goals to build momentum.
Learn from each mistake. Losses are part of the learning curve.
Celebrate your progress, even if it’s slow.
Stay connected with other traders to keep motivated.
Determination is Your Guiding Force
What makes a trader stick to their plan even when everything seems to be going wrong?
Determination.
It’s that relentless drive to keep going no matter what.
It’s about having a clear vision of where you’re headed and refusing to let setbacks derail you.
Determination means playing the long game.
It’s easy to get discouraged after a few losses or slow weeks, but successful traders know that big wins take time.
You’ve got to be in it for the long haul.
Strengthening Your Determination:
Write down your trading goals and review them daily.
Make sure you have checked the US Economic calendar with your trading strat.
Remind yourself of why you started trading in the first place.
Don’t let a losing streak shake your confidence—adjust, don’t abandon.
Stay flexible but committed to your strategy.
Conclusion: Keep Grinding, Keep Growing
Trading is a game of focus, sheer will, and relentless determination.
It’s not easy, but if you can master these qualities, you’ll find yourself ahead of the pack.
Success in trading doesn’t come from luck or overnight gains.
It comes from grinding it out, day after day, with a sharp mind and an unbreakable spirit.
Remember, the markets will test you.
They’ll try to break your focus, test your will, and challenge your determination.
But if you stay committed, keep your focus razor-sharp, and push through the tough times, you’ll come out stronger, smarter, and more successful.
So, what are you waiting for?
Tighten up your focus, flex that willpower, and get ready to tackle the markets with unstoppable determination.

ES (SPX, SPY) Analysis, Key Levels, Setups for Fri (Oct 24)ES Two-Way Plan (A++) — Level-KZ 15/5/1
Calendar (ET) — Fri Oct 24:
08:30 CPI (Sept).
09:45 S&P Global flash Manufacturing/Services PMIs.
10:00 Univ. of Michigan Consumer Sentiment (final).
14:00 Federal Reserve Board open meeting.
Expect compression into 08:30 → expansion on release; execute inside NY AM 09:30–11:00 and PM 13:30–16:00 only.
Bias & overnight→NY forecast:
Into CPI, lean range-bound 6,770–6,787. A clean hold above the “weak-high” pocket should squeeze toward the 1.272–1.618 extension band; failure back inside favors a drift to the breakout shelves below. Treat the first post-CPI impulse as discovery; take the next confirmed 15m/5m/1m sequence only.
Setups - Level-KZ execution (15m→5m→1m)
1) Short Rejection Fade @ 6,785–6,787 (W3): 15m rejection closes back inside → 5m re-close below ~6,783.5 with LH → enter first 1m pullback that stalls beneath the shelf.
SL: above the 15m rejection wick ±0.25–0.50.
TP1: 6,776–6,777. TP2: 6,759–6,762. TP3: 6,739–6,744.
2) Long Acceptance Continuation > 6,797 (W3): 15m full-body close above 6,797 → 5m pullback holds/re-closes → 1m HL entry.
SL: below the 15m trigger/pullback wick ±0.25–0.50.
TP1: 6,818 (1.618). TP2: 6,830–6,835.
3) Long Quick-Reclaim Bounce @ 6,759–6,762 (W2): fast flush into the shelf → instant reclaim (15m wick, 5m re-close back above) → 1m HL entry.
SL: below the 15m flush wick ±0.25–0.50.
TP1: 6,776–6,777. TP2: 6,785–6,787.
4) Short Acceptance Breakdown < 6,759 (W2): 15m body-through below 6,759 → 5m confirms → 1m LH entry.
SL: above 15m trigger wick ±0.25–0.50.
TP1: 6,739–6,744. TP2: 6,720–6,725.

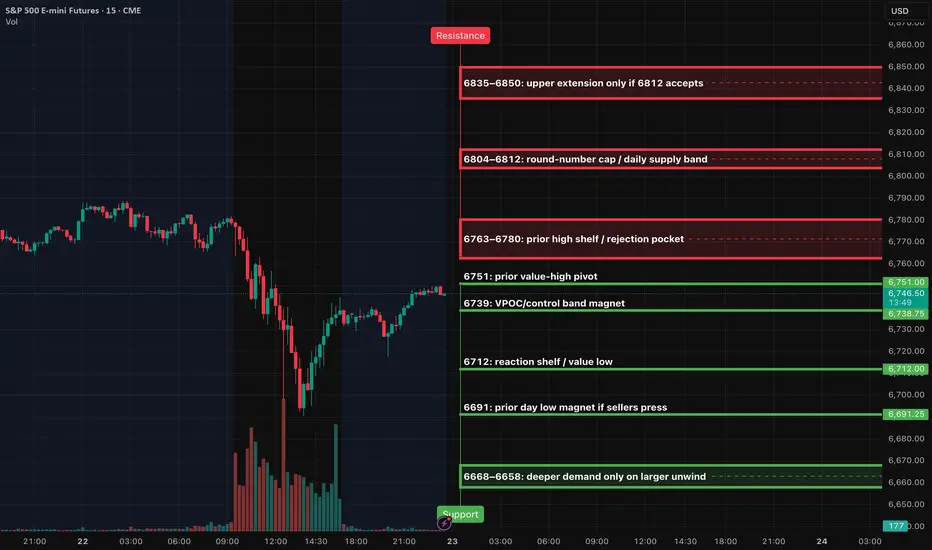
ES (SPX, SPY) Analysis, Key Levels, Setups for Thur (Oct 23)Bias: The market shows a neutral to slightly bullish outlook as long as prices remain above the 6739–6751 control band. A decisive break and sustained trading above 6780 would indicate a shift in momentum to the upside, targeting the levels of 6804 to 6812. Conversely, if we lose support at 6739, we could see a decline toward 6712, with 6691 serving as a key level that may attract selling pressure.
Execution windows: London 02:00–05:00 optional small size. NY AM 09:30–11:00 primary. NY PM 13:30–16:00 primary. Midday is manage-only; avoid initiating.
Setups
Short pop-and-fail at 6773–6780
– Trigger: 15m rejection back inside the band → 5m re-close below ~6773 → first 1m pullback stalls beneath 6773
– Entry: sell the pullback beneath 6773
– Stop: hard SL above the 15m rejection wick by 0.25–0.50
– Targets: TP1 6751, TP2 6739, TP3 6712
– Invalidation: 6780 converts to support on a full-body 15m close
Long breakout continuation above 6780
– Trigger: 15m full-body close beyond 6780 → 5m pullback holds 6777–6780 and re-closes up → 1m higher-low entry
– Entry: buy the hold at 6777–6780
– Stop: hard SL below the 15m trigger wick by 0.25–0.50
– Targets: TP1 6804, TP2 6812, TP3 6835–6850
Long sweep-and-reclaim at 6712 → 6691
– Trigger: quick sweep of 6712 (or flush toward 6691) that immediately reclaims 6712 on 5m → 1m higher-low entry
– Entry: buy first pullback after the reclaim of 6712
– Stop: hard SL below the 15m sweep wick by 0.25–0.50
– Targets: TP1 6739, TP2 6751, TP3 6773–6780
BTCUSD: Waiting for EMA pullback and bullish setupBITSTAMP:BTCUSD Analysis – October 20, 2025
Overview:
After a strong drop to the 103,600 area, BITSTAMP:BTCUSD is showing a solid recovery momentum. Price has broken out of the previous accumulation range and made a pullback, but the early buying opportunity has already passed.
Trading Plan for Today:
Currently, price is approaching a previous key resistance level—a critical zone to watch for reaction.
The main strategy is to wait for a pullback toward the EMA zone and look for a confirmed buy setup based on one of the following patterns:
DD (Double Doji) – indicating a potential pause and reversal.
SB (Second Break) – confirming continuation of the bullish trend.
Alternative Scenario:
If BTC continues to rally strongly without a pullback and breaks above the key level.
It’s better to stay on the sidelines rather than chase the move.
Avoid FOMO when the market doesn’t offer a clear setup — patience usually brings higher-probability entries.
Daniel Miller @ ZuperView

EURUSD LONGI’m placing a limit order on EUR as well. I strongly recommend not just copying trades, but actually understanding the logic of the market. If anyone’s interested, write in the comments — I’m always happy to chat and share experience.

BTCUSD: Sideways market plan🔁 Review of Yesterday’s Plan
Yesterday, we had two breakout trading plans for BITSTAMP:BTCUSD :
IRB (Inside Range Break)
Price moved exactly as projected.
Trade reached a profit of 2R – 2.5R, depending on individual target exits.
RB/ARB (Range Break / Advance Range Break)
Price reached the top boundary of the range and formed a bullish breakout candle,
but was immediately followed by a strong bearish candle pulling back into the range.
This was a clear False Breakout → No trade was taken, waiting instead for the next clear setup.
📈 Market Outlook for Today
BITSTAMP:BTCUSD has now moved back inside the larger range (125,710 – 122,383), showing that the market is currently sideways within a wide range.
The most recent candle closed below the EMA, indicating no clear signal for continuation trades yet.
🧭 Trading Plan for Today
Wait for a new compression setup to form before entering.
If price consolidates and compresses near the upper boundary of the range, prepare to Buy once confirmation appears.
If price continues to drop toward the lower boundary of the range, consider Sell setups, depending on how price reacts to support.
🎯 Summary:
BTC is currently in an accumulation (sideway) phase.
Be patient and wait for a valid breakout setup before taking action — avoid chasing the market and focus on trading only when momentum and confirmation align.
You can refer to my previous analysis here:
Please like and comment below to support our traders. Your reactions motivate us to do more analysis in the future 🙏✨
Daniel Miller @ ZuperView

Macro Recap & Crude Oil Trade SetupNYMEX:CL1! NYMEX:MCL1!
Markets Overview
Markets have largely shrugged off the U.S. government shutdown, with major indices pressing to fresh all-time highs. While the headline optimism continues, it’s important to note that over one million federal employees remain furloughed, leading to delays in key economic data releases and potential short-term distortions in macro readings.
Despite the Atlanta Fed GDPNow model projecting stronger growth, underlying household dynamics suggest stress ahead. Lower-income consumers, already contending with tighter credit and depleted savings, are likely to see further deterioration in spending and sentiment, which may weigh on Q4 consumption trends.
Market Positioning & Flows
While equities appear to be in a new leg of the bull market, positioning data suggests this may not be entirely organic. According to publicly available data many hedge funds continue to under-perform the S&P 500, forcing catch-up buying after missing the April lows. This dynamic may also be contributing to the current momentum-driven equity strength, even as macro headwinds persist.
Metals Performance
Precious metals have been standout performers year-to-date, reflecting declining real yields and persistent inflation hedging flows:
• Gold: +42.46% YTD
• Silver: +56.88% YTD
• Platinum: +71.29% YTD
(Source: Finviz YTD Futures Performance)
This rally underscores a broader rotation toward real assets, consistent with expectations of lower real interest rates and a weaker U.S. dollar trajectory.
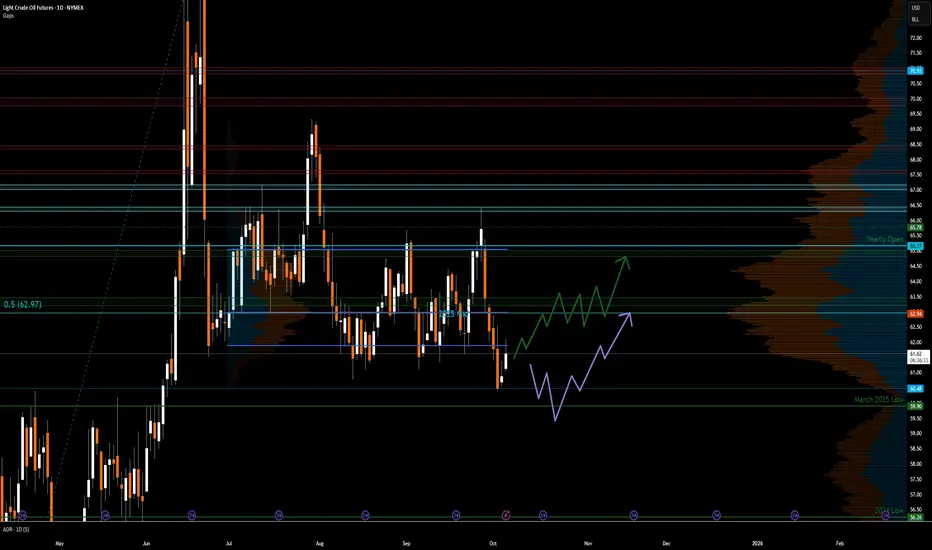
Crude Oil Technical & Trade Setup
Crude oil prices reached $66.42 in September before retracing lower. The recent OPEC+ announcement of additional voluntary cut unwinding at a pace of 137 kbpd for November adds a modest supply-side loosening.
From a technical perspective, price action has bounced at the yearly Volume Profile’s Value Area Low (VAL), a key area of structural support.
Current positioning shows:
• Price trading below Q2 VAL
• Price trading above yearly VAL (yVAL)
Scenario 1: Long on Reclaim of Q2 VAL
• Setup: Watch for crude to confirm acceptance back above the Q2 VAL as a support level.
• Trigger: Long entry on confirmation of acceptance above VAL.
• Target:
o First target: 2025 mid-range at $62.97
o Secondary target: Yearly open at $65.17
Scenario 2 : Long on Deeper Retest
• Setup: Should price reject Q2 VAL, patience is warranted.
• Entry Zone: Wait for price to move lower toward yVAL and March 2025 low confluence.
• Target: Return move toward 2025 mid-range ($62.97).
Despite near-term noise from policy uncertainty and supply adjustments, the broader technical structure favors accumulation on weakness rather than chasing momentum.
Crude remains range-bound but biased for upside stabilization into Q4, supported by resilient demand and disciplined OPEC+ management.
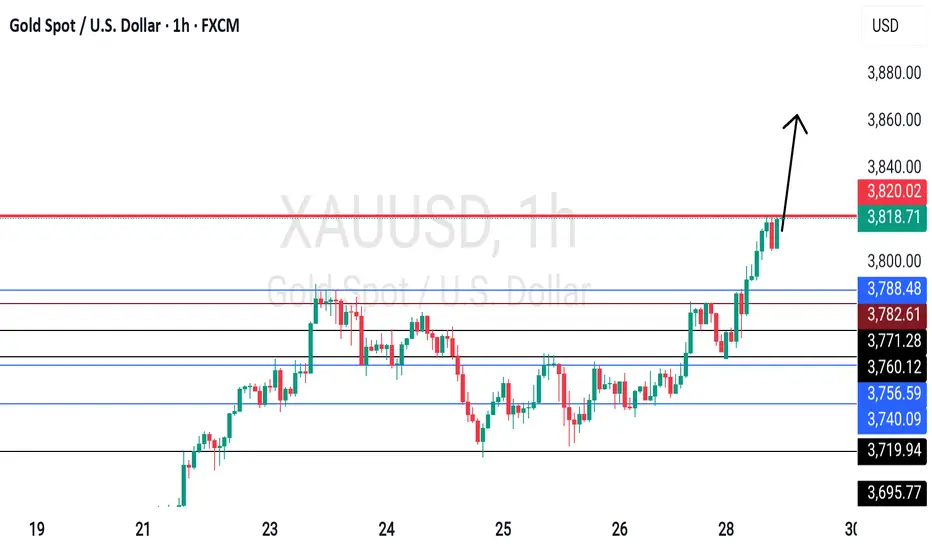
3930 on Mark!!XAUUSD is still intact on bullish rising wedge channel trend towards 3930!!
My stance on XAUUSD?
I'm buying gold on every DIP
✅️ First point of buying will be 3855-3850 area
- if the market drops and for retest on structure support for liquidity sweeps my second buying area will be 3822-3828.
-My target will be 3890 then
In extension 3930!!
- Secondly if H4 candle closes below 3820 then our buying will be compromised & I will wait till the bottom supply zone at 3780 for buying.
Additional TIP: Buy the dips

GOLD Breakout Resistance ? What's next??#GOLD.. market just broke his resistance n sustain above.
Now it should stay above 3822-14
Then further rise expected.
Good luck
Trade wisely
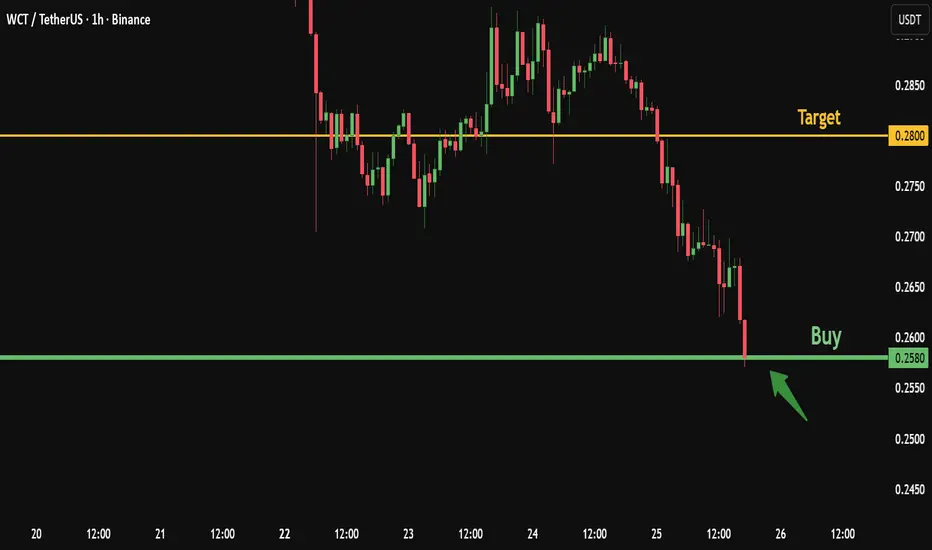
Don’t Miss WCT at Its Lowest Levels – Strong Buy SetupWCT is currently trading near its lowest levels, with the downtrend showing signs of exhaustion and price approaching its historical listing zone.
This creates an attractive risk–reward setup for potential buyers.
Here’s my personal trade plan:
✅ Entry : Buy from current price 0.2580
🎯 Target : 0.2800
The coin is at its bottom range, so if it falls further to 0.2300, I will add another buy position.
And if it reaches the historical listing price at 0.216, that would provide a great long-term buying opportunity once again
Please note:
This is not financial advice – I’m only sharing my personal trades.
Always do your own research before taking action.
👍 Don’t forget to like if you found this useful, and feel free to follow me for more analysis of this kind.
Best of luck 🌹