HYPE - BULLISH SETUP GETTEX:HYPE - Bullish setup 📈
"🚨Team also announced that: GETTEX:HYPE TOKEN COULD SEE SUPPLY REDUCED BY 45%. "
Daily bottom is probably in! 🔥
Key support: $45.20
Lower: $43.30
Upper huge levels:
$48.90 - $50.00 - $50.70 - 52.50$
#HYPE #trading
Tradingstrategies

ETH - 17/09 VS TODAY - MASTERCALL AGAIN! 🏆 #ETH - 17/09 vs Today - Update 🔄
Medium-Term Outlook: “Insane Plays Ahead!” 🔥
🎯Targets hit: $4,000–$4,050 liquidity zone ✔️
Current TA:
🔸Price rejected sharply; H4 looks bearish, RSI is highly oversold.
🔸Short-term: potential for a relief bounce!
🔸Possible scenario: Retest of the $4,300–$4,350 former support ahead? 📈
Weekly Structure
🔹Bias stays bullish long-term.
🔹BUT: Structure reminds me a lot of #BTC right before its massive run!
🔹Are we about to see an extra dip towards $3,700- $3,800 before the next moon mission? (Check chart for context!)📉💣
Short-Term Bias
🔹Price action = Neutral & tricky.
🔹Bulls want a reclaim above $3,780 to keep the upper hand.
🔹Big risk: If we break below $3,780 → likely drop to $3,300–$3,200 range!⚠️
Local Support Zones
$4,070
$4,000
💡Summary
Still bullish medium/long term, but a further correction is very possible before liftoff!
Bulls need to hold $3,780. Below = trouble…Above = game still on for ATH attempts later. 📉

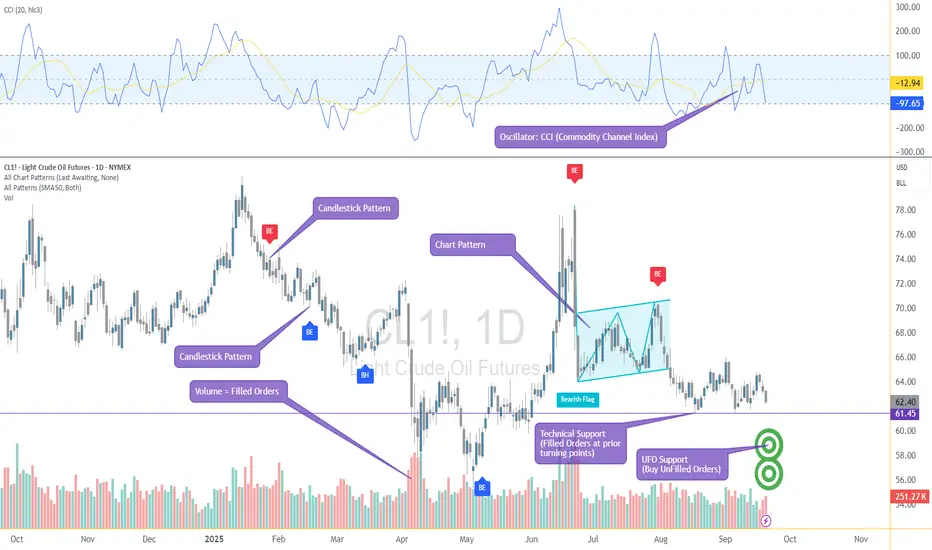
From Mystery to Mastery: Trading EssentialsIntroduction: Why Trading Feels Like a Mystery
For many aspiring traders, the markets appear as a mysterious puzzle. Prices move in ways that often feel unpredictable, charts are filled with patterns that seem random, and every strategy seems to work until it suddenly doesn’t. This is why trading so often feels like a mystery: it blends human behavior, technical structures, and ever-changing fundamentals into one living system.
Yet behind this apparent chaos lies a logic. The transition from “mystery” to “mastery” begins with understanding that trading is not about luck, but about process. Just like a scientist doesn’t guess but instead forms hypotheses, tests them, and adapts based on evidence, traders must approach the markets with discipline and structure.
The main chart attached to this article is a good reminder of this. At first glance, it looks overwhelming: candlestick patterns, oscillators, UFO support and resistance zones, chart patterns, and volume data all layered together. But this is not noise — it’s information. Each element highlights a different aspect of market behavior. Once organized and understood, these tools stop being mysterious and instead form the building blocks of trading mastery.
In this guide, we’ll walk step by step through those building blocks: how markets are structured, how trades are placed, how risk is managed, how strategies are built, and how psychology influences decisions. Along the way, you’ll see how these concepts work together to transform confusion into clarity.
Trading mastery doesn’t come overnight, but the journey begins the moment you stop chasing secrets and start building a foundation.
Understanding Market Types
Not all markets are created equal. Before diving into strategies and chart patterns, it’s important to recognize that different markets operate under different structures. Knowing where you are trading — and how those markets function — can be the difference between confidence and confusion.
Exchange-Traded Markets
In exchange-traded markets such as futures or stocks, trading takes place on centralized venues. This means:
Prices are transparent, with all participants seeing the same quotes.
Orders are matched through a regulated system, reducing counterparty risk.
Clearing houses guarantee performance, ensuring that when one side of a trade wins, the other side’s obligations are met.
This structure creates confidence, especially for leveraged instruments like futures, where position sizes can be large.
Over-the-Counter (OTC) Markets
On the other side, forex, crypto and many other derivatives are traded over-the-counter. Here, there is no central exchange — trades are made directly between counterparties, such as banks or brokers.
Prices can vary slightly between providers.
Liquidity depends on the institution offering quotes.
Most importantly, there is counterparty risk — the risk that the other side may not honor the trade.
While OTC markets can be deep and liquid, traders must understand the role of intermediaries and the risk they take on when choosing where and how to trade.
Why It Matters
The choice between exchange-traded and OTC instruments affects everything: order execution, spreads, transparency, and even regulation. Many professional traders favor exchange-traded products for their transparency and reliability, but OTC instruments remain popular due to accessibility and flexibility.
Whether you’re trading futures on the CME or currency pairs in the OTC forex market, the principle is the same: know your marketplace, because the rules of engagement define the playing field.
The Mechanics of Trading
Once you know where you’re trading, the next step is to understand how trades are actually placed. This is where many traders feel overwhelmed, because order types, execution rules, and volume data can feel like a different language. But when broken down, the mechanics are straightforward.
Order Types: The Building Blocks
Market Orders: Execute immediately at the best available price. Fast, but can suffer from slippage in fast-moving markets.
Limit Orders: Specify the maximum price you’re willing to pay (buy) or the minimum price you’ll accept (sell). Excellent for controlling entry, but no guarantee of execution.
Stop Orders: Triggered once price hits a certain level, commonly used for stop-losses.
Bracket Orders: Automating Discipline
One of the most practical tools for managing trades is the bracket order. Instead of placing just an entry, a bracket order automatically places:
A stop-loss order to protect against adverse moves.
A profit-taking order to lock in gains.
This setup creates a “bracket” around your trade, ensuring that risk and reward are defined from the start. It shifts the trader’s mindset from hoping to managing.
Volume: The Footprint of Filled Orders
Volume is more than a number at the bottom of a chart — it’s the record of filled orders. When volume surges at a level, it shows where buyers and sellers agreed most aggressively. Combined with support/resistance or UFO zones, volume can help traders identify which levels have strong institutional participation.
Execution Matters
Bid-ask spreads, commissions, and slippage all impact profitability. A great strategy can still fail if execution costs aren’t managed. This is why many traders choose more liquid products — deeper liquidity usually means tighter spreads and better fills.
By mastering these mechanics — order types, brackets, and the interpretation of volume — traders gain the ability to structure trades with precision instead of improvisation.
Core Principles of Risk Management
If there’s one constant across all successful traders, it’s this: they never risk their capital blindly. Strategies may differ, but the principles of risk management remain universal.
Risk per Trade
A common practice is to limit the risk of any single trade to a small percentage of account equity — often 1–2%. This way, even a series of losing trades doesn’t wipe out a portfolio.
Position Sizing
Lot size isn’t just about ambition, it’s about survival. Position sizing must reflect both account size and volatility of the instrument. A highly volatile product like crude oil futures demands a smaller size than a low-volatility product like Treasury futures, even if account equity is the same.
Reward-to-Risk Ratio
Before placing a trade, the potential reward should always justify the risk. For example, risking 10 points to potentially gain 30 points gives a 3:1 reward-to-risk ratio — meaning you can be wrong more often than right and still be profitable over time.
Support, Resistance, and UFO Levels
Risk management becomes more effective when combined with technical reference points. Placing a stop-loss just beyond a well-defined support or UFO zone means that if price breaks through, the trade’s premise is invalidated. Similarly, setting profit targets near resistance zones allows traders to exit before momentum fades.
The Role of Discipline
None of these rules matter without discipline. A trader who moves stops, doubles down on losers, or takes oversized positions is effectively abandoning their edge. Consistency, not heroics, is what keeps traders in the game long enough to grow.
By embedding risk management into every decision, traders shift from chasing trades to controlling outcomes. The market will always be uncertain, but risk can always be defined.
Strategy Frameworks
While no strategy works all the time, every successful trader operates within a clear framework. Frameworks provide structure, helping traders decide when to engage the market and how to manage trades once they’re in.
Trend Following
The principle: “the trend is your friend.”
Traders look for higher highs and higher lows in an uptrend, or lower highs and lower lows in a downtrend.
Tools: moving averages, trendlines, and momentum indicators help confirm direction.
Mean Reversion
The assumption: prices oscillate around a fair value.
Traders buy when prices move far below the average and sell when they stretch too far above.
Tools: oscillators such as RSI or Stochastics signal overbought/oversold conditions.
Breakout Trading
Focused on capturing momentum when price escapes a range.
Traders identify consolidation zones and look for strong volume when price breaks through support or resistance.
Tools: candlestick patterns and chart patterns (triangles, rectangles, flags) often mark breakout points.
Volatility-Based Trading
Markets don’t just move in one direction; they expand and contract in volatility cycles.
Volatility traders adapt position size, target levels, and even strategy choice depending on whether the market is calm or turbulent.
The Role of Confirmation
Frameworks are strengthened when multiple signals align. For example, a breakout confirmed by a candlestick pattern and supported by volume at a UFO level carries more weight than a breakout without confirmation.
By mastering these strategy families, traders learn to adapt their approach to different environments instead of forcing one method onto all markets. Flexibility, not rigidity, is the true hallmark of mastery.
The Trader’s Process as a Scientific Method
The biggest difference between beginners and professionals isn’t the chart setup — it’s the process. Professionals treat trading as a science, not a game.
Step 1: Form a Hypothesis
Just like in a laboratory, the process begins with a hypothesis: “If price breaks above resistance with strong volume, then it is likely to continue higher.” The hypothesis defines what you expect and under what conditions.
Step 2: Backtest the Hypothesis
Rather than risking money immediately, traders test their idea against historical data. The goal is not to prove the trade will work, but to see whether it has worked consistently under similar conditions.
Step 3: Evaluate the Results
If backtesting shows inconsistent outcomes, the hypothesis must be refined or discarded. If results show positive expectancy, the door opens to the next stage.
Step 4: Trade Small in Live Markets
Even a strong backtest doesn’t guarantee success in the real world. Execution, slippage, and emotions enter the equation. That’s why traders begin with small size in live markets to confirm that performance holds.
Step 5: Scale with Confidence
Only after a hypothesis survives both backtesting and live verification should size be increased. At this point, the trader has turned uncertainty into structured probability.
By approaching the market scientifically, traders avoid gambling behavior. Instead of chasing tips or hunches, they move step by step, letting data guide decisions. In doing so, they transform trading from a mysterious guessing game into a disciplined pursuit of mastery.
Psychology of Trading
Even with a solid strategy and risk plan, many traders still struggle — not because the markets beat them, but because their own minds do. Psychology is the silent force that shapes every decision.
Discipline Over Impulse
The temptation to move stops, double down on losing trades, or exit winners too early is constant. Without discipline, even the best strategy collapses under emotional pressure.
Common Biases
• Recency bias: believing that the most recent outcome will repeat.
• Loss aversion: cutting winners short while letting losers run.
• Confirmation bias: searching for information that supports your existing view while ignoring evidence against it.
Emotional Cycles
Traders often swing between fear and greed. Fear prevents them from taking valid setups, while greed leads them to overtrade or oversize. Recognizing these emotional cycles is the first step toward controlling them.
The Power of Journaling
A trading journal records not just trades, but also the reasoning and emotions behind them. Over time, it becomes a mirror that reveals behavioral patterns — both strengths and weaknesses.
Process > Outcome
Individual trade results are largely random. Mastery comes from focusing on process rather than outcome. Following the plan consistently matters more than whether the next trade wins or loses.
By understanding and managing psychology, traders learn to master themselves first. The market will always test patience and conviction, but the disciplined trader treats emotions as signals to be managed — not instructions to follow.
Case Study: A Structured Trade Example
Theory becomes powerful only when applied in practice. Let’s walk through a trade example using the below chart attached.
Setup
The market is trending upward, confirmed by the SMA ribbon sloping higher.
A UFO support zone aligns with prior price action, creating a logical area where buyers may step in again.
A candlestick wick test into this zone provides confirmation of demand.
Trade Execution
Entry: Buy as price approaches the UFO support zone, in line with the trend.
Bracket Order: Place both a stop-loss and a profit target automatically.
(Stop-Loss: Positioned just below the UFO support zone. If price breaks down through support, the trade’s hypothesis is invalid. | Target: Set at the next UFO resistance zone, where prior sellers are likely to appear.)
Risk-to-Reward Balance
The defined stop ensures risk is limited.
The distance from entry to target is significantly larger than the distance to the stop, producing a favorable reward-to-risk ratio.
Outcome
Whether this trade wins or loses is secondary — the key is that it was structured with:
A clear hypothesis.
A defined entry, stop, and target.
Proper use of a bracket order.
Risk contained and reward potential aligned.
This is what separates structured trading from guesswork. Each element — support, UFOs, moving averages, and volume — works together as part of a process-driven decision, not an emotional one.
Conclusion: From Mystery to Mastery
For many traders, the markets begin as a blur of candles and numbers — a mystery that seems impossible to solve. But as we’ve seen, mastery doesn’t come from secrets or shortcuts. It comes from building a structured foundation:
Knowing the market type you’re trading, and whether it’s exchange-traded or over-the-counter.
Understanding the mechanics of orders, brackets, and volume.
Applying risk management principles that define losses before they happen.
Using strategy frameworks to adapt to different conditions.
Following a scientific process that tests hypotheses before scaling them.
Developing the psychological discipline to follow the plan consistently.
Executing trades with structure, where every element — entry, stop, and target — has a reason.
Trading mastery is not about eliminating uncertainty. It’s about controlling what you can — risk, process, discipline — and allowing the market to do the rest. The mystery never fully disappears, but with the right approach, it becomes manageable, even profitable.
This article is the first step in our From Mystery to Mastery series. Here, we’ve laid the foundation for trading in general. From here, we’ll expand into the specialized worlds of futures and options, where leverage, diversification, and advanced strategies open even more doors.
The journey continues — but the path is now clearer.
From Mystery to Mastery trilogy:
When studying markets, it’s important to remember that chart data can sometimes be delayed. This article has presented concepts that apply broadly to trading across all asset classes. The chart examples used here happen to feature products listed on exchanges operated by the CME Group. For traders who follow these products closely and wish to access real-time market data, TradingView offers a dedicated CME Group real-time data plan: www.tradingview.com . This is particularly relevant for shorter-term traders who depend on precise price action, though longer-term participants may find delayed data sufficient for their needs.
General Disclaimer:
The trade ideas presented herein are solely for illustrative purposes forming a part of a case study intended to demonstrate key principles in risk management within the context of the specific market scenarios discussed. These ideas are not to be interpreted as investment recommendations or financial advice. They do not endorse or promote any specific trading strategies, financial products, or services. The information provided is based on data believed to be reliable; however, its accuracy or completeness cannot be guaranteed. Trading in financial markets involves risks, including the potential loss of principal. Each individual should conduct their own research and consult with professional financial advisors before making any investment decisions. The author or publisher of this content bears no responsibility for any actions taken based on the information provided or for any resultant financial or other losses.
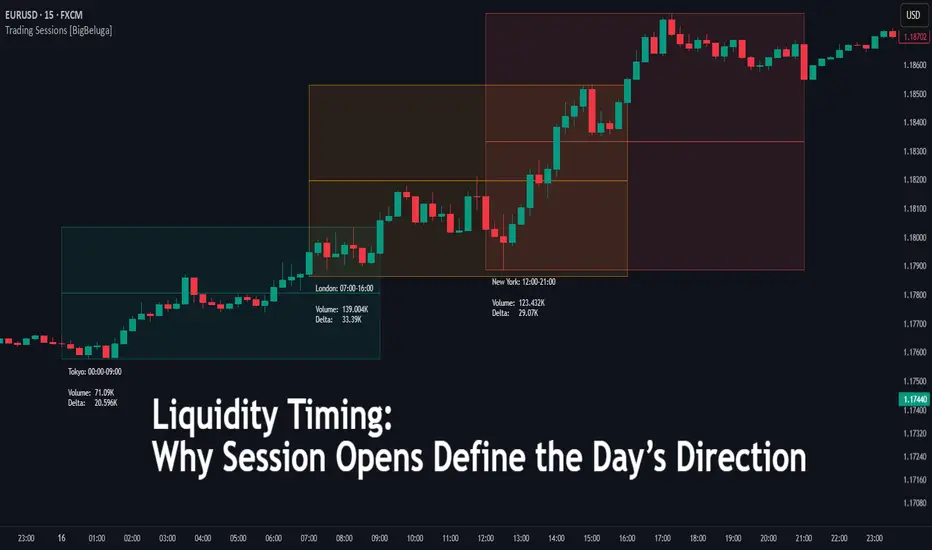
Liquidity Timing: Why Session Opens Define the Day’s Direction🔵 Liquidity Timing: Why Session Opens Define the Day’s Direction
Difficulty: 🐳🐳🐳 - - - (Intermediate)
This article is for traders who want to understand how global trading sessions (Asia, London, and New York) shape intraday price movement. By mastering liquidity timing, you’ll recognize why markets often fake out early, expand mid-session, and reverse into the close.
🔵 INTRODUCTION
Markets aren’t random — they move in rhythm with global liquidity. Every major financial center adds a wave of participation, creating unique price behaviors. The session opens often act as turning points or launchpads for the day’s main move.
Understanding session timing gives traders an edge in anticipating liquidity grabs, expansions, and reversals.
🔵 THE THREE MAJOR SESSIONS
1️⃣ Asia (Tokyo/Sydney) — The Range Builder
Time: ~00:00–06:00 UTC
Behavior: Usually low volatility, narrow ranges, liquidity buildup.
Purpose: Market sets the “box” for later sessions.
2️⃣ London — The Expansion Session
Time: ~07:00–11:00 UTC
Behavior: Breakouts from Asia range, liquidity sweeps, trend acceleration.
Purpose: Injects strong volume and defines directional bias.
3️⃣ New York — The Reversal or Continuation
Time: ~12:00–20:00 UTC
Behavior: Overlaps with London, fuels volatility. Often causes midday reversals or extensions.
Purpose: Final liquidity grab before daily close.
🔵 WHY SESSION OPENS MATTER
Liquidity Injection: New orders flood in as banks and institutions open.
Fakeouts & Sweeps: Early moves often target stops before real direction sets.
Timing = Structure: Knowing when a session opens helps anticipate when ranges will break or reverse.
Key Point: Most intraday trends don’t start randomly — they’re triggered by session transitions.
🔵 HOW TO TRADE SESSION TIMING
1️⃣ Define the Asian Range
Mark the high and low of the Asia session. This acts as a “box” for London to break.
2️⃣ Watch London Open
Often creates a fakeout → sweeps Asia highs/lows → then drives in real direction.
3️⃣ Prepare for New York Shift
NY may extend London’s move or reverse it, depending on liquidity needs.
4️⃣ End-of-Day Fade
Late in the session, volatility fades and price consolidates.
🔵 EXAMPLE SCENARIO
Asia builds a tight 80-pip range overnight.
London open sweeps the range low, trapping sellers.
Price reverses and rallies strongly, breaking above the range high.
New York continues the bullish move but reverses in the afternoon.
🔵 USING THE NEW YORK OPENING RANGE
Of all global sessions, the New York open often brings the sharpest volatility. A simple but powerful way to trade it is by defining the opening range — the high and low formed between 12:00–12:30 UTC on 15min timeframe.
Once this 30-minute range is set, it becomes a reference box for the rest of the session:
A breakout above the range → signals bullish continuation potential
A breakout below the range → signals bearish continuation potential
Failed breakouts often lead to strong reversals back inside the range
This method works because the first 30 minutes of New York capture a flood of institutional orders, setting the tone for the session. Traders can then watch how price interacts with this “opening box” to identify liquidity grabs and true directional moves.
🔵 ADVANCED TIPS
Align session plays with higher timeframe bias (daily trend).
Avoid chasing the first breakout — wait for confirmation after the sweep.
Use liquidity pools (Asia highs/lows) as magnets.
Track economic calendar: London/NY opens often coincide with news.
🔵 CONCLUSION
Liquidity isn’t constant — it comes in waves with each global session. By mapping Asia, London, and New York opens, traders can anticipate where traps, expansions, and reversals are most likely to form.
Session timing turns randomness into structure. If you learn to respect the clock, you’ll stop chasing moves — and start trading with the rhythm of the market.
XAUUSD Delivered Excellent profits I booked profits on buying orders during Wednesday’s session, entering around 3652 and exiting near 3680+, while my medium-term longs hit the 3700 target on FOMC.
Later, I placed a sell limit at 3666, which got triggered and closed automatically at 3636 TP today's London session
Going forward, I’ll continue buying dips from my key entry zones as long as Gold holds above the 3620–3630 support area on the fractal.

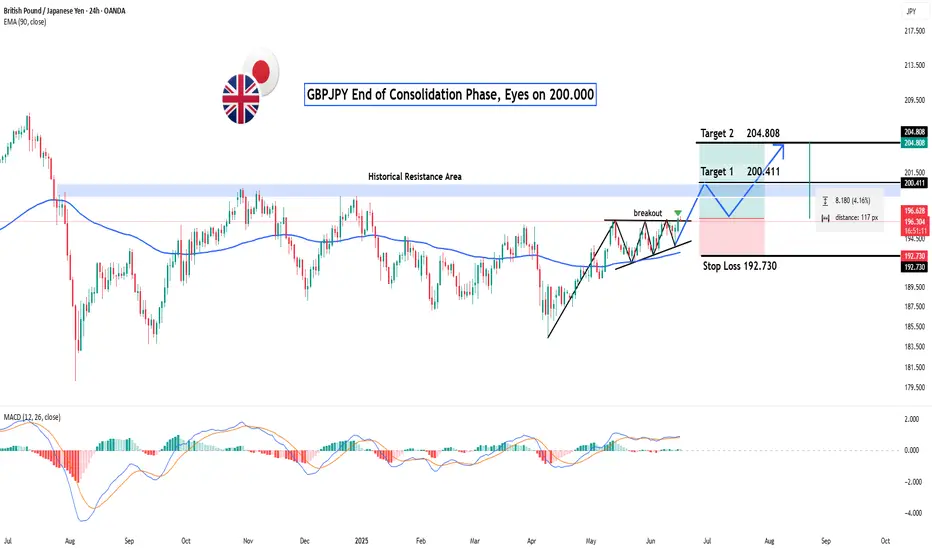
GBPJPY: End of Consolidation Phase, Eyes on 200.000?Hey Realistic Traders!
Could this be the beginning of a major bullish wave ?
Let’s Break It Down..
On the daily timeframe, GBPJPY has formed a Symmetrical Triangle Pattern, followed by a bullish breakout, a classic technical signal that typically marks the end of a consolidation phase and the start of a new bullish trend. This move is further confirmed by the appearance of a strong bullish candlestick, reflecting a surge in buying momentum.
Supporting this bullish scenario, the MACD indicator has also formed a bullish crossover, where the MACD line crosses above the signal line. This crossover is widely regarded as a momentum shift from bearish to bullish, strengthening the case for continued upward movement.
Given these technical signals, the price is likely to advance toward the first target at 200.411, with a potential extension to 204.808.
This bullish outlook remains valid as long as the price holds above the key stop-loss level at 192.730.
Support the channel by engaging with the content, using the rocket button, and sharing your opinions in the comments below.
Disclaimer: "Please note that this analysis is solely for educational purposes and should not be considered a recommendation to take a long or short position on OANDA:GBPJPY ".
XAUUSD – Should You Trade the Red News… or Let Them Trade You?🌟The Hype vs. Reality
Every NFP Friday, you’ll see traders flexing $500 to $5,000+ in one candle. But the reality check is that 95% of accounts are blown by spreads, slippage, and whipsaws. News looks like payday, but for the market, it is traps set both ways for retail traders.
Why Gold + Red USD News Is a Dangerous Mix
XAUUSD reacts harder with momentum than any other Forex pair.
NFP, CPI, FOMC, PCE — every release creates engineered chaos.
Typical pattern: spike one way → sweep stops the other way → only then trend resumes.
Example: NFP prints strong, Gold dumps 100+ pips, sweeps liquidity, then rips 350+ pips bullish with the higher-timeframe trend.
🔴When You Shouldn’t Touch It (Beginners)
If you’re still learning structure, stay flat. Here’s why:
• Spreads jump 10–30 pips instantly.
• SLs get slipped or completely ignored.
• First candle is pure manipulation.
• Emotions peak → revenge trades blow the account.
• Best move: study the reaction and wait for a safe entry, repeat 100+ times X more.
🟢When You Can Consider It (Intermediate Traders)
For traders with experience 1year+ on the charts:
• Before the release: position based on HTF bias, with very small risk.
• After the release: wait for the spike to finish, then take structure-backed entries.
Example: CPI prints weak, Gold jumps → once the fakeout clears and structure reclaims, you trade the continuation.
🖊️The Truth Nobody Likes to Hear
News doesn’t set the trend; instead, it likes to accelerate the story the chart was already telling.
If you can’t trade Gold without news, why would you dream of lying to yourself that an Unemployment Claims would make you instantly rich?
Final Note:
Trading XAUUSD over Red folder news is not proving catching the spikes. You need to show by sitting put, waiting for the dust to settle, that you trade with structure.
Beginners should grab some popcorn, watch it, and study for a while.
Intermediate traders can use news as fuel.
But if you dive in blind, remember XAUUSD doesn’t care about your trade; most likely, it will feed on it while you are volunteering as liquidity.
If this article helped you today and brought you more clarity:
Drop a 🚀 and follow us✅ for more trading ideas and trading psychology. Thank you.

WLD - BEARISH SETUPMIL:WLD - Bearish setup 📉
Following my yesterday's view, the bearish correction is likely not over! 📉
Lower big demand zone: 1.520 - 1.500$ 🎯

16,532% growth in just 37 days! A new star in the crypto world!MYX Finance: Understanding the Crypto Star that Soared Over 16,000%
BINANCE:MYXUSDT.P
In the fast-moving world of cryptocurrency, stories of incredible growth often capture our imagination. Recently, a new star has emerged, producing a truly breathtaking performance. In just 37 days, the MYX Finance token (MYX) experienced a massive price increase of over 16,532%. This kind of rocket launch makes everyone ask two simple questions: What is MYX Finance, and how did its price rise so fast?
This article is your guide to understanding this exciting story. We will explore what makes MYX Finance a special project in the crypto universe. Then, we will uncover the key reasons behind its recent, explosive growth. This is more than just a story about numbers; it’s a look into the innovation and energy that makes the world of digital finance so exciting.
Part 1: What is MYX Finance? A Simple Guide to a Powerful Platform
Before we understand why MYX grew so quickly, we first need to understand what it is. At its heart, MYX Finance is a new type of crypto trading platform designed to be powerful, fair, and easy for everyone to use.
The Best of Both Worlds - A New Kind of Crypto Market
In the crypto world, there are two main types of exchanges. Centralized Exchanges (CEXs) are like big, traditional banks. They are fast and easy to use, but you have to trust them to hold your money safely. Decentralized Exchanges (DEXs) are more like a community market. You always control your own money, but they can sometimes be slower and more complicated. MYX Finance combines the best features of both. It’s a DEX, so you always have control of your funds, but it’s designed to be as fast and easy to use as a CEX. It achieves this with a special system that lets trades happen instantly and with a feature they call “zero-slippage.”
The Magic of "Zero-Slippage"
Imagine you want to buy a crypto token for $100. On many platforms, by the time your order is processed, the price might have changed to $101. That $1 difference is called “slippage.” It can be very frustrating for traders. MYX Finance has built a system to eliminate this problem. Zero-slippage means the price you see when you click “buy” is the exact price you get. This makes trading fairer and more predictable, which is a huge advantage for traders of all levels.
More Than Just Trading - A Multi-Chain Universe
MYX isn't limited to just one blockchain. It operates across more than 20 different chains, including popular ones like Ethereum, BNB Chain, and Arbitrum. This means users can trade a huge variety of tokens without having to move their funds between different platforms, saving them time and money.
Part 2: The Perfect Storm: Four Key Catalysts for Explosive Growth
A 16,532% price increase doesn't happen by accident. It takes a “perfect storm” of technology, timing, and community excitement. For MYX, four main factors came together to create this incredible rally.
Excitement for the V2 Upgrade: Before the big price surge, there was a lot of positive talk in the MYX community about a major platform upgrade called V2. This upgrade promised to make the platform even better, faster, and more powerful, creating a strong foundation of positive sentiment.
Major Exchange Listings: The real explosion began when the MYX token was listed on popular crypto exchanges, especially Binance Alpha. This exposed the token to millions of new potential buyers. In one day, trading volume surged by 710%, reaching an incredible $354 million.
The "Short Squeeze": When the price started to rise, traders who had bet against the token (shorting) were forced to buy it back to cover their losses. This created a rapid buying frenzy called a “short squeeze.” In just 24 hours, over $14.6 million in these short positions were liquidated, adding even more fuel to the rally.
Industry Recognition and Awards: Finally, MYX Finance received a prestigious award from the BNB Chain, one of the biggest networks in crypto. They were named a “Volume Powerhouse,” which served as a powerful endorsement and gave new buyers more confidence in the project.
Part 3: The Big Picture - Why This Matters for Crypto
The story of MYX Finance is more than just one token's success; it shows us some important trends in the world of crypto.
Innovation Matters: MYX didn’t just grow because of hype; it grew because it offers a genuinely better trading experience with its zero-slippage feature. This shows that projects with strong technology can achieve incredible things.
The Power of Community: The excitement and support from the MYX community played a huge role in its success. In decentralized finance, a strong community is one of the most valuable assets a project can have.
Opportunity Still Exists: It reminds us that the crypto market is still young and full of opportunity. While there are always risks, stories like MYX show that there is still massive potential for growth.
Conclusion: Your Adventure in the World of Crypto Begins
The incredible 37-day journey of MYX Finance is a powerful reminder of how dynamic and exciting the world of digital assets can be. We’ve seen how a project with innovative technology, strong community support, and perfect timing can capture the attention of the entire market.
As the Founder of ForecastCity and the creator of the 4CastMachine AI software, my mission is to help traders navigate this exciting market with better tools and insights. The crypto world is full of opportunities like this one. To stay ahead of the curve and continue your learning journey, make sure to follow me! Let's explore the future of finance together.
Frequently Asked Questions (FAQs)
What is MYX Finance in one sentence?
MYX Finance is a next-generation decentralized exchange (DEX) that makes trading crypto fast, easy, and fair by offering zero-slippage trading across more than 20 different blockchains.
What does "zero-slippage" mean?
It means the price you see when you make a trade is the exact price you get, which prevents you from losing money to sudden price changes during your transaction.
Why did the MYX token price rise so fast?
It was a "perfect storm" of four main factors: excitement for a major platform upgrade (V2), listings on popular exchanges like Binance, a "short squeeze" that forced rapid buying, and a prestigious award from BNB Chain that boosted confidence.
Is MYX a good investment?
Like all cryptocurrencies, MYX is a high-risk, high-reward asset. Its recent performance has been incredible, but the market is very volatile. This article is for educational purposes, and you should always do your own research (DYOR) and assess your personal risk tolerance before investing.
For ongoing analysis and to discover more exciting projects in the crypto space, don't forget to follow me!
Trade Smart!
Navid Jafarian

$ONDO - READY TO FLY???CRYPTOCAP:ONDO - 15% up already 💰
You know what's coming?? 🚀
If yes, like & share! 👍

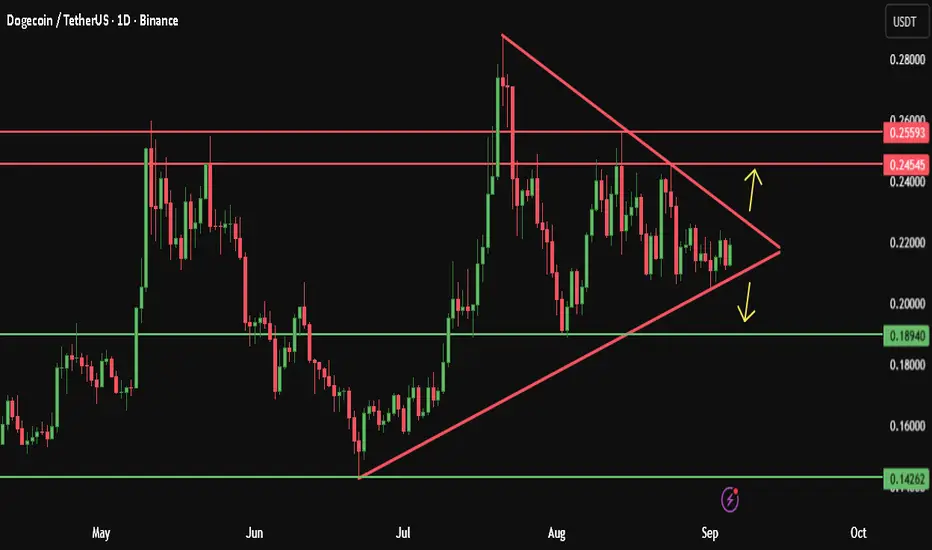
Dogecoin A potential explosive move is comingWe are currently observing the formation of a Symmetrical Triangle, suggesting the market is coiling up for a significant move.
A bullish breakout to the upside would likely target the upper resistance zone 0.2454 and 0.25593.
In the event of a bearish breakdown, we could see a decline towards the lower support at 0.18940 and 0.14262.
Let’s keep a close eye on this pattern for a confirmed direction.
please note :
this is not financial advice — it reflects only my personal opinion.
PLEASE always do your own research before trading .. Good luck with your trades.
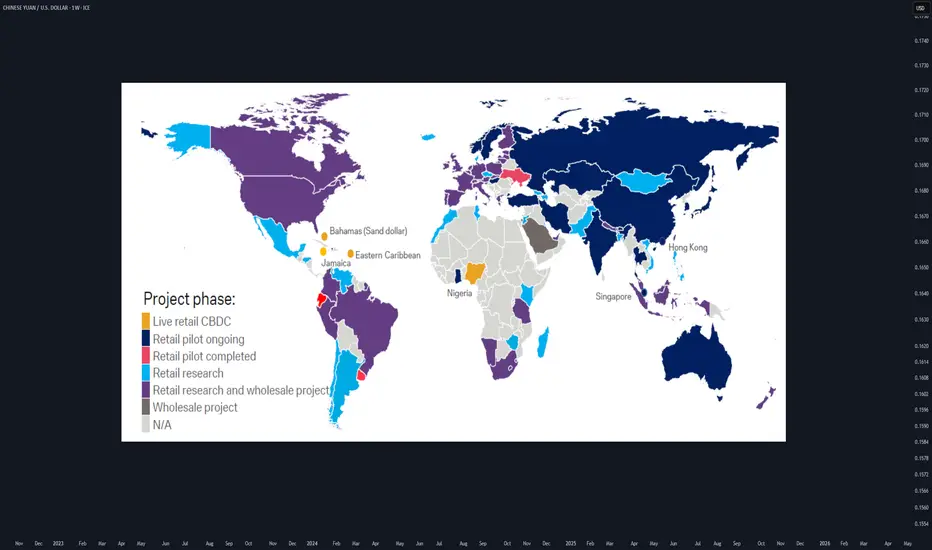
CBDCs for FXTraders :Your 2025 Guide to Digital Currency MarketsWhat if the U.S. dollar or Chinese yuan you’re trading today becomes digital tomorrow?
As of 2025, 132 countries are piloting Central Bank Digital Currencies (CBDCs) , with China’s digital yuan already in 260 million wallets. This isn’t sci-fi—it’s happening now, and it’s about to shake up forex markets.
hey I’m Skeptic :) At Skeptic Lab , we don’t chase hype—we dissect it. CBDCs are the next frontier, and I’m here to show you how to trade this shift without getting burned. In this guide, you’ll learn what CBDCs are, how they’ll mess with pairs like CNY/USD , and a beginner-friendly strategy to profit from the chaos. Let’s get ahead of the curve.
What Are CBDCs? A No-BS Breakdown
Central Bank Digital Currencies are digital versions of fiat money, backed by central banks. Think digital yuan or digital USD—same value, but on a blockchain or centralized ledger.
132 countries , including China (260M digital yuan wallets), India (digital rupee pilots), and the EU (digital euro trials), are testing CBDCs in 2025. Why? Control, speed, and lower transaction costs.
Unlike crypto, CBDCs are tied to fiat, so they’ll directly impact pairs like CNY/USD, INR/USD, or EUR/USD. Expect new volatility patterns and liquidity shifts.
I’m not sold on CBDCs being a trader’s paradise yet—central banks love control, and that could mean less freedom ( I hate XRP too, but I trade it when it gives my fuking trigger... ). But the opportunity is real if you know how to play it.
How CBDCs Will Shake Up Forex Markets
CBDCs could make cross-border transactions faster, boosting liquidity for pairs like CNY/USD. China’s digital yuan is already used in global trade pilots.
As countries roll out CBDCs, expect short-term price swings. For example, CNY/USD could spike if digital yuan adoption outpaces expectations.
Central banks might tighten forex controls with CBDCs, impacting leverage or spreads. Stay sharp—regulations are coming. Focus on CNY/USD (China’s digital yuan is live), INR/USD (India’s pilot is scaling), and EUR/USD (digital euro trials are accelerating). The hype says CBDCs will streamline forex, but I’m skeptical—centralized digital money could mean more manipulation. Still, volatility is a trader’s friend if you’re prepared.
Trading Strategy—Range Trading CNY/USD
Why CNY/USD? “China’s digital yuan is the most advanced CBDC, with 260M wallets and growing global use. CNY/USD is volatile but often range-bound, perfect for beginners.
Step-by-Step Strategy:
Identify the Range: “On TradingView, use daily charts to spot CNY/USD’s Range boxes ( Consolidation phases ). Look for consolidation after CBDC news. ”
Enter the Trade: “Buy after resistance breakout (breakout above consolidation box); sell after support breakout (breakout below our consolidation box). Set a stop-loss bellow the breakout candle or previous low in lower time frames(4h. ) or below previous support (4h) or above resistance and high (if you go for short).”
Take Profits: “clone the consolidation box and put it above or below the previous box. take partial profit (35% at rrr of 2 then 40% at rrr of 5 then 20% at rrr of 10 and close the rest when we formed lower highs and lower lows (based on dav theory)”
Risk Management: “ Risk only 1-2% of your account per trade. CBDC news can be fakout so have your other confirmations (such as RSI and PIVOT POINTS etc.)
Range trading isn’t sexy, but it’s steady. CNY/USD’s CBDC-driven swings make it a solid pick for 2025—just don’t get greedy.
Risks and What to Watch in 2025
CBDCs could tighten central bank control, reducing forex flexibility. Sudden policy shifts (e.g., China banning crypto trades again) could tank CNY/USD . Plus, tech glitches in CBDC rollouts might cause market freezes. Track CBDC adoption news on X—look for updates on China’s digital yuan, India’s rupee, or EU trials. Follow central bank announcements and IMF reports for clues.
I’m all in on spotting trends early, but CBDCs aren’t a free lunch. Stay skeptical , trade small, and always have an exit plan.
What’s your take on CBDCs in forex? Drop your thoughts bellow , and let’s debate!
Boost for more Skeptic takes :) 📈
Disclaimer: This article was written for educational purposes only and should not be taken as investment advice.
OP - Bullish structure medium term NASDAQ:OP - Inverse H&S structure spotted - Bullish medium term 📈
Pump potential:
70%+ 🚀
Key demand zone to be maintained:
0.6300 - 0.6150$
Weekly resistances;
0.8150 - 0.9250 - 1.060 - 1.00 - |1.180 - 1.20| - 1.380 - 1.600$

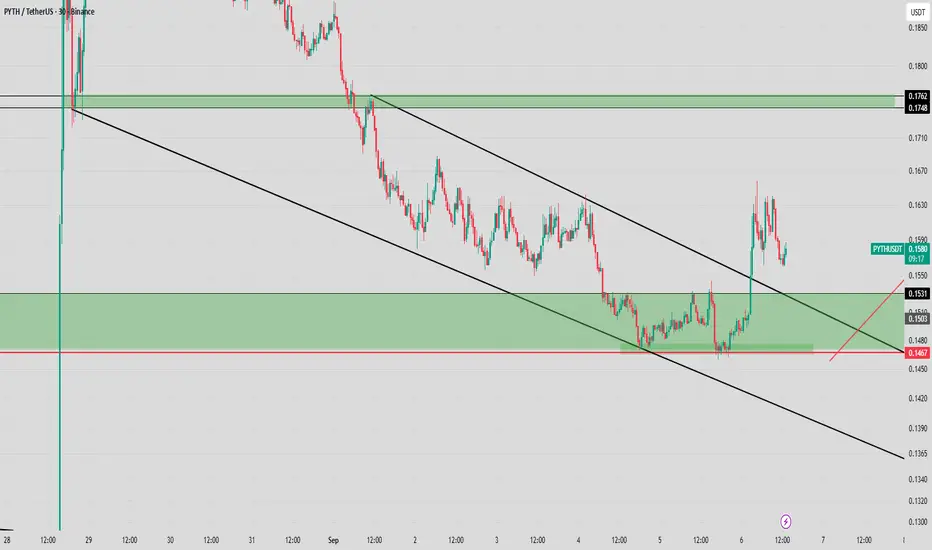
Pyth is gonna fileld the gap! As mentionned yesterday, it was the bottom on #PYTH 🔥
After the 40% correction downard, this may be a key bottom before to see a new high. The gape is probably gonna be filled soon! News and FA are too bullish 📈
0.1760 - 0.1800$: next big level to be tested 🎯
The world gold price increase shows signs of slowing downThe global gold price rally has shown signs of slowing as short-term futures traders booked profits after gold hit an all-time high and silver hit a 14-year high on Wednesday.
“We are seeing some profit-taking, but gold remains in an uptrend. Expectations of interest rate cuts and concerns about the independence of the US Federal Reserve (FED) will continue to boost safe-haven demand,” said Brian Lan, director of GoldSilver Central.
While gold has yet to hit that target, analysts said they are taking profits on concerns about upcoming news risks. The bank also noted that market volatility related to global trade issues has cooled, and long positions are showing signs of “condensing” again, which could limit the upside in the short term.

SUI bottom formedSui occuration making leading diagonal. If bottom is formed we can hunt pull back at 0.5 of 0.6 fibonacci level. Also Sui close candlestick above 200 Daily ema.
If Sui retest and find support on this level we can see bigger move elliot wave 3.
Targets 4.1 and above ATH. I think its good way to DCA and wait for confirmation.
#PHA - Price Analysis#PHA - Price Analysis
🔴 Still Bearish Beneath $0.1080–$0.1100 Resistance
🔸Structure: Bullish wedge forming 📈
🔸Daily Trend: Uptrend remains intact, continuing to support price 📈
Key Scenario:
If price continues to consolidate above $0.0980, I anticipate a potential strong move upward.
⚠️ Uncertainty:
It remains uncertain whether price will break down or not; but a breakdown is likely if we lose the $0.0970 level on a daily close.
Key levels and detailed setups are highlighted on my chart.
Better to wait for Bull volume coming in!

XAUUSD Liquidity Addiction: Why Your Brain Wants to Get Swept
💫There’s a cruel irony in trading: the cleaner a level looks, the more dangerous it usually is. ATHs, equal highs, perfect lows, and round numbers shine like neon signs saying “enter here.” And your brain, wired for safety and clarity, feels drawn to them like a moth to light. The problem? In SMC, those are not safe zones. They’re bait.
1. The Brain Craves Clarity
The human mind hates uncertainty. When a chart looks messy, hesitation dominates. But on the show of perfect symmetry, you relax because you see something clear. That relaxation is a dopamine hit, and you get addicted to it. But in the markets, the very thing that calms you down is what sets you up.
2. Trap in Action
You’ve seen it before. Price builds a flawless high, traders lean in heavy with sells, certain it can’t go higher — and then Gold rips into new ATHs. The sweep takes them out in minutes. What hurts most isn’t the loss itself, it’s the betrayal. You were so sure and felt safe. And that’s the point: the moment of peak confidence is the moment of maximum exposure.
3. Psychological Addiction
This cycle is repetitive for your brain, giving it a fake feeling of safety. Every “almost win,” every daily plan that looked perfect, every friend who caught that one clean breakout — it all trains you to crave the next hit of certainty. You’re not hooked on trading itself but on the illusion of control. The market doesn’t have to be smarter than you. It just has to let your brain do the 'work', then they take a piece of your account with your SL being hit.
📋 Takeaways
1. Spot the bait, don’t buy/sell it → If it looks too perfect, don’t ask “what am I benefiting?” but ask “WHO’s benefiting from this?”
2. Don’t trade the sweep itself → Wait for the reaction & confirmation after liquidity is taken.
3. Flip the perspective → Ask where the trap is being set, not where the bait is shining.
4. Patience is a position → Sweeps only work because traders can’t sit still.
🔑Liquidity does not hunt you. It waits for you to walk in. The moment you stop chasing certainty and start chasing context — structure, reactions, and intent — the game changes.
The 'traps' and 'baits' are in plain sight, so they cannot fool you so often.
If this article helped you today and brought you more clarity:
Drop a 🚀 and follow us✅ for more trading ideas and trading psychology. Thank you.

GOLD TECHNICAL OUTLOOKGold is currently trading in the 3560 – 3565 range, marking a new all-time high in its history. The market remains in a high-volatility phase, and the next few H4 candles will be crucial in defining short-term direction.
🔹 Key Pivot Level: 3555
---
🟢 Bullish Scenario
If the H4 candle closes above 3555, this would signal continued bullish momentum. In this case, upside targets may extend towards:
3585 – Initial bullish target
3605 – Next resistance area
3620 – Major resistance zone / potential new ATH extension
This scenario suggests the uptrend remains intact, with buyers controlling the market.
---
🔻 Bearish Scenario
If the H4 candle closes below 3555, it may indicate a potential pullback or correction. Bearish levels to watch are:
3530 – First support
3515 – Next bearish target
3485 – Major support area and potential correction base
This would suggest a short-term reversal or healthy retracement after the recent rally.
📊 Summary:
Gold is at a critical decision point. A confirmed H4 close above or below 3555 will likely define the next directional move. Until confirmation, the market remains neutral with both scenarios valid.
💡 Always manage risk carefully and wait for candle confirmations before considering any positions.

XAUUSD 30M – Intraday Plan Around the RangePrice is holding between $3,417.84 (resistance) and $3,403.41 (support). We’re trading around $3,410–$3,411 inside a tight box. Scalps can work, but reversals are quick.
🔼 Bullish Plan (needs confirmation)
Trigger: A clean 30min body close above $3,417.84 (not just a wick).
Targets: $3,419.55 → $3,420.54 → $3,422.10.
Management: Take partials at $3,419.55, move SL to breakeven once $3,418 holds on a retest.
🔽 Bearish Plan (cleaner below support)
Trigger: 30min body close below $3,403.41.
Targets: $3,401.29 → $3,398.36 (trail if sellers stay in control).
Management: Scale partials at $3,401.29, protect the rest at breakeven.
🔄 Range Scalp (higher risk, small size)
Shorts: $3,416–$3,417 on a clear rejection → aim $3,410–$3,412, SL above rejection high / $3,420.
Longs: $3,403–$3,404 on a strong rejection wick → aim mid-range, SL below $3,401.
✅ Break Confirmation
Strong 30min close through the level.
❌ Invalidation
Breakout closes back inside the box on the next candle (trap).
Multiple wick with no momentum.
📌 Bottom Line
Above $3,417.84 → bullish bias to $3,420.54 and $3,422.10.
Below $3,403.41 → bearish bias to $3,401.29 and $3,398.36.
Inside the box = scalp only, keep risk tight.

GOLD (XAUUSD) INTRADAY OUTLOOKCurrent Price: $3,377.
Range: Resistance at $3,378.86, Support at $3,370.24
Price is moving inside a tight box, rejecting both ends. Higher timeframe candles are showing wicks both sides → clear indecision.
🔼 Bullish Plan
Trigger: A 30min body close above $3,378.86 (not just a wick).
Targets: $3,381.50 → $3,383.00. If momentum holds, extension toward $3,390+.
Management: Partial profits at first target, move stop loss to breakeven once $3,380 is held.
🔽 Bearish Plan
Trigger: 30min body close below $3,370.24.
Targets: $3,367.42 → $3,365.00. Further drop possible into $3,362.80 if selling pressure builds.
Management: Scale partials at first target, protect rest at breakeven.
🔄 Range Scalp (higher risk)
Shorts: Near $3,378 on strong rejection → target mid-range $3,372–$3,374. SL above rejection high.
Longs: Near $3,370 on rejection wick → target mid-range $3,374. SL under lows.
⚠️ Small size only, chop can reverse fast.
✅ What Confirms Breakout
Strong 30min candle close outside $3,370–$3,378.
Follow through volume in same direction.
❌ What Invalidates
Breakout candle closes back inside range.
Multiple fakeout wicks without follow through.
📌 Bottom Line
Above $3,378 → Upside targets $3,386+.
Below $3,370 → Downside targets $3,362 and lower.
Inside range = scalpers’ market.

How MVRV Reveals Bitcoin’s Tops and Bottoms (Explained Simply)Welcome to Skeptic Night Bytes, Part 4
Ever wondered how to know if the market is at a top or bottom? 🤔 In this video, I break down the MVRV indicator with real examples
Don’t miss the teaser for the next episode where we unlock the power of the Z-score!

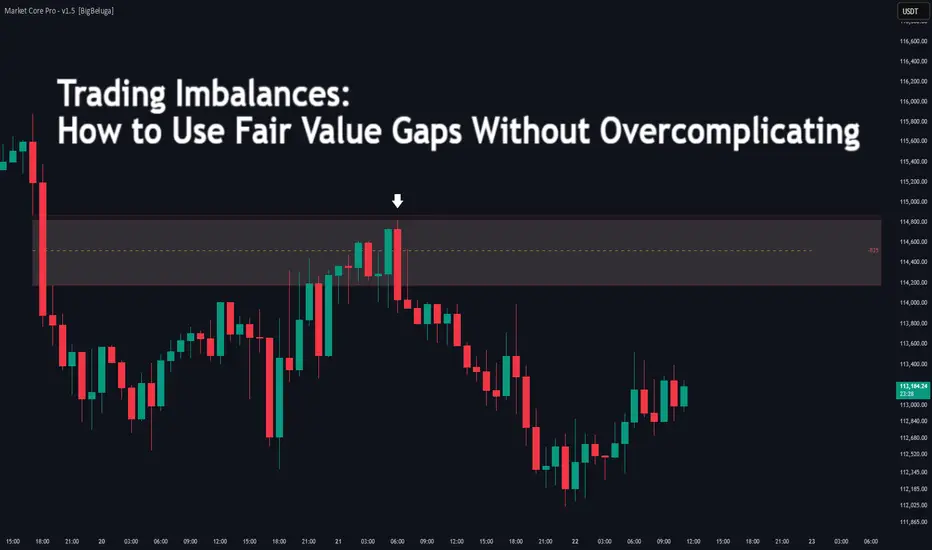
Trading Imbalances: How to Use Fair Value GapsDifficulty: 🐳🐳🐋🐋🐋 (Novice+)
This article is designed for traders who want to understand Fair Value Gaps (FVGs) in a simple, practical way — without drowning in complex Smart Money Concepts terminology.
🔵 INTRODUCTION
If you’ve studied Smart Money Concepts (SMC), you’ve likely come across Fair Value Gaps (FVGs). For many, the concept feels overcomplicated. In reality, an FVG is just an imbalance in price — a spot where the market moved so fast that it didn’t fully trade both sides.
🔑When price leaves a gap behind, it often comes back later to “rebalance.” This gives traders powerful zones for entries, exits, and target setting.
🔵 WHAT IS A FAIR VALUE GAP?
A Fair Value Gap is formed over three candles :
Candle 1: The first move (anchor).
Candle 2: The big impulsive candle (the imbalance).
Candle 3: The follow-up candle.
The gap exists when the high of Candle 1 is below the low of Candle 3 (in a bullish case). This leaves an “untraded zone” inside Candle 2.
Think of it as a skipped step. Price rushed through so quickly, there wasn’t enough time to trade at fair value.
🔵 WHY DOES PRICE RETURN TO FVGs?
Markets seek balance. When an imbalance forms, algorithms and institutional flows often revisit the gap to collect liquidity and rebalance orders.
This doesn’t mean every FVG gets filled instantly — some remain open for days or even weeks. But many serve as magnets for price.
🔑Key point: An FVG is not a magic level. It’s a clue about where inefficiency sits.
🔵 HOW TO TRADE FVGS SIMPLY
1️⃣ Mark the Zone
Identify the three-candle imbalance. Highlight the gap inside Candle 2.
2️⃣ Wait for Return
Don’t chase the impulsive candle. Instead, wait for price to retrace into the FVG zone.
3️⃣ Trade the Reaction
Bullish FVG → wait for price to dip into the zone and show bullish reaction
Bearish FVG → wait for price to retest zone and reject downward
Stops are usually placed beyond the gap, targets set toward the next liquidity pool or swing level.
🔵 EXAMPLE SCENARIO
A strong bullish candle leaves an imbalance.
Price continues higher, but a day later revisits the gap.
At bullish rejection candles form with increasing volume.
Entry taken, stop below gap, target at next swing high.
🔵 TIPS FOR ADVANCED TRADERS
Higher timeframe FVGs are stronger and attract price longer.
Not every gap fills — filter with trend direction.
Combine with OBs (Order Blocks) or liquidity zones for more precision.
Ignore small random gaps in low-volume markets.
🔵 CONCLUSION
Fair Value Gaps don’t need to be mysterious. They’re simply imbalances in the auction process. By waiting for price to return and react, traders can build structured entries with defined risk.
🔑Instead of overcomplicating SMC concepts, think of FVGs as footprints of urgency — and opportunities for balance.
Do you already trade FVGs, or is this your first time hearing about them? Share your setups below!