RSI Indicator LIES! Untold Truth About Relative Strength Index
The Relative Strength Index (RSI ) is a classic technical indicator that is applied to identify the overbought and oversold states of the market.
While the RSI looks simple to use, there is one important element in it that many traders forget about: it's a lagging indicator . This means it reacts to past price movements rather than predicting future ones. This inherent lag can sometimes mislead traders, particularly when the markets are volatile or trade in a strong bullish/bearish trend.
In this article, we will discuss the situations when RSI indicator will lies to you. We will go through the instances when the indicator should not be relied and not used on, and I will explain to you the best strategy to apply RSI.
Relative Strength Index analyzes the price movements over a specific time period and displays a score between 0 and 100.
Generally, an RSI above 70 suggests an overbought condition, while an RSI below 30 suggests an oversold condition.
By itself, the overbought and overbought conditions give poor signals , simply because the market may remain in these conditions for a substantial period of time.
Take a look at a price action on GBPCHF. After the indicator showed the oversold condition, the pair dropped 150 pips lower before the reversal initiated.
So as an extra confirmation, traders prefer to look for RSI divergence - the situation when the price action and indicator move in the opposite direction.
Above is the example of RSI divergence:
Crude Oil formed a sequence of higher highs, while the indicator formed a higher high with a consequent lower high. That confirmed the overbought state of the market, and a bearish reversal followed.
However, only few knows that even a divergence will provide accurate signals only in some particular instances.
When you identified RSI divergence, make sure that it happened after a test of an important key level.
Historical structures increase the probability that the RSI divergence will accurately indicate the reversal.
Above is the example how RSI divergence gave a false signal on USDCAD.
However, the divergence that followed after a test of a key level, gave a strong bearish signal.
There are much better situations when RSI can be applied, but we will discuss later on, for now, the main conclusion is that
RSI Divergence beyond key levels most of the time will provide low accuracy signals.
But there is one particular case, when RSI divergence will give the worst , the most terrible signal.
In very rare situations, the market may trade in a strong bullish trend, in the uncharted territory, where there are no historical price levels.
In such cases, RSI bullish divergence will constantly lie , making retail traders short constantly and lose their money.
Here is what happens with Gold on a daily.
The market is trading in the uncharted territory, updated the All-Time Highs daily.
Even though there is a clear overbought state and a divergence,
the market keeps growing.
Only few knows, however, that even though RSI is considered to be a reversal, counter trend indicator, it can be applied for trend following trading.
On a daily time frame, after the price sets a new high, wait for a pullback to a key horizontal support.
Your bullish signal , will be a bearish divergence on an hourly time frame.
Here is how the price retested a support based on a previous ATH on Gold. After it approached a broken structure, we see a confirmed bearish divergence.
That gives a perfect trend-following signal to buy the market.
A strong bullish rally followed then.
RSI indicator is a very powerful tool, that many traders apply incorrectly.
When the market is trading in a strong trend, this indicator can be perfectly applied for following the trend, not going against that.
I hope that the cases that I described will help you not lose money, trading with Relative Strength Index.
❤️Please, support my work with like, thank you!❤️
I am part of Trade Nation's Influencer program and receive a monthly fee for using their TradingView charts in my analysis.
Tradingtips

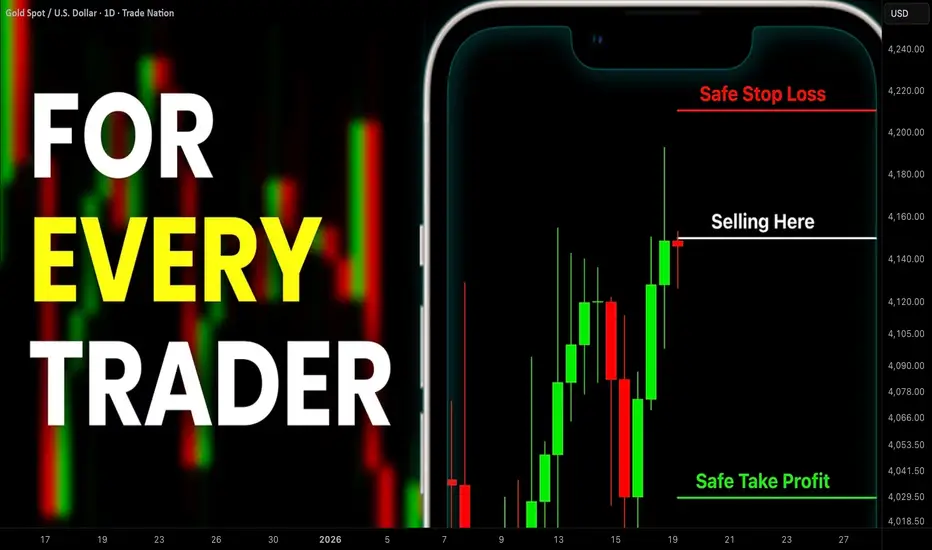
The Only Stop Loss and Take Profit Strategy You Need
This stop loss and take profit strategy is unique: being very efficient, safe and accurate , it can be applied for day trading, swing trading and scalping.
In this article, I will teach you how to easily place stop loss and target, applying just one basic technical tool.
Imagine that you are planning to open a trading position. You may decide to open a swing trade on a daily, a day trade on an hourly time frame, or a scalping trade on 15 minutes time frame.
For the sake of the example,
we will take a short position on GBPUSD on a daily,
a short position on NZDUSD on an hourly time frame,
and a long position on USDCHf on 15 minutes time frame.
In order to identify safe levels for TP and SL on GBPUSD, identify the closest key horizontal support and resistance on a daily time frame.
When you underline key structures, make sure that you consider the candle closes and the wicks , so that the key structure would represent the area .
Your safe stop loss will be strictly above the closest horizontal resistance,
while your target will be the upper boundary of a key horizontal support.
Selling NZDUSD on an hourly time frame, identify the closest key horizontal support and resistance on an hourly time frame.
Your safe stop loss will lie above a key resistance,
and your take profit will be the upper boundary of a key support.
Buying USDCHF on 15 minutes time frame, you do the same thing.
You identify the closest support and resistance.
Your safe stop loss will be below a key support, while your take profit will be a lower boundary of a key resistance.
Planning your trade, always remember to assess th e reward to risk ratio of your trade.
If the risk is bigger than the reward, such reward to risk ratio will be called negative .
Such a trade is better not to take.
While, the trade where reward exceeds risk will have a positive r/r ratio.
Such a trade we can take.
This stop loss and take profit placement technique is not perfect.
With experience, you will learn to set even safe stop loss and take profits, but for beginners, that is one of the safest strategies to follow.
❤️Please, support my work with like, thank you!❤️
I am part of Trade Nation's Influencer program and receive a monthly fee for using their TradingView charts in my analysis.
FREE SUPPORT and RESISTANCE Indicator to Identify Key Levels
In this article, I will show you a simple technical indicator that will help you to identify support and resistance levels easily trading any financial market.
And what I like about this indicator is that it is absolutely free and it is available on all popular trading platforms: tradingview, meta trader 4, meta trader 5, etc.
This indicator is called Zig Zag.
After adding the indicator, the price chart will look like that.
First, I recommend changing its settings .
Price deviation - 1.5
Pivot legs - 5
Here are the inputs that I recommend for structure analysis on a daily time frame.
And in style remove labels because they really distract.
What this technical indicator does, it underlines the significant impulse legs. The completion and initial points of the impulses will be the important structures.
Your key structures will be the areas based on the initial/completion points of impulses based on wicks and candle closes.
A key horizontal support will be based on the initial point of the impulse and the lowest candle close.
Key supports will be all the structures that are below current price levels.
A key horizontal resistance will be based on the initial point of the impulse and the highest candle close.
Key resistances will be all the structures that are above current price levels.
Also, the completion/initial points of the impulses will occasionally compose the vertical structures - the trend lines.
Underline all the supports/resistances based on Zig Zag indicator.
All these structures are significant and can be applied for pullback/breakout trading.
Also, remember that you can modify the inputs of the indicator.
Increase Price deviation and Pivot legs number will show the stronger structures, while decreasing these numbers, more structures will appear on the chart.
On the left chart:
Price deviation - 1.5
Pivot legs - 5
On the right chart:
Price deviation - 5
Pivot legs - 10
The right chart shows just 2 structures, but very important ones.
This indicator is very powerful and it can help you a lot in learning structure analysis.
❤️Please, support my work with like, thank you!❤️
I am part of Trade Nation's Influencer program and receive a monthly fee for using their TradingView charts in my analysis.

Gold (XAU/USD) Analysis: Triangle Breakout Strategy Aaj Gold (XAU/USD) ke 1-hour chart par ek clear Symmetrical Triangle pattern banta nazar aa raha hai. Price ne triangle ki lower support line ko break kiya hai, jo ek potential Bearish Move ka ishara hai.
Entry: Current market price ($4,326 ke aas-paas) ya retest par.
Stop Loss: $4,351 (Triangle ke pichle high ke upar).
Take Profit: $4,292 (Next support zone).
Market mein volatility ho sakti hai, isliye hamesha proper risk management ka istemal karein. Aapka is setup ke baare mein kya khayal hai? Comment mein batayein! 🚀
#GoldAnalysis #ForexTrader #TechnicalAnalysis #XAUUSD #PriceAction #TradingTips #TradingView

Top-5 tips for Top-Down Multiple Time Frame Analysis Trading
I am trading multiple time frame analysis for many years. After reviewing trading ideas from various traders on Tradingview, I noticed that many traders are applying that incorrectly
In this article, I will share with you 5 essential tips , that will help you improve your multiple time frame analysis and top-down trading.
The Order of Analysis Matters
Multiple time frame analysis is also called top-down analysis for a reason. When you trade with that, you should strictly start your analysis with higher time frames and then dive lower, investigating shorter-term time frames.
Unfortunately, most of the traders do the opposite . They start from a lower time frame and finish on a higher one.
Above are 3 time frames of EURGBP pair: daily, 4h, 1h.
To execute multiple time frames analysis properly, start with a daily, then check a 4h and only then the hourly time frame.
Limit the Number of Time Frames
Executing multiple time frame analysis, many traders analyse a lot of time frames.
They may start from a weekly and finish on 5 minute time frame, going through 5-8 time frames.
Remember that is it completely wrong . For execution of a multiple time frame analysis, it is more than enough to analyse 3 or even 2 time frames. Adding more time frames will overwhelm your analysis and make it too complex.
Analyse Particular Time Frames
Your multiple time frame analysis should be consistent and rule-based. It means that you should strictly define the time frames that you analyse.
For example, for day trading, my main trading time frames are daily, 4h, 1h. I consistently analyse ONLY these trading time frames and I look for day trades only analysing this combination of time frames.
Higher is the time frame, stronger the signal it provides
Trading with multiple time frame analysis, very often you will encounter controversial signals: you may see a very bullish pattern on a daily and a very bearish confirmation on 30 minutes time frame.
Always remember that the higher time frames confirmations are always stronger , and their accuracy and probability is always higher.
Above there are 2 patterns:
a head and shoulders pattern on a daily time frame with a confirmed neckline breakout, and an inverted head and shoulders pattern on a 4h time frame with a confirmed neckline breakout.
2 patterns give 2 controversial signals:
the pattern on a daily is very bullish and the pattern on a 4h is very bearish.
The signal on a daily time frame will be always stronger ,
so it is reasonable to be on a bearish side here.
You can see that the price dropped after a retest of a neckline of a head and shoulders on a daily, completely neglecting a bullish pattern on a 4H.
Each Time Frame Should Have Its Purpose
You should analyse any particular time frame for a reason.
You should know exactly what you are looking for there and what is the purpose of your analysis.
For example, for day trading, I analyse 3 time frames.
On a daily, I analyse the market trend and key levels.
On a 4H time frame, I analyse candlesticks.
On an hourly time frame, I look for a price action pattern as a confirmation.
On GBPAUD on a daily, I see a test of a key horizontal resistance.
On a 4H time frame, the price formed a doji candle.
On an hourly, I spotted a double top, giving me a bearish confirmation.
These trading tips will increase the accuracy of your multiple time frame analysis. Study them carefully and adopt them in your trading.
❤️Please, support my work with like, thank you!❤️
I am part of Trade Nation's Influencer program and receive a monthly fee for using their TradingView charts in my analysis.
Gold Forex Trading During Major Economic Events & News Releases
I guess you already noticed how impulsively the markets may react to economic events and news.
In this article, I will teach you a simple strategy to follow during important news release s and how to trade news.
1. Sort out the economic calendar
There are a lot of news in the economic calendar.
They are not equal in their impact.
Most of the economic calendars indicate the potential significance of each event: while some news have low importance, some have medium importance and some are considered to be extremely important.
For example, above is the list of coming UK fundamental news.
You can see that these news have different degree of importance.
My recommendation to you is to sort out the economic calendar in a way, so it would display only the most important news.
Among the news that we discussed above, only one release has high importance.
2. Know on what trading instruments does the news have an effect
While some of the news in the economic calendar may impact many financial markets and trading instruments, some news may affect very particular instruments.
For example, a FED Interest Rate decision may have a very broad effect on financial markets.
At the same time, Interest Rate Decision in Australia may affect only Australia - related instruments.
3. Don't trade one hour before the news and one hour after the release
Once you see the important fundamental news coming, don't trade the trading instruments that can be affected by the new s 1 hour before and after the release.
For example, in 5 minutes we are expecting important UK news - CPI data.
I stopped trading GBP pairs 1 hour before the release of the news, and will resume trading them one hour after the release.
4. Protect your trading positions 5 minutes ahead of the news
If you have an active trading position and related important news are expected, move your stop loss to entry 5 minutes ahead of the release of the news.
For example, I have a short trade on GBPAUD. I see that in 5 minutes important UK data is coming. I will move stop loss to entry 5 minutes ahead of the news and make a position risk-free.
I always say to my students, that news trading is very complicated. Due to a high volatility, it is very hard to make wise decision during the news releases.
The approach that I suggest will help you to avoid all that and trade the markets when they are calm.
❤️Please, support my work with like, thank you!❤️
I am part of Trade Nation's Influencer program and receive a monthly fee for using their TradingView charts in my analysis.

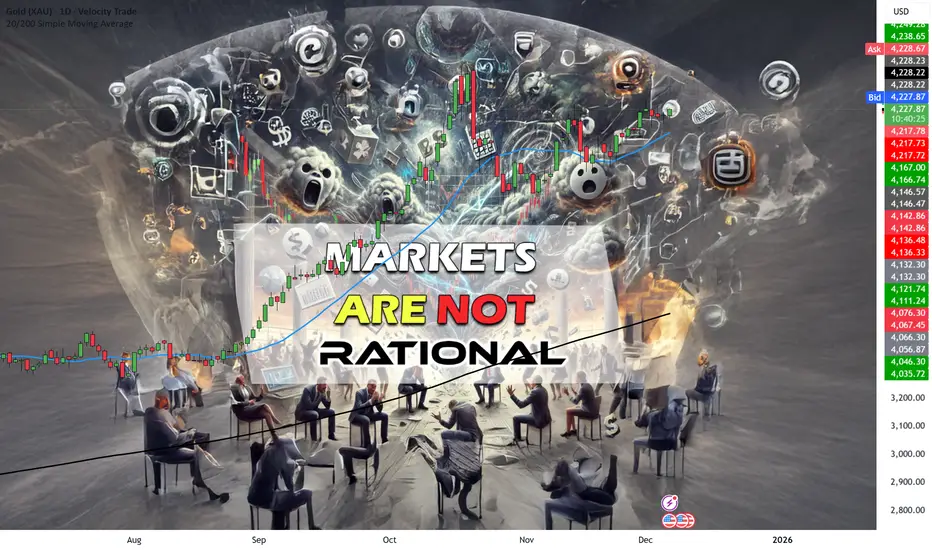
Why Markets Aren’t Always RationalWhy Markets Aren’t Always Rational
Have you ever scratched your head wondering why the stock market seems to defy logic?
Wars breakout – Markets rally such as the Dow Jones Futures
Currencies devalue – Markets rally.
Bad earnings come out – Markets rally.
Great news come out and markets crash.
Don’t worry; you’re not alone.
Traders everywhere experience that jaw-dropping moment when good news doesn’t lead to uptrends, correlations break down, or when the market’s behavior looks like one big, chaotic mess.
So, why do markets behave like this?
Let’s unpack the mystery.
The Market is One Cluster-Freak of Confusion
Let’s start with the truth no one wants to admit.
The market is not a perfect machine.
It’s not the textbook example of logic that economic theories might have you believe.
Correlations don’t work according to the book.
One day, gold and the dollar move in opposite directions.
The next day, they move in tandem. You’re left wondering if someone swapped the rule book for a comic strip.
And then there’s the disconnect between trends and fundamentals.
You dive into micro and macro analyses, only to find that a company with stellar earnings is trending down.
Meanwhile, a company with mediocre reports is rocketing to the moon.
Why? Because market participants aren’t robots.
They’re emotional, impulsive, and sometimes downright irrational.
They drive the markets with fear, greed and ego.
The market is less of a math equation and more of a mood swing.
Good News Doesn’t Always Mean Strong Uptrends
Here’s another slap in the face of logic:
Good news can sometimes trigger sell-offs.
A company beats earnings expectations, announces an exciting product, and yet—boom—the stock plummets.
What gives?
This happens because markets are driven by expectations, not just outcomes.
If the “good news” was already priced in, traders may sell to take profits.
Worse, if the news didn’t exceed sky-high expectations, the market might interpret it as a letdown.
Herd Mentality: Following the Wrong Crowd
Ever heard the phrase, “When in doubt, follow the herd”?
That’s exactly what many traders do—and it’s not always the smartest move.
Market trends often amplify irrational behavior.
If the market’s falling, traders sell in a panic. If it’s rallying, they buy in FOMO (fear of missing out).
These emotional reactions create an illusion of logic, but in reality, it’s chaos feeding on itself.
Real-life example? Meme stocks. Companies with no strong fundamentals suddenly became multi-billion-dollar rockets because traders on Reddit decided to collectively moonshot them.
Rationality?
Out the window.
How to Stay Sane in an Irrational Market
So, what can you do to navigate this madness? The key is to build your own strategy – Proven, profitable and consistent through MOST market environments.
Avoid getting swept up in market noise.
Understand market psychology.
Accept that emotions drive the market just as much as fundamentals do.
Be cautious with correlations. Test them, but don’t bet the farm on them. Remember, markets love to break their own rules.
Don’t rely solely on good news. Always ask yourself: Is this already priced in? What are the broader market expectations?
Think long-term.
The daily market irrationality tends to smooth out over time. Focus on the bigger picture rather than short-term hiccups.
FINAL WORDS:
When you have your edge – then the markets irrationality become irrelevant to your trading success.
Markets often appear irrational due to emotional participants and unpredictable trends.
Let’s sum up what we have covered:
Correlations don’t always follow the “rules.”
Good news doesn’t guarantee uptrends; expectations and psychology matter more.
Herd mentality amplifies irrational moves.
Stay grounded, think critically, and focus on long-term strategies.
The market may be a cluster-freak of confusion, but with the right mindset, you can navigate the chaos like a pro.
Now, let’s tackle that beast head-on!
7 Tips for Portfolio Growth in TradingWe need to constantly feed out portfolios to help it grow and accelerate.
Consistency is key!
Whether you’re trading the JSE Top 40 to the Dow Jones Index – You need to show you’re consistent with each market.
One simple (but often overlooked) habit is depositing extra funds into your portfolio regularly.
Whether it’s every month or twice a year, this seemingly small step can create a snowball effect for your portfolio’s performance.
But don’t stop there. Let’s dive into 10 actionable tips to take your portfolio growth to the next level.
Deposit Consistently, No Matter What
Think of your trading account like a savings account on steroids.
Commit to depositing a portion of your income every month or at least every six months. The more fuel (capital) you add, the bigger your fire (portfolio) can grow.
Even small, regular deposits add up over time. Start with what you can afford, and increase it as your income or confidence grows.
Reinvest Your Profits
Don’t spend your trading profits on frivolous stuff—at least not all of it!
Reinvesting your gains is like planting seeds from a harvest.
Instead of withdrawing every win, let the power of compounding work its magic.
The bigger your capital, the more opportunities you’ll have to trade and profit.
Have a Risk Management Plan
Growth doesn’t mean taking unnecessary risks. In fact, the fastest way to shrink a portfolio is by failing to manage your losses.
Stick to the golden rule: never risk more than 1-2% of your total portfolio on a single trade.
You’ll stay in the game longer, and consistency will help your portfolio thrive.
Scale Up Your Position Sizes (Wisely)
As your portfolio grows, so should your position sizes.
But here’s the kicker—only scale up when your strategy proves consistent.
If you’re consistently hitting a 60%+ win rate, increase your position sizes incrementally.
This way, your gains grow proportionally while keeping risk manageable.
Avoid Overtrading
More trades don’t always mean more profits. In fact, overtrading is a silent portfolio killer.
Stick to your plan, and only trade setups that meet your criteria. Think quality over quantity. A patient trader is often a profitable one.
Track Your Performance Religiously
You can’t improve what you don’t measure.
Maintain a trading journal to track every trade, deposit, and withdrawal.
Review your performance weekly or monthly. Identify what’s working, what’s not, and adjust accordingly. Growth thrives on self-awareness!
Stay Mentally Sharp and Emotionally Disciplined
Let’s face it: trading can be an emotional rollercoaster.
But emotional decisions are often bad decisions.
Maintain a clear mind by sticking to your strategy and not chasing losses or revenge trading. Remember, a calm trader is a winning trader.
Bonus Tip: Practice mindfulness or take breaks when needed. Your portfolio will thank you.
Final words:
To grow a consistent portfolio, we need to adapt to important tips and elements.
Let’s sum up the 7 important ones to grow a portfolio.
Deposit Consistently, No Matter What
Reinvest Your Profits
Have a Risk Management Plan
Scale Up Your Position Sizes (Wisely)
Avoid Overtrading
Track Your Performance Religiously
Stay Mentally Sharp and Emotionally Disciplined

Don't Trade These Trend Lines. Forex Gold Trading Basics
A lot of traders apply trend lines for trading and making predictions on different financial markets.
Trend line can also be an important element of price action patterns.
However, only few knows that some trend lines are better to be avoided .
In this article, I will share with you the types of trend lines that you should avoid and not rely on for making trading decisions.
Invalidated Trend Line
Even the strongest trend lines may lose their significance with time.
Before you take a trade from a trend line, make sure that it still remains valid.
If the trend line is not respected by the buyers and then by the sellers,
or by the sellers and then by the buyers, we say that such a trend line lost its significance, and it is better to not trade it.
Have a look at that rising trend line on USDCAD.
We see strong bullish reactions to that, and we may expect a bullish movement from that, once it is tested.
However, it was violated and after a breakout it should turn into a vertical resistance.
Retesting that, the price easily went through the broken trend line.
The trend line lost its significance, and it is better to not trade that in the future.
2 Touches Based Trend Line
When you are looking for a strong trend line to trade, remember that the trend line should be confirmed by at least 3 touches and 3 consequent bullish / bearish reactions to that.
Above is the example of a valid and reliable trend line.
However, quite often, newbie trade 2 touches based trend lines.
Most of the time, such trend lines are neglected by the market.
Moreover, relying on 2-touches-based trend lines, your chart will look like a complete mess .
Simply because there are too many trend line meeting that criteria.
Receding trend line
There are the trend lines that go against your trade with time while remaining valid.
Have a look at a major falling trend line on NZDCHF on a daily time frame.
You may open a swing long position from that on a daily or a day trade on intraday time frames like an hourly.
You can see that the market may easily go against your predictions for a long time, while perfectly respecting a trend line.
The price was sliding on that trend line for 6 consequent days before it finally started to grow.
Such trend lines are better to be avoided .
Make sure that a trend line and your trade have the same direction.
Trend lines can provide very safe points for trading entries. However, the trend lines are not equal and while some of them can be very profitable, some of them can lead to substantial losses.
❤️Please, support my work with like, thank you!❤️
I am part of Trade Nation's Influencer program and receive a monthly fee for using their TradingView charts in my analysis.

Why Your Next Trade Means Nothing
🧠 The Notebook Process #2 — Understanding the True Nature of Trading.
Some laws govern everything we do, and trading is no exception, even if it often feels like pure chaos.
Every tick looks random. Every trade feels unique. Yet beneath that noise, a hidden law quietly shapes your results. It’s one of the cornerstones of statistics, and it rules every trading account on Earth: The Central Limit Theorem.
Don’t worry, no math coming your way: just an intuitive truth you can plug directly into your trading mindset.
📖 The Nature of Trading.
Your true profitability, your average win or loss, only begins to emerge and, more importantly, stabilize after a large number of trades.
That’s it. That’s the law.
A single trade? Meaningless. Ten trades? Still noise.
Hundreds of trades? That’s where the truth starts to show. What you see after enough repetitions isn’t randomness anymore: it’s your edge revealing itself.
That’s the Law of Large Numbers and the Central Limit Theorem in motion: pure science.
☑️ What This Means for Traders.
Your system’s real strength, its expectancy, only appears through repetition.
A handful of trades? Still luck. Pure variance, random ups and downs that mean nothing.
A few hundred? Now you’re seeing skill: the signal rising above the noise. In plain English:
“A trading journey can only be evaluated after a large number of trades. That’s why your process matters more than your last result, no matter how good or bad it looked.”
And that’s exactly what The Notebook Process #1 was about: 👉 Evaluate in blocks, not single trades.
💸 Let’s Put the Law to Work:
1️⃣ Take your trading record and compute: Average win, Average loss, and Win rate.
2️⃣ Calculate your expectancy using this simple formula:
(Avg Win × Win Rate) – (Avg Loss × (1 – Win Rate))
3️⃣ That number tells you how much you make (or lose) per trade on average, and more importantly, what you can expect to make in the future.
If it’s positive, you’re trading with an edge. Keep going: reproducibility is what makes it stable.
If it’s negative, stop immediately. The bleeding won’t stop until the math changes.
That’s it. Pure math applied to trading: and believe me, you don’t want to fight this law.
🌍 The Gravity of Trading.
The difference between a trader who understands and one who only tries isn’t talent, it’s focus.
Focus on expectancy, not the win rate, not the reward to risk ratio.
It might seem basic, but so is gravity, and like gravity, it governs you whether you believe in it or not.

Overtrading: Understand Now to Avoid Mistakes!Hey everyone! 👋
I know that in the world of trading, it’s easy to let emotions take over, especially after a losing streak. Overtrading is one of those invisible enemies that you need to identify and avoid as soon as possible.
1 | What is Overtrading? 💡
Overtrading happens when you take too many trades, usually driven by emotions, especially when you feel the need to "recover" losses from a losing streak. At this point, your decisions are no longer based on technical analysis or your strategy; instead, they are impulsive reactions that lead you to take on more risk.
2 | Psychological and Financial Consequences 😞
Psychological:
When overtrading, you start to feel stressed, exhausted, and lose mental clarity for decision-making. Feelings of disappointment creep in, and gradually, you lose confidence and patience, leaving space only for anxiety.
Financial:
Overtrading also quickly drains your account. Increased transaction fees, prolonged losses, and lack of discipline wear down your capital. Over time, you could lose trust in yourself and compromise your financial stability.
3 | How to Protect Yourself? 💪
To avoid overtrading, the key is having a strict trading plan. Limit the number of trades you take each day, set specific trading hours, and establish clear objectives. Learning patience is crucial — sometimes, the best move is not to trade at all!
Remember: When you have a clear plan and stick to your discipline, you’ll be able to control your emotions and avoid impulsive decisions.
Wishing you all successful and smart trading! 💥
If you found this article helpful, don’t forget to share it and leave your thoughts in the comments. Let’s keep learning and growing together every day! 🙌
Don’t let emotions control you. Let reason guide your trading!
Why Most Traders Lose and How to Flip the Script
It’s no secret: most retail traders lose money.
Not because the markets are “rigged,” but because trading is a game of probabilities, discipline, and psychology.
Let’s break down why losses happen, the psychology behind them, and how to build a better plan to stay in the game long-term.
1. Why Most Traders Lose
There are a handful of mistakes that account for the majority of blown accounts:
🔸 Overleveraging – Using too much size turns small moves against you into catastrophic losses.
🔸 Lack of risk management – Without stop-losses, max drawdown rules, or position sizing, one bad trade can erase weeks of gains.
🔸 Chasing trades – Entering late after a big move due to FOMO, only to sell at the bottom.
🔸 No system – Random entries and exits with no strategy mean your results are left entirely to chance.
🔸 Emotional trading – Anger, revenge trades, and greed lead to impulsive decisions that sabotage even good setups.
Most traders know these mistakes on paper, but knowledge alone doesn’t prevent them. The real enemy is psychology.
2. The Psychology Behind Losing
When most people think about why traders lose, they picture bad entries or poor technical skills. But the truth is, the biggest battles aren’t fought on the charts—they’re fought in the mind. Understanding the psychology behind losing is critical, because it explains why traders keep repeating the same mistakes even when they “know better.”
Loss Aversion
Psychologists have proven that humans feel the pain of losing about twice as strongly as the pleasure of winning. In trading, this shows up in two destructive ways: holding onto losing positions far longer than we should, and selling winning positions far too early. A trader might watch a loss grow from -5% to -20% because closing the trade would mean admitting they were wrong. On the flip side, the moment a trade turns green, they take profit too quickly, just to escape the fear of it slipping back to red. Over time, this creates an inverted risk/reward profile—small wins and big losses—the exact opposite of what successful trading requires.
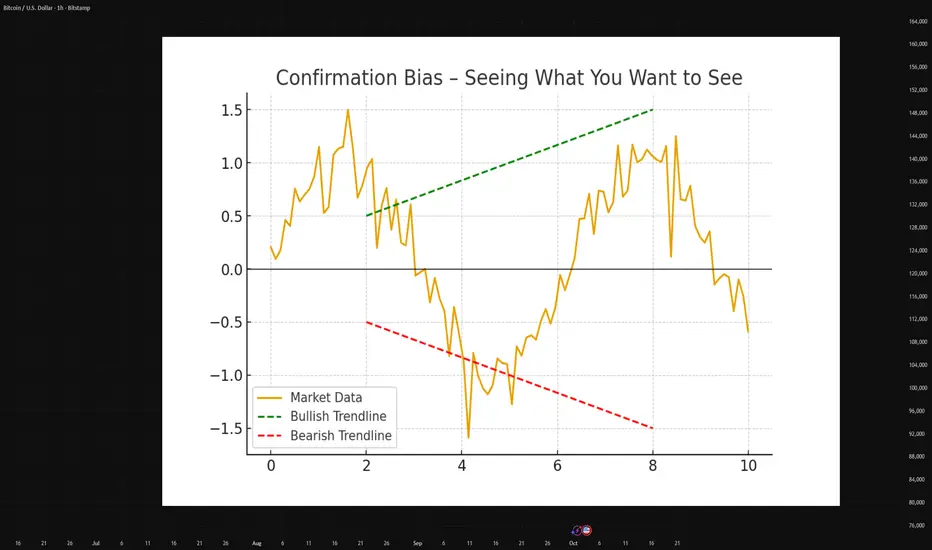
Confirmation Bias
Once a trader enters a position, the human brain naturally looks for reasons to justify it. They’ll scroll through charts, social media, or news feeds, paying attention only to the information that supports their trade, while ignoring anything that contradicts it. This tunnel vision can be deadly, because markets don’t care about opinions—they reward objectivity. A good trader must learn to question their own bias constantly, asking not “why am I right?” but “what would prove me wrong?”
Ego and Revenge Trading
Every trader knows the sting of a losing trade. But what comes next separates amateurs from professionals. The inexperienced trader often lets ego take over. Instead of stepping back, they try to immediately “win back” what was lost, usually by doubling their position size, rushing into another setup, or abandoning their strategy entirely. This revenge trading spiral often leads to much larger losses. The market punishes desperation, and it rewards patience. The ability to walk away after a loss and reset emotionally is one of the hardest but most valuable skills to develop.
The Illusion of Control
Many traders believe that the more time they spend staring at charts or the more trades they take, the better their results will be. This illusion of control often leads to overtrading, which drains both capital and emotional energy. In reality, trading is about probabilities, not control. No amount of screen time can eliminate uncertainty. The edge lies in preparation, discipline, and executing a plan—not in micromanaging every tick of price action. Paradoxically, the less you feel the need to control the market, the more control you gain over your own decisions.
3. How to Prevent Frequent Losses
The good news: most of these pitfalls can be managed with structure and discipline.
✔️ Risk Per Trade – Never risk more than 1–2% of your total capital on a single position.
✔️ Predefine Rules – Before you click buy/sell, know your entry, stop, and target.
✔️ Accept Losses – Treat them as the “cost of doing business.” Even pros lose 40–50% of trades.
✔️ Quality > Quantity – Fewer, higher-probability trades often outperform constant scalping or chasing.
✔️ Journal Every Trade – Write down why you entered, why you exited, and what you felt. This exposes patterns in your behavior.
4. Building a Better Plan
Trading without a plan is gambling. Building a system gives you consistency.
Define Your Edge: What makes your trade valid? Is it a technical setup, a market structure, or a specific confluence of signals?
Backtest Your Strategy: Test your rules on historical data before risking real money.
Stick to Probabilities: No setup wins 100%. Focus on consistency over a large sample size.
Emotional Control Routine: Walk away after a big loss, set daily limits, and never trade tired or stressed.
Takeaway
Most traders lose not because they’re “bad” but because they don’t treat trading like a business.
By mastering psychology, defining risk, and following a plan, you stop thinking in terms of single trades → and start thinking in terms of long-term probabilities.
Trading isn’t about being right every time.
It’s about surviving long enough for your edge to play out.
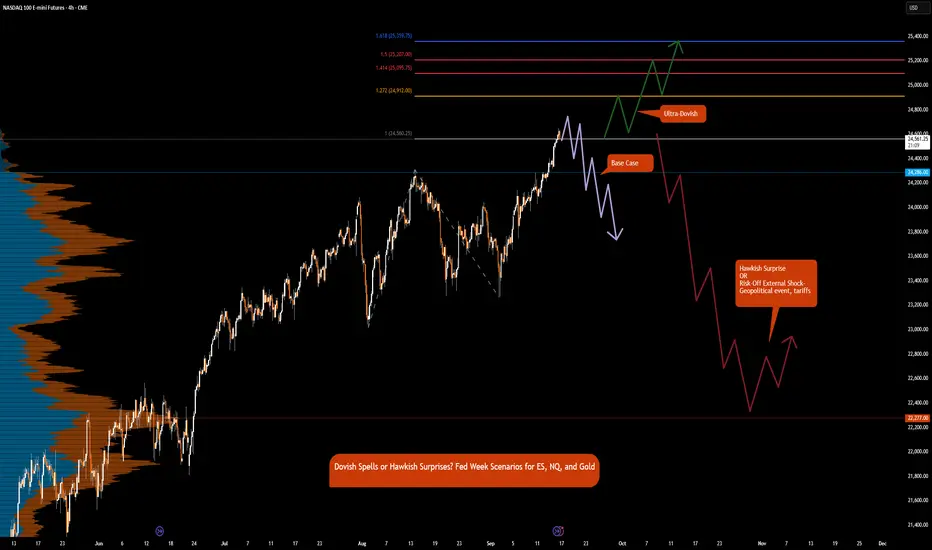
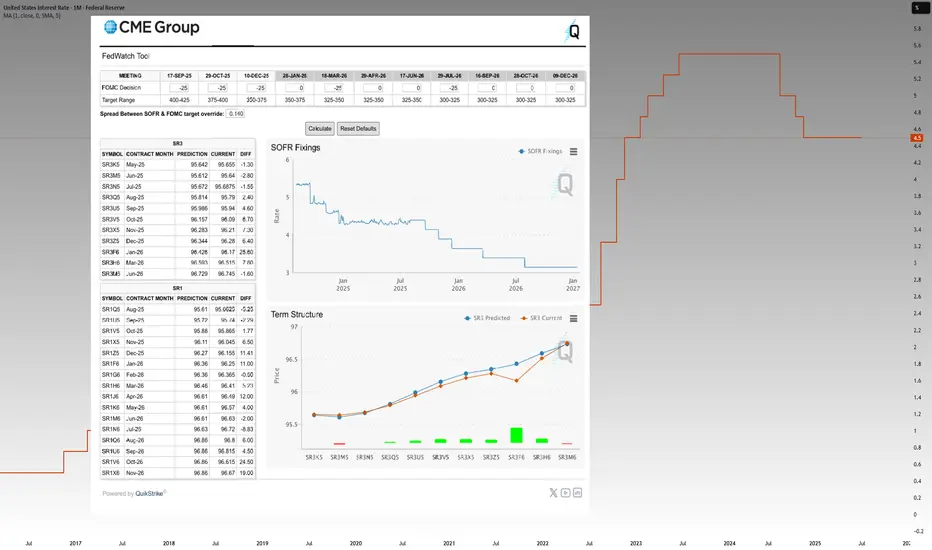
Dovish Spells or Hawkish Surprises? FOMC Prep for ES, NQ, GCLet’s start with the biggest event this week. Unless, of course, some unexpected headline swoops in and steals the spotlight — because markets love a good plot twist.
Emotions are running high, and volatility is flying around like confetti at a surprise party nobody asked for. But don’t worry, Chair Powell might just play the role of the calm voice in the chaos.
Markets are pricing in a 25 bps rate cut by the Fed this week. Interestingly, the future path of rate cut expectations has been in the doldrums. Is it a bird or a plane? No, it’s Superman. Likewise here, is it 1 cut or 2 cuts? No, it’s 3 cuts priced at this moment until the end of 2025.
Excuse the humor, but what fun is it if you cannot entertain yourself while analyzing the complexities of markets day in and day out. Execution is boring; risk management is much like dementors sucking out life force when risk is not respected. And analyzing and preparation is where the creativity and fun is.
And as Kurt Angle would say, it is “ True ”.
Index futures including ES futures and NQ futures have all climbed steadily higher since September 2 low. Markets are turning higher in anticipation of a new bull run.
Gold futures are rallying, currently trading above $3700. Since the Jackson Hole dovish pivot, gold has not looked back and has rocketed higher above major resistance.
Our focus is on the Fed meeting. All eyes will be on the forward guidance; risks to inflation, risks for the labor market and FED’s SEP (Summary of Economic Projections). This also includes GDP forecasts and the most anticipated Dot Plot.
Which of the two mandates will the Fed prioritize, labor market weakness or sticky inflation? The interesting thing to note is that despite sticky inflation, markets are anticipating 3 cuts of 25 bps for each of the meetings this year.
Thus far, as we have previously mentioned, the Fed will likely be moving away from their 2% inflation target to an average inflation target in the range of 2% to 3%.
This also implies that real rates i.e., nominal less inflation are going to fall sharply lower.
Given this, we anticipate gold to continue higher as the US Dollar's purchasing power erodes away, with mounting debt, higher inflation and falling real yields.
The real question we should be asking is:
What if the meeting outcome is hawkish with the Fed delivering just 1 cut in the September meeting and staying on hold for the remainder of the year?
What other risks are there that could pull stocks and indexes lower? And bonds higher?
Tariffs at this point seem like an old talk unless something reinvigorates and puts them on the front and center of market worries.
Based on these thoughts, here are our scenarios:
Base Case:
25 bps cuts and dovish guidance but iterates meeting by meeting approach.
ES & NQ:
Data dependent Fed, that is likely behind the curve and markets may translate this as Fed too slow to react to emerging risks, risks of recession goes higher. In this case, although stocks may push higher with rates coming down initially, in our view, much of this is priced in and this may be ‘sell the fact moment’.
Portfolio adjustment: Sell index futures, Buy Gold and Bonds.
Ultra-Dovish:
Fed’s dot plot confirms 2 additional rate cuts of 25 bps for Oct and Dec meeting and further 4 cuts till end of 2026 to bring terminal rate lower to 250-275.
USD weakens further, real rates sink, reinforcing gold bid.
Portfolio adjustment: Buy everything. Buy the dip.
Hawkish Surprise
Only 25 bps in September, then pause
ES & NQ:
• Sharp pullback as equities reprice for tighter liquidity.
• ES could retrace recent gains, downside risk toward 4,900–5,000 zone.
• NQ likely hit harder due to tech sensitivity to discount rate.
GC:
• Short-term correction as USD firms and yields spike.
• However, downside may be limited if market shifts focus back to debt & long-term inflation risks.
Risk-Off External Shock- Geopolitical event, tariffs
ES & NQ:
• Drop as risk sentiment sours; defensives outperform growth.
• Bonds rally, yields fall, curve steepens if Fed cut expectations accelerate.
GC:
• Strong safe-haven bid, spikes higher regardless of Fed stance.
Comment with your thoughts and let us know how you see the markets shaping up this week
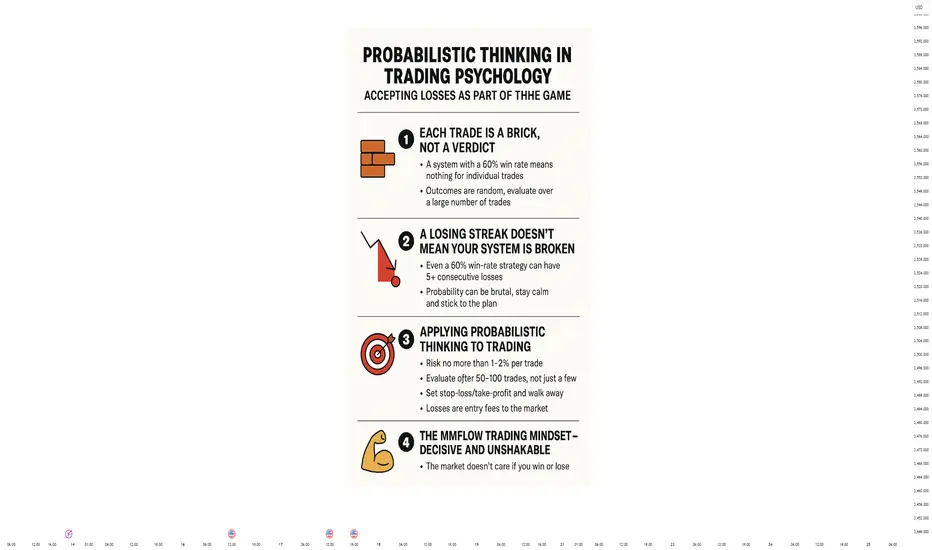
Think in Probabilities, Trade Like a Champion⚡ Probabilistic Thinking in Trading Psychology: Accepting Losses as Part of the Game
Trading psychology separates successful traders from those the market eliminates. In Forex and Gold trading, many lose not because their strategy is weak but because they fail to accept the reality of probability. Every trade is just one sample in a long statistical series—nothing more, nothing less.
🧠 1. Each Trade Is a Brick, Not a Verdict
A system with a 60% win rate sounds impressive. But that percentage only matters over a large number of trades. For individual trades, the outcome is random.
Example: An MMFLOW trader places 100 trades, risking 1% per position. After losing 6 in a row, he remains calm: “These are just 6 steps in a 1,000-step journey.”
During NFP news, Gold drops 300 pips. An inexperienced trader abandons their plan after two stop-loss hits. A professional sticks to the system because probability needs time to show its edge.
📊 2. A Losing Streak Doesn’t Mean Your System Is Broken
Even a 60% win-rate strategy can experience 5–7 consecutive losses. That’s the ruthless yet fair nature of probability. Traders without probabilistic thinking panic, break discipline, or abandon their edge prematurely.
Example: A breakout system shows long-term profitability. After 10 trades, it loses 7 times. A weak-minded trader quits. A seasoned trader stays the course and wins 20 out of the next 30 trades—recovering all losses and more.
🚀 3. Applying Probabilistic Thinking to Forex/Gold Trading
Rock-solid risk management: Risk no more than 1–2% per trade to survive losing streaks.
Long-term evaluation: Judge your system after 50–100 trades, not just a handful.
Non-negotiable discipline: Set stop-loss/take-profit and walk away—emotions don’t press “Close.”
Trading journal: Record outcomes and emotions to identify cognitive biases.
Warrior mindset: Losses are entry fees to the market, not personal failures.
💪 4. The MMFLOW Trading Mindset – Decisive and Unshakable
The market doesn’t care whether you win or lose. The only thing that matters is keeping your statistical edge long enough to let it work. Professionals:
Stay calm through losing streaks.
Refuse to “revenge trade” when emotions flare.
Stick to the plan because 500 trades will speak louder than 5.
📈 5. Conclusion – Mastering Trading Psychology
In Forex and Gold, probabilistic thinking is the shield that protects your mindset. Accepting losses as part of the game helps you:
Reduce emotional pressure and avoid impulsive decisions.
Maintain discipline and effective risk management.
Leverage your system’s long-term edge for sustainable account growth.
Master TradingView Like a Pro – Tools, Alerts, and Hidden Gems!Are you really using everything TradingView has to offer?
In this video, I’m breaking down 8 powerful features inside TradingView that most traders don’t fully use — even though they can save time, improve your analysis, and help you catch better setups.
Here’s what I’ll walk you through step by step:
✅ How I use Drawing Tools to map market structure
✅ Why I rarely use indicators — but why you should still know them
✅ How to scan markets fast using the Screener & Heatmap
✅ The right way to use the Economic Calendar and avoid news traps
✅ The feature I use daily: Price Alerts (a total game changer)
✅ How to practice with zero risk using Paper Trading
✅ Using Multi-Chart Layouts to watch multiple timeframes
✅ And finally — how the TradingView Community helped me grow and connect
Whether you're just getting started or already experienced — this video is packed with value.
Watch it till the end, and if you find it helpful — like, comment, and share it to support my work!
Best, Arman Shaban

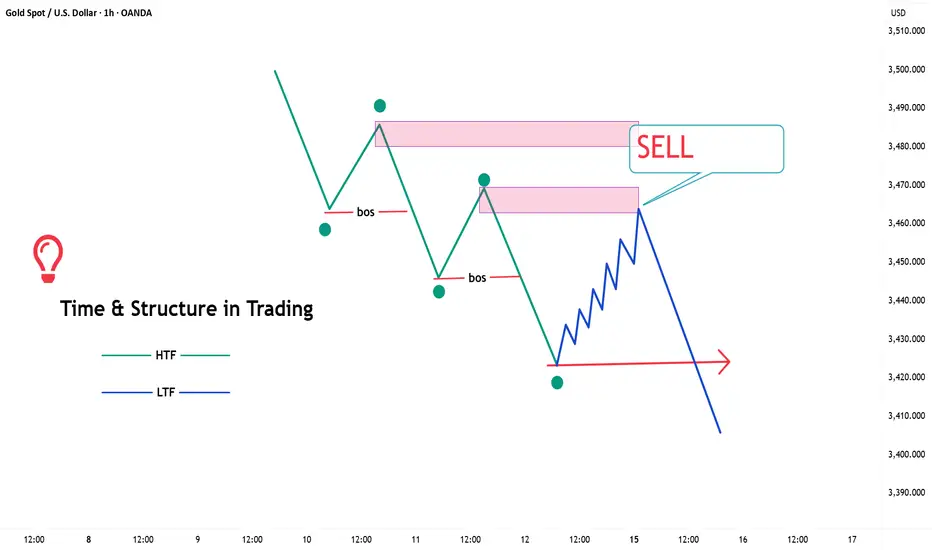
The Secret Formula: Time + Structure = 80% Win Rate!Hello everyone,
If you’re struggling to combine Time (multi-timeframe analysis) and Structure (market framework) to build a solid foundation for predicting what’s likely to happen in the market, this post will reveal the secret many professionals use — with up to 80% win probability!
1. The Core Mindset – Time & Structure
Every timeframe speaks a different language:
- H4, D1 = the bigger picture (overall trend).
- M15, M5, M1 = the micro view (entry signals, internal flow).
The key is: never rely on one timeframe alone – always align them.
2. POI – Points of Interest
- Each timeframe has its own POI (Points of Interest).
- Example: When you find a POI on H4 , don’t rush in.
Zoom into M15 or M5 to see what’s happening inside that zone.
3. Multi-Timeframe Alignment – The Smart Money Way
For example:
- H4: Price taps into a demand zone.
- M15: Structure shifts from bearish → bullish inside that demand zone.
This means H4 is preparing for a rally, and M15 confirms your BUY entry with higher precision.
When multiple timeframes align in the same direction, your probability skyrockets.
4. Why Always Respect the Bigger Picture?
- LTF (Lower Timeframe) = just noise or details.
- HTF (Higher Timeframe) = the real storyline.
If M15 shows a BUY but H4 is strongly bearish, you’re fighting the market.
But if M15 and H4 point the same way , you have a High Probability Setup .
5. Keys to High-Probability Trading
Identify the higher timeframe trend (H4, D1).
Mark strong POIs.
Drop to lower timeframes (M15, M5, M1) to watch for structure shifts.
Only trade when Time & Structure are aligned.
Always manage risk – place SL beyond OB/POI zones.
6. Final Takeaway
High-probability trades appear when multiple timeframes confirm the same direction.
Don’t trade on gut feeling — let Time + Structure guide you, just like Smart Money does.
Gold’s Relentless Rally: Hard Lessons Every Trader Must Face💥This past week, Gold surged without a single technical pullback. The rally was so sharp and one–sided that many traders who were holding Sell positions had no chance to exit safely. The result? Blown accounts, heavy drawdowns, and a painful reminder of what happens when we ignore risk.
📉 When the Market Ignores Technicals
Technical Analysis (TA) works—until the market decides otherwise.
In periods of aggressive flows, patterns, indicators, and even trendlines can fail completely.
At such times, the only thing that separates survivors from blown accounts is risk management and discipline.
🔑 Trading Lessons You Can’t Afford to Ignore
1️⃣ Stop Loss is your life jacket – Without it, one wrong move can sink your entire capital.
2️⃣ Never hold onto losing trades hoping for a reversal – The market doesn’t care about your hopes.
3️⃣ Capital management is more important than perfect analysis – One bad trade should never define your future.
4️⃣ Accept losses to survive – The best traders aren’t always right, but they always live to fight another day.
💡 A Message to Every Trader
Last week’s move in Gold taught us one brutal truth:
👉 No discipline = No capital.
👉 No capital = No trading career.
If you’ve taken heavy losses, don’t let it break you. See it as a turning point to rebuild with stronger rules and discipline. Markets will always offer opportunities, but only for those who protect themselves first.
✅ Final Takeaway
This week, don’t just stare at charts—revisit your trading plan and strengthen your discipline.
Remember: discipline may not make you rich overnight, but it will keep you alive long enough to get there.
Best Trading Confirmation. Learn 95% Accurate Entry Signal
I have analyzed 1300 forecasts and signals that I shared on TradingView last year and found 95% accurate trading confirmation.
In this article, we will discuss multiple types of confirmations and their winning rate on Forex, Gold, Indexes, Crypto & Commodities.
First, let me introduce you to the types of analysis that I provided.
1 - Structure based forecast
I have shared more than 55 trading setup with key levels analysis:
Where the price is approaching a key daily horizontal support and resistance.
Here is the example of such a post.
Test of a key horizontal or vertical support/resistance turned out to be a poor trading signal.
Total accuracy of structure based forecasts is 38%.
Please, note that if we consider the market trend in our calculations,
the trend-following structure based setup will be 42% accurate, while a performance of a counter trend setup drops to 35%
2 - Structure breakout based forecast
I analyzed and posted 73 posts with a key structure breakout as a confirmation on a daily.
Above is the example of a such a forecast.
Key levels breakout turned out to be a strong bullish or bearish confirmation with 59% accuracy.
Trend direction did not affect the efficiency of a key structure breakout that much, with a 60% accuracy of a trend following setup versus 57% of counter trend.
3 - Structure based forecast with a single intraday confirmation
I shared more than 500 setups with a test of a key structure on a daily and a single price action based bullish or bearish confirmation on a 4h/1h time frame.
My intraday confirmation is a formation of a price action pattern with a consequent breakout of its neckline/trend line in the projected direction.
Please, check the example of such a signal.
Just a single intraday confirmation dramatically increases the accuracy of a structure based setup.
Average winning rate is 66%.
4 - Structure based forecast with multiple intraday confirmations
I spotted and posted 200+ forecasts with a test of a key structure on a daily and multiple price action based bullish or bearish confirmations on a 4h/1h time frame.
Multiple confirmations imply the formation of multiple price action patterns on 4/1h t.f.
Here is the example of such a setup on EURGBP.
Two or more confirmations on a key structure increase the average winning rate to 72%.
Among multiple confirmations, I found a 95% accurate bearish signal:
The market should be in a bearish trend.
The price should test a key daily structure resistance.
The market should form a rising wedge pattern on a 4h/1h time frames and the highs of the wedge should strictly test the key structure and should not violate them.
After a test of structure, the price should form a bearish price action pattern on the highs of the wedge.
Above is a setup with the best trading confirmation.
A bearish breakout of the neckline of the pattern and a support of the wedge was a 95% accurate trading signal last year.
Of course, there are various confirmations, depending on a trading style. The ones that I shared with you are structure/price action based.
And I am truly impressed by their accuracy.
❤️Please, support my work with like, thank you!❤️
I am part of Trade Nation's Influencer program and receive a monthly fee for using their TradingView charts in my analysis.
6 Best Tips for Small Trading Accounts (Forex, Gold)
This useful trading tips will help you to efficiently start trading with a small trading account.
A quick note: by a small account, I mean an account size from 10$ - 2000$.
1 - Trade less often
Small account implies a limited amount of money for trading. It means that among dozens of trading opportunities that you spot during a trading day, you should carefully pick only the most promising ones.
I recommend opening maximum 3 trades per day.
2 - Stick to one strategy
One of the ways to trade less frequently is to stick to one single trading strategy. Most of the traders do completely opposite: instead of focusing on one approach, they prefer to trade multiple ones simultaneously.
Trading various strategies requires a lot of capital. The more strategies you follow, the more margin is needed.
With a small trading account, you are risking being left without a free margin for all the trading opportunities that the strategies provide.
3 - Trade liquid instruments with low spreads
When you are picking the financial instruments for your trading, make sure that you select the most liquid ones. You can assess the liquidity of the instrument by a spread. The bigger is the spread, the less liquid is the asset.
Take a look at a spread difference between EURUSD and CHFJPY.
The spread on EURUSD is 0.1 pip.
While the spread on CHFJPY is 2.7 pips.
Spreads directly affect the costs of trading. Bigger spreads reduce the potential profits and increase the risks.
Make sure that you choose the assets with the lowest spreads possible.
4 - Shorten the list of trading instruments
One more option to trade less often is to narrow down the list of your trading instruments. I recommend choosing the maximum of 7 instruments.
7 USD Major Forex Pairs:
EURUSD,
GBPUSD,
USDJPY,
USDCAD
NZDUSD
AUDUSD
USDCHF
is a perfect watch list for a small account trader.
5 - Don't trade higher time frames
Be careful when deciding a time frame to trade.
Remember that the higher is the time frame, the bigger are the stop losses for your traders.
On the left chart is the swing trade that I took with my students on EURUSD chart on a daily. While on the right is the scalping trade taken on 30 minutes time frame.
A stop loss for swing trade is 90 pips and a stop loss of scalping position is 19 pips.
Big stop losses require more free margin and limit the amount of the trades that you can take simultaneously.
For that reason, prioritize lower time frame trading with a small trading account.
6 - Don't risk more than 2% per trade
When traders trade with a small trading account, they often risk a huge portion of their trading account per a single trade.
If you have 100$ trading account, and you risk 20$ per trade, the nominal value of that risk does not look huge. But from a percentage standpoint, it is 20% of the total balance.
Just a 5 trades losing streak will blow such an account.
Make sure that you apply a position size calculator and risk no more than 2% of your account per trade.
Following these recommendations, you will be able to build an effective trading plan that will help you to grow your capital quickly.
❤️Please, support my work with like, thank you!❤️
I am part of Trade Nation's Influencer program and receive a monthly fee for using their TradingView charts in my analysis.
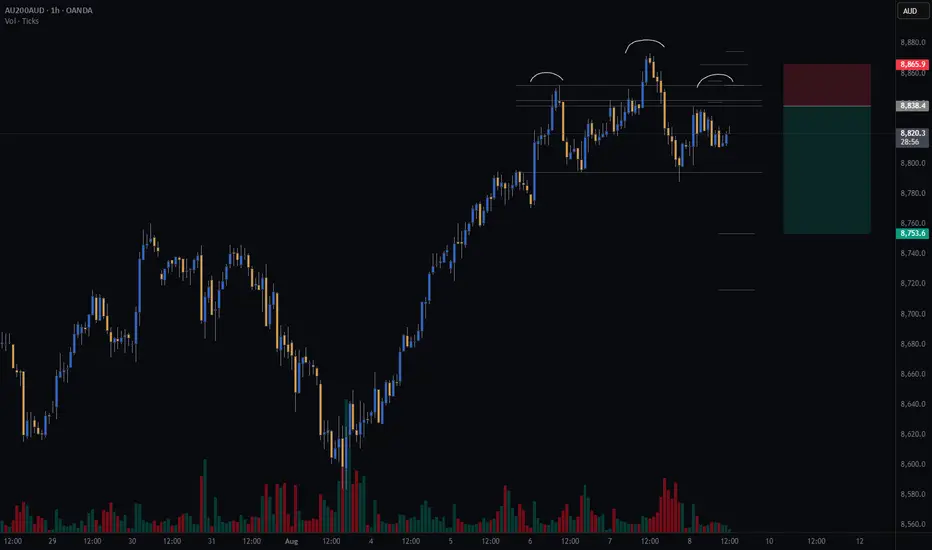
Watching for a Head & Shoulders on AUS200Watching AUS200 for a potential short setup — possible head and shoulders on the hourly chart. Left shoulder and head complete; waiting to see if right shoulder forms to confirm.
All my setup variables are met so far.
#GTradingMethod calculates take profits using the distance between the head’s peak and neckline, projected downwards.
Risk/Reward: 3.4
Entry: 8838.3
Stop Loss: 8865.8
TP1 (50%): 8753
TP2 (50%): 8716
Join the journey, what are your guys and girls thoughts on how to trade a head and shoulders, and does anyone track the AUS200?
Disclaimer: Please note, this is not financial advice. This content is intended to track my trading journey and for educational purposes only
Crude Oil: Equilibrium, Key Levels & Trade ScenariosNYMEX:CL1! NYMEX:MCL1!
Market Recap
In our prior crude oil commentary, we identified a bullish flag formation with key support anchored at the Q3 micro composite Value Area Low. Following a measured pullback, prices decisively reclaimed the Q3 micro composite Value Area High, subsequently advancing toward the $70 level. However, this upward momentum proved unsustainable, with prices unable to maintain higher ground. We have since retraced to the yearly open, where the market is now consolidating.
Current Market Structure
Crude oil is presently exhibiting a balanced profile. Notably, the composite Volume Points of Control (VPOC) for both the yearly and quarterly profiles are overlapping — a technical signal indicative of equilibrium in positioning.
Market Performance Assessment
Price action in recent sessions has been heavily influenced by shifts in the global demand outlook, which in turn remain sensitive to macroeconomic expectations, geopolitical events, and OPEC+ V8 members’ gradual unwinding of voluntary production cuts. Despite the prevailing headwinds — including tariff disputes, Russian sanctions, and broader trade tensions — crude oil has demonstrated resilience, consistently trading above the $65 threshold.
Forward Outlook
Attention will turn to today’s EIA release at 9:30 a.m. CT, which may serve as the primary catalyst for near-term directional bias.
Key Technical Levels
• Q3 mCVAH: 67.28
• Neutral Zone: 66.45 – 66.30
• Yearly Open: 66.34
• Intermediate Support: 65.80
• CVPOC / mCVPOC: 65.54
• Q3 mCVAL: 64.95
• Support Zone: 65.00 – 64.80
Trading Scenarios
• Scenario 1 — Yearly Open Rejection
Monitor the Yearly Open (66.34) as an initial resistance level. A rejection here could prompt a tactical pullback toward the Line in the Sand (LIS), offering long entry opportunities with a target above the yearly open.
• Scenario 2 — DOE-Driven Flush & Recovery
Should the DOE data trigger a downside push, watch for a swing failure at recent lows. A close back above prior levels would present a potential long setup, with conviction increasing on sustained price action above 65.80.

Markets Eye Policy, Positioning, and PerformanceCME_MINI:NQ1! CME_MINI:ES1! CME_MINI:MNQ1! COMEX:GC1! FRED:FEDFUNDS
Happy 4th of August, Traders!
As we head into the new week, here’s a look at what’s on the calendar:
Key Economic Data Releases
Monday:
• Factory Orders (MoM) – June
• Supply: 3-Month Bill Auction, 6-Month Bill Auction
Tuesday:
• Trade Balance (June), Exports (June), Imports (June)
• S&P Services PMI (July), ISM Non-Manufacturing PMI (July)
• Atlanta Fed GDPNow (Q3) – Prelim
• Supply: 52-Week Bill Auction, 3-Year Note Auction
Wednesday:
• German Factory Orders (MoM) – June
• Crude Oil Inventories
• FOMC Member Daly speaks at 11:45 CT
• Fed Governor Cook speaks at 1:00 CT
• Supply: 17-Week Bill Auction, 10-Year Note Auction
Thursday:
• Bank of England Interest Rate Decision
• BoE MPC Meeting Minutes, Inflation Letter, MPC Vote
• BoE Governor Bailey speaks at 8:15 CT
• FOMC Member Bostic at 9:00 CT
• Supply: 30-Year Bond Auction
Crude Oil Update
OPEC+ V8 members have announced an additional 547K bpd unwinding of voluntary cuts. Notably, crude prices have not reacted significantly to the expected OPEC+ figures. As we’ve previously highlighted, the market's focus remains firmly on demand-side factors. Despite geopolitical shocks, trade tensions, and recession concerns, crude oil prices have remained relatively stable—trading within a consistent range for over two and a half years since August 2022. According to Amena Bakr at Kpler, the V8 will meet again on September 7th to potentially reassess the reinstatement of 1.65 million bpd of cuts, currently scheduled to remain in place until the end of 2026.
Earnings Recap
With over half of S&P 500 companies having reported Q2 earnings, YoY earnings growth is now projected at 9.8%, compared to the 5.8% estimate as of July 1, per LSEG data cited by Reuters. More than 80% of reporting companies have surpassed analyst profit expectations—well above the 76% average from the past four quarters.
Macro Outlook
Fed Vice Chair Williams provided further insight into the central bank’s posture ahead of the September FOMC meeting, stating he remains open-minded but continues to believe that modestly restrictive policy is warranted. Williams also emphasized that the notable downward revisions to May and June payrolls were the key takeaway from Friday’s jobs report, reinforcing the theme of softening labor market momentum.
In addition, the Fed announced on Friday that Governor Lisa Cook will resign from the Board effective August 8. A replacement is expected to be named in the coming days, though it is not anticipated to materially alter the policy outlook in the near term.
Looking ahead, if both inflation and unemployment tick higher between now and the September FOMC meeting, it would represent a worst-case scenario for the Fed. The August NFP report due on the first Friday of September and July and August 2025 inflation reports are key data points to monitor before the next FOMC Meeting on September 17th, 2025.
Although equity futures sold off on Friday following a disappointing jobs report, market pricing has adjusted notably. Participants now expect the Fed to deliver three rate cuts in 2025 and two cuts of 25bps each in 2026. This marks a shift from pre-NFP expectations of two cuts in 2025 and three cuts in 2026, per CME FedWatch Tool.
Market Implications:
On the back of rate cut expectations, in our analysis, this may help sustain upside in the equities complex. Although, it may be prudent to adjust portfolio and re-balance strategically according to sectors that may continue to outperform namely tech, AI, defense stocks, commodities and USD per our analysis.
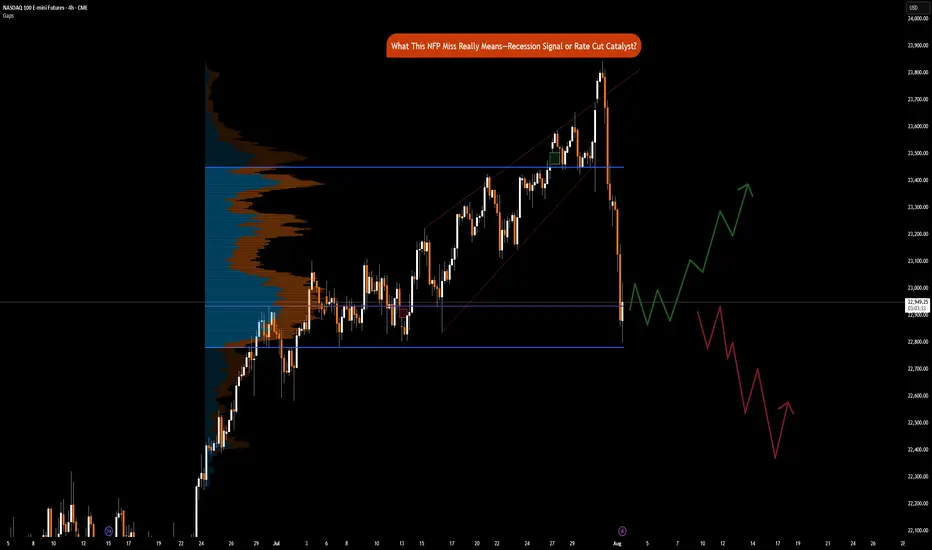
NFP Miss Implications: Recession Signal or Rate Cut CatalystCME_MINI:NQ1! CME_MINI:ES1! CME_MINI:MNQ1!
Happy Friday, folks!
Today is the first Friday of August, and that means the highly anticipated Non-Farm Payroll (NFP) numbers came in at 7.30 am CT.
US Non-Farm Payrolls (Jul) 73.0k vs. Exp. 110.0k (Prev. 147.0k, Rev. 14k); two-month net revisions: -258k (prev. +16k).
Other key labor market indicators were as follows:
• US Unemployment Rate (Jul) 4.2% vs. Exp. 4.2% (Prev. 4.1%)
• US Average Earnings MM (Jul) 0.3% vs. Exp. 0.3% (Prev. 0.2%)
• US Average Earnings YY (Jul) 3.9% vs. Exp. 3.8% (Prev. 3.7%, Rev. 3.8%)
• US Labor Force Particle (Jul) 62.2% (Prev. 62.3%)
Data and Key Events Recap:
What a year this week has been! It's been packed with high-impact economic data and pivotal central bank decisions, especially from the Federal Reserve. On top of that, trade and tariff announcements have dominated the headline.
U.S. economic data this week was broadly strong. Second-quarter GDP came in at 3.0%, beating expectations and signaling solid growth. The ADP employment report also surprised to the upside, printing 104K vs. the 77K forecast. Consumer confidence showed resilience as well, with the Conference Board’s reading rising to 97.2.
Inflation data was mixed but mostly in line. Core PCE for June rose 0.3% MoM, while the YoY reading ticked up to 2.8%, slightly above the expected 2.7%. The broader PCE Price Index also came in at 0.3% MoM, with a YoY print of 2.6%, slightly higher than forecast.
The Federal Open Market Committee (FOMC) voted to keep the federal funds rate target range unchanged at 4.25% – 4.50%. Notably, Governors Waller and Bowman dissented, favoring a 25-basis-point rate cut as expected, however, marking the first dual dissent by governors since 1993.
Changes to the FOMC Statement included a downgraded assessment of economic growth, reflecting slower real consumer spending. The Committee reiterated that uncertainty around the economic outlook remains elevated. It maintained its view of the labor market as "solid" and inflation as "somewhat elevated." Forward guidance remained unchanged, emphasizing the Fed’s readiness to adjust policy as necessary while continuing to monitor risks to both sides of its dual mandate.
Here’s a summary of key points from the FOMC press conference:
• On current policy stance:
“We decided to leave our policy rate where it’s been, which I would characterize as modestly restrictive. Inflation is running a bit above 2%... even excluding tariff effects. The labor market is solid, financial conditions are accommodative, and the economy is not performing as if restrictive policy is holding it back.”
Chair Powell commented on the need to see more data to help inform Fed’s assessment of the balance of risks and appropriate Fed Funds rate.
• On labor market risks:
“By many statistics, the labor market is still in balance... You do see a slowing in job creation, but also a slowing in the supply of workers. That’s why the unemployment rate has remained roughly stable.”
• On inflation and tariffs:
“It’s possible that tariff-related inflationary effects could be short-lived, but they may also prove persistent. We’re seeing substantial tariff revenue—around $30 billion a month—starting to show up in consumer prices. Companies intend to pass it on to consumers, but many may not be able to. We’ll need to watch and learn how this unfolds over time.”
Trade Headlines:
US President Trump announced tariffs on countries ranging from 10%-41%. Average US tariff rate now at 15.2% (prev. 13.3%; 2.3% pre-Trump), according to Bloomberg. US officials said that if the US has a surplus with a country, the tariff rate is 10% and small deficit nations have a 15% tariff, US officials said they are still working out technicalities of rules of origin terms for transshipment and will implement rules of origin details in the coming weeks. No details on Russian oil import penalty. Sectoral Tariffs White House said new reciprocal tariff rates take effect on Friday. Although Canada’s tariffs were increased to 35%, excluding USMCA goods, the effective rate is only 5%.
The economic data is showing strength, on the contrary, tariffs announcements for most countries have now been announced. Investors need to consider that tariffs are not just a tool to reduce trade deficit, it is also a geopolitical tool presently being used to shape alliances. The US wants to soften BRICS, China and Russian influence on the world stage.
Key to note is that these tariffs are substantially lower than what was announced on April 2nd, 2025.
The key question now remains, do participants buy the dip or ‘sell the fact’ is the current playbook?
Market Implications
Given the prior revisions in NFP data of -258K, July’s payroll came in at 73K, missing forecasts of 110K. What does this mean for markets? Markets are now pricing in 75% chance of a September rate cut. Prior revisions along with the current job market slowing down imply that risks to the downside are substantially increasing. Fed’s current policy is not just moderately restrictive but rather it may likely tip the US into a recession if Fed Funds rates remain elevated. The Chair asked to see more data, and here it is but I do wonder why they did not take this data into account for the July meeting. Surely, it would have been available to them.
Another question to ask would be, is it due to defiance of rate cut calls by the US administration? Is the Fed already behind the curve?
Fed’s dual mandate targets inflation and maximum employment. While inflation is sticky, the Fed may need to abandon their 2% mandate in favor of average inflation of 2.5% to 3%. A less restrictive policy will provide needed stimulus along with the fiscal stimulus provided via the BBB bill.
This drastically changes, in our analysis, how investors position themselves heading into the remainder of the year.
Markets (equities) may retrace slightly but the dip in our opinion will still be the play given weaker labor market data and increased rate cut bets. The bad news here means that the Fed has the data it wants to see to start cutting. Market pricing in 2 cuts seems to be the way forward for now.