XDC Update📊 XDC Update
XDC is currently retracing 🔄
If price continues to retrace toward the green zone, it could offer a potential long entry 🟢
Wait for confirmation before entering to ensure a strong reversal setup 📈
Tradingview

Bitcoin and a Critical Resistance for a Price Breakout | Day 3👋🏻 Hey everyone! Hope you’re doing great! Welcome to the SatoshiFrame channel.
✨ Today we’re diving into the 4-Hour Bitcoin analysis — stay tuned and follow along!
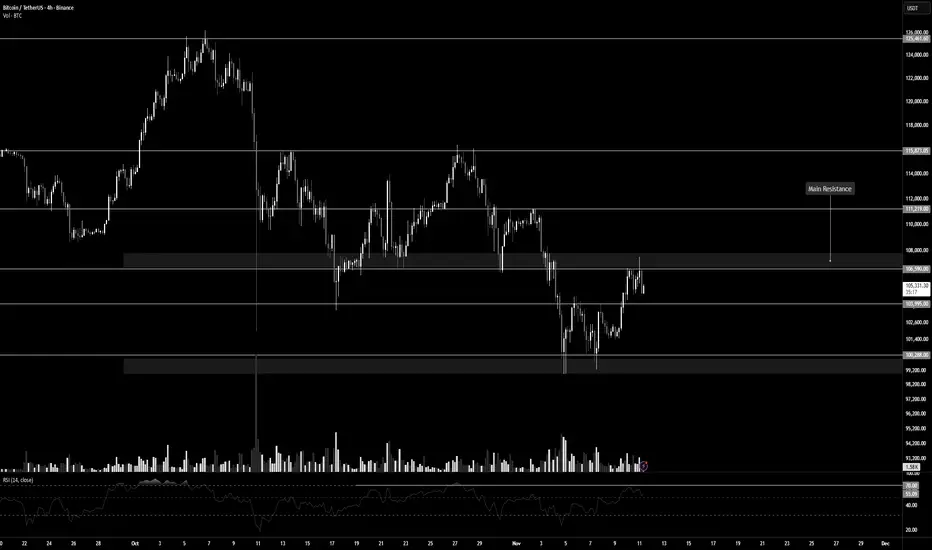
🪙 Bitcoin, in its 4-hour timeframe (as mentioned in previous analyses), is currently sitting below a major resistance level. A breakout above this area could trigger a strong bullish leg, potentially driving price toward forming a new ATH. The key resistance zone is around $106,590, and breaking it could lead to some beautiful market moves.
📊 The buying volume at this resistance is not yet sufficient. If we look closely, since the last touch of the maker-buyer zone at the lower part of the chart, volume has been declining. To break through this resistance, whale candles are needed to absorb all sell orders in the zone — this could lead to a short squeeze.
🧮 The RSI oscillator on the 4-hour timeframe has fluctuated several times below the 70 level, showing two rejections near that area. The 70 RSI level aligns with the $106,590 price resistance, and crossing above it could trigger a strong upward move.
✍️ You can read the possible scenarios for Bitcoin in the rest of the analysis, but since Bitcoin has shown reduced buying volume, it’s best to lower your risk exposure. If the breakout happens, you can reallocate remaining risk toward the next resistance levels.
✅ Long Position Scenario:
A confirmed breakout above $106,590, along with increased buying volume and the RSI surpassing 70, could form a solid long setup on the 4-hour timeframe. Make sure to gather proper confirmations before entering to ensure the best possible trade setup.
❤️ Disclaimer: This analysis is purely based on my personal opinion, and I only take trades when the stated triggers are activated.
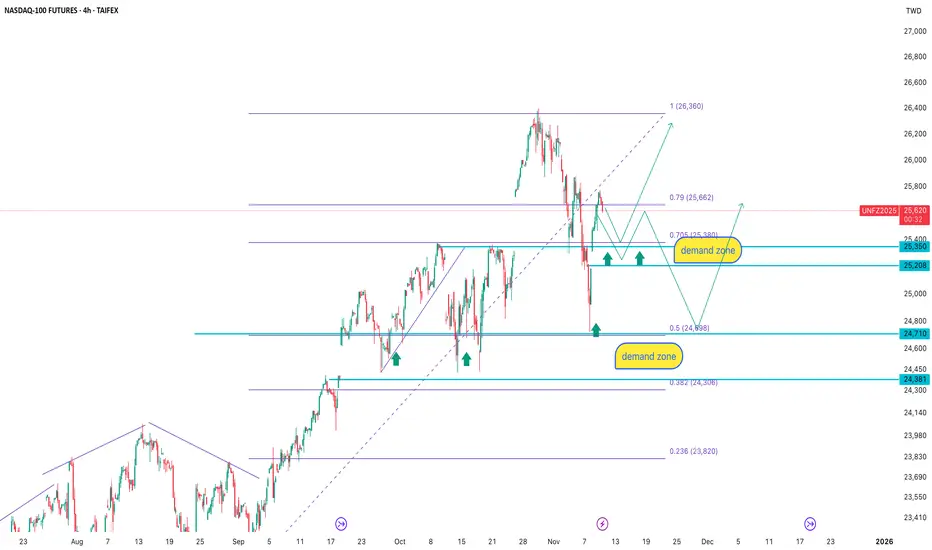
NASDAQ-100 4H: demand is not gone, only waiting for the priceAfter the recent upward impulse, the price retraced into the key demand zone at 25 350–25 208, an area that has repeatedly triggered buying reactions in the past. T
he latest correction pushed the price into the 0.79–0.705 Fibonacci range, which frequently acts as a retest zone before continuation.
Below that lies an even stronger demand zone at 24 710–24 381, aligning with the 0.5 Fibonacci level and previous volume accumulation.
The trading logic here is simple: don’t chase the move, let the price come to demand and wait for confirmation.
As long as the market structure holds, the primary scenario remains bullish from demand zones with a target toward 26 360 and potentially higher.
Fundamentally, NASDAQ remains supported by expectations of softer Fed policy, strong tech capital inflows, and continued investment in AI, cloud, and data-center infrastructure. Smart money accumulates on corrections, not on peaks.
When price falls into demand, it’s not fear — it’s opportunity.
StevenTrading – XAUUSD through Elliott's Perspective | Stick...⚡️ StevenTrading – XAUUSD through Elliott's Perspective | Stick to the trend, wait for a precise retest
Hello Trader 👋
📰 Fundamental Analysis
The White House indicates that October's CPI may not be released on time due to the shutdown impact; a series of data (NFP, CPI 10–11) remain uncertain in timing.
As a result, the market reduces risk appetite, safe-haven flows keep gold steady, but thin liquidity → prone to two-way swings.
→ This week, prioritize the main trend which is up, but wait for a retest before entering trades.
📊 Technical (H3/H4) – Elliott & S/R, Trendline
Elliott: Wave 5 up has hit resistance 4,150–4,162 and shows signs of an ABC correction.
Key level: 4,075 (support box – point A on the chart). Staying above here, the upward structure remains.
The H4 uptrend line still supports the price, deeper areas around 4,040–4,043 are potential “point C” if a strong correction occurs.
Important zones:
Resistance: 4,150 – 4,162 – 4,185
Support: 4,108 – 4,076 – 4,063 – 3,986
🎯 Trading Scenario (reference)
🟢 Buy following the trend (priority)
Buy #1: 4,076–4,078 · SL 4,070 · TP 4,088 → 4,102 → 4,125 → 4,140
Logic: Retest Key 4,075 + maintain trendline ⇒ bounce with the main trend.
Buy #2: 4,040–4,043 · SL 4,036 · TP 4,060 → 4,075 → 4,094 → 4,125
Logic: “Point C” of the ABC wave + lower trendline edge; buy in high liquidity zone.
🔴 Reactive Sell (short scalp)
Sell zone: 4,121–4,124 (branch B of ABC) · SL 4,128 · TP 4,110 → 4,098
Note: Only enter when M15–M30 shows clear rejection (pin/engulf, false break). Do not hold overnight.
⚠️ Risk & Invalidation
Invalidation of buy setup: H4 candle closes below 4,063 (losing mid-support) or deeper < 3,986 → pause longs, wait for a new structure.
Invalidation of sell setup: H4 closes above 4,162 (clearly surpassing resistance), especially holding above 4,150 after retest → stop selling, switch to waiting for a pullback to buy.
Risk management: maximum 1%/trade; do not chase prices in between zones, prioritize orders in identified zones.
Wishing you successful trading.

Is having a stop loss on Bitcoin embarrassing?Is having a stop loss in the crypto market embarrassing? This isn't just a question—it's a new trading style that's become trendy and has pulled the culture of young crypto traders right into its orbit... a culture without responsibility that wants to escape reality and market principles, chasing higher profits and loftier positions. A culture where 5% monthly profit is laughable to them, and they won't settle for anything less than 50% to 100% gains.
Let's see what happens to this minority in just the past few weeks with this ideology: On October 10, a 16% drop (they get liquidated and wiped out of the market). On September 22, with that long squeeze candle, a 4.30% drop (wiped out for the second time). On November 3 and 4, a 10% drop (wiped out for the third time :))
That said, a huge crowd usually floods the market right before accumulation phases or trend changes (when big investors need liquidity), and after supplying that liquidity, they get wiped out too... I haven't found a precise indicator yet for when these folks show up—if you've got one, comment below; maybe I'll write a script for it myself. But the point is, after these people get liquidated, we usually enter an accumulation phase, followed by a trend reversal. Long squeeze and short squeeze candles are great examples for spotting these crowds, and then you can expect ranging, followed by the trend change.
In the 4H timeframe, we've relatively shifted the range—hopefully forming a higher high and higher low above 104,862.71 . A break of 106,542.82 in the 4H timeframe could be our first trigger for a trend change in this leg. But the main trigger is breaking the resistance at 111,287.45, since this resistance is what triggered the reaction that formed the lower low at 100,503.60—so it's hugely important, and breaking it would put Bitcoin back into uptrend mode.
+ The probability of the US government shutdown ending has hit 84% on Polymarket. Actually, that's what drove the growth in recent days... You might think it's weird—like, shouldn't we grow after good news? I say no, the market moves based on expectations, not news or anything else... Does the expectation say the US government will reopen? Okay, let's grow—that's it.
+ A super important point: Trump officially announced that every American (except high earners) will get $2,000. Something like those stimulus checks during COVID in 2020! Remember that?
And what I'm saying here impacts daily and weekly timeframes, not 4H... So if you're trading in lower timeframes, no need to pay attention to this stuff—per your strategy, if it signals long, open long; if we dump from here and go below 104k, hunt for shorts :) Easy.
If you like these multi-faceted, educational analyses, definitely follow—it's crazy we're still under 1,000. We need a bigger community to pull off even bigger things. Thanks for your attention—till next time, peace out.

Bitcoin Below a Key Resistance – Day 2👋🏻 Hey everyone! Hope you’re doing great! Welcome to SatoshiFrame channel.
✨ Today we’re diving into the 1-Hour BITCOIN analysis. Stay tuned and follow along!
🪙 On the 1-hour timeframe, Bitcoin is currently ranging below its key resistance zone at $106,590 in a multi-timeframe structure. A confirmed breakout above this level could potentially lead to further bullish momentum toward the next resistance area.
📊 Looking at Bitcoin’s volume, we can see that as price reached this crucial resistance, volume has decreased, showing more selling interest among traders. However, the interesting observation here is that even selling volume itself has slightly declined, and during the latest reaction to this resistance (in the 15-minute multi-timeframe), we witnessed an increase in buying volume.
✍️ The possible breakout scenario for this resistance is quite simple and comes with a small stop-loss range. You can consider entering a trade based on this scenario, but always remember proper risk and capital management.
↗️ Long Position Scenario 1 : Breakout above the $106,590 resistance accompanied by increasing buying volume on either the 1-hour or 15-minute multi-timeframe. If we get a candle setup (Indecision + SMA7) before and after the breakout, it can serve as a valid entry signal.
↗️ Long Position Scenario 2 : Breakout above the $106,590 resistance with rising volume and the formation of a higher low on the multi-timeframe compared to the previous low. In this case, we can enter a long position and set the stop-loss below the potential higher low.
❤️ Disclaimer : This analysis is purely based on my personal opinion and I only trade if the stated triggers are activated .

GOLD BUY Gold buying opportunity for a good price increase to the upside, will wait claim and use a buy limit to catch the trade

EURJPY BUY THE TREND Will be using a buy limit to enter a buy on Eurjpy and will be keeping things simple with the trend following , very good trade and low risk higher chance to buy than sell

StevenTrading – XAUUSD continues to follow the bullish scenario⚡️ StevenTrading – XAUUSD continues to follow the bullish scenario
Hello Trader
📰 Fundamental Analysis
Gold prices opened higher in Europe as concerns about the U.S. economic health boosted safe-haven demand.
The Senate reached a temporary agreement to end the government shutdown, reducing systemic risk but not eliminating defensive cash flows.
→ This week's bias remains upward, prioritizing trades in line with the main trend.
📊 Technical
Breakout confirmed: the 4.035 zone has been clearly broken, prices closed above and are forming a retest of the 4.035–4.045 box.
The H4 uptrend line holds firm, acting as a “support base” for the continuation scenario.
Key areas:
Support: 4.035–4.045 (retest box), 4.006–4.010 (secondary support along the trendline).
Resistance: 4.077–4.100 (near supply), 4.150 (resistance/candlestick & psychological), 4.225–4.292 (higher resistance).
🎯 Trading Scenario (for reference)
🟢 Buy with the trend – prioritize when retest holds firm
Entry: 4.043–4.045
SL: 4.039
TP: 4.077 → 4.100 → 4.150 → 4.225
Logic: Pullback to the 4.035–4.045 box + holding above the trendline ⇒ continuation to upper supply zones.
Customization: if the market retests deeply to 4.035–4.038, only consider entry when M30 shows a clear rejection signal (pin bar/engulf) and volume supports.
🔴 Reactive sell – only short scalp at resistance
Zone: 4.150
SL: 4.156
TP: 4.125 → 4.100
Note: Only enter with clear rejection on M15–M30; do not hold overnight when the major trend still supports an increase.
⚠️ Risk & Invalidation
Invalidation of buy setup: H4 candle closes below 4.035 (losing retest box); especially below 4.006 (breaking secondary support/trendline) ⇒ pause long, wait for new structure.
Invalidation of sell scalp setup: H4 closes above 4.156/holds 4.150 ⇒ stop selling, wait for pullback to buy.
Risk management: ≤ 1%/trade; enter/exit according to plan, do not chase prices within the zone.
—
This article reflects the personal views of StevenTrading. If you find it useful, please Like & Comment so I can update the plan daily.

LiamTrading – XAUUSD | Early Week Bullish Scenario...LiamTrading – XAUUSD | Early Week Bullish Scenario: Successful Breakout, Awaiting Retest at 4056 & Deep Buy at 3998–4000
The price has just broken out of the accumulation box and accelerated as per the weekend scenario. Bullish bias for the day, with a near-term target of 4080 → 4110; the 4110–4112 zone is a suitable psychological resistance for scalping. Prioritize buying at the 4056 retest or deep buying at 3998–4000 after a liquidity sweep and rebound.
The U.S. Senate takes further procedural steps to end the shutdown. Systemic risk expectations cool down → pressure on USD decreases, supporting gold in the short term.
The process has a few steps left, volatility around news hours can be sharp → adhere to technicals, manage risks tightly.
Technical Analysis (H1/H2) – Volume Profile • Trendline • S/R • Fibonacci
Structure & Trendline: Breakout upwards, trend-following capital dominates. Short-term uptrend as long as price holds above 4056 (retest point of breakout zone).
Support/Resistance (S/R):
Support: 4056 (retest), 4025–4038 (FVG filling liquidity), 3998–4000 (Buy Zone Liquidity).
Resistance: 4110–4112 (psychological + short-term supply cluster), 4160–4165 (Fibo extension).
Fibonacci Extension:
1.618 coincides with 4110–4112 → likely reaction/scalping.
2.272 targets ~4160 → extended target/final profit-taking.
Today's Trading Scenario
Continuation Buy (priority)
Entry: 4056–4060 (retest breakout zone)
SL: 4048
TP: 4080 → 4110 → 4160
Management: Move SL to breakeven at +1R; partial take at 4080/4110.
Deep Liquidity Buy (cautious volume)
Entry: 3998–4000
SL: 3992
TP: 4020 → 4045 → 4080 → 4110
Note: Enter only with clear rejection candle (long lower wick, M1–M15 reversal) or after FVG fill and rebound.
Scalp Sell at Psychological Resistance (counter-trend)
Entry: 4110–4112
SL: 4118
TP: 4100 → 4080 → 4065
Note: Cancel trade if H1 closes strongly above 4112 or if bullish momentum is too strong (breakout with volume).
Invalidation Conditions & Notes
Short-term bullish bias invalidated if H1 closes below 4048 → may test deeper 4025–4038 or 3998–4000.
Avoid entering trades close to news hours about the U.S. government reopening process.
Risk per trade: 0.5–1%, adhere to discipline of moving SL at +1R.
If you find this useful, comment on the price levels you're watching and hit Follow on LiamTrading for daily updates.

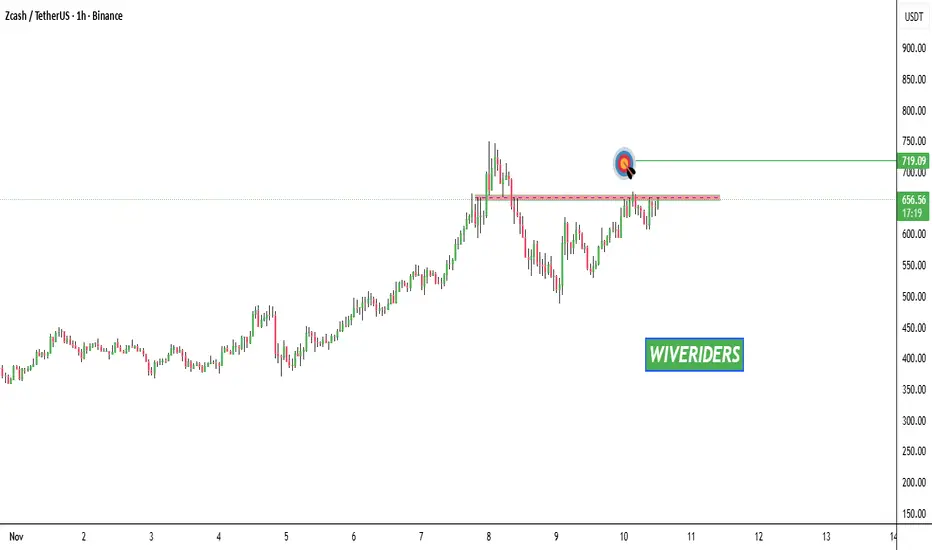
$ZEC Update📊 CRYPTOCAP:ZEC Update
CRYPTOCAP:ZEC is testing the red resistance zone 🔴
If it breaks out above, it could confirm a bullish setup 📈
The first target would be the green line level 🟢
$VIRTUAL Update📊 SPARKS:VIRTUAL Update
SPARKS:VIRTUAL is testing the red resistance zone 🔴
If it breaks out above, it could confirm a bullish setup 📈
The first target would be the green line level 🟢

TRUST Update📊 TRUST Update
TRUST is testing the red resistance zone 🔴
If it breaks out above, it could confirm a bullish setup 📈
The first target would be the green line level 🟢

$STRK Update📊 NASDAQ:STRK Update
NASDAQ:STRK is testing the red resistance zone 🔴
If it breaks out above, it could confirm a bullish setup 📈
The first target would be the green line level 🟢

$UNI Update📊 CRYPTOCAP:UNI Update
CRYPTOCAP:UNI is testing the 🔴 resistance zone — a breakout could confirm a bullish setup 📈
If confirmed, first target is the 🟢 level —

Bitcoin at a Decision Zone – Day 1👋🏻 Hey everyone! Hope you’re doing great! Welcome to SatoshiFrame channel.
✨ Today we’re diving into the 1-Hour BITCOIN analysis. Stay tuned and follow along!
🪙 Bitcoin on its one-hour timeframe is currently within a trading range, and due to the holidays, both volume and volatility have dropped to their lowest levels. According to the analysis, an important resistance has formed around $103,912, and a micro buyer support around $100,288. Once either of these zones is broken, Bitcoin could provide a trading opportunity.
📊 Bitcoin’s volume on the one-hour timeframe has now reached its lowest level, indicating that we are close to a potential move. This suggests possible upcoming volatility. As for the micro buyer floor, this level is crucial for buyers — when price reaches it, buying volume typically increases. To break this zone, it would require significant selling volume and large whale candles to overcome the long-biased traders.
🧮 My favorite oscillator, RSI, is also ranging between 30 and 70, which nicely overlaps with the identified support and resistance levels. A breakout from these RSI limits can confirm our risk level and validate potential trade entries.
✍️ You can read the possible scenarios for this trading range below. If needed, set your alert zones and use them accordingly. Don’t forget proper risk and capital management.
↗️ Long Position Scenario: A breakout above $103,912, accompanied by an increase in buying volume, would validate a potential long setup. This volume increase should also align with the oscillator, meaning RSI should break above 70 on the 1-hour or 15-minute multi-timeframe chart, along with increased market volatility.
📉 Short Position Scenario: A breakdown below the micro buyer floor at $100,288, with selling pressure and RSI falling below 30, could confirm a short position. However, it’s recommended to wait for a pullback after the breakout before entering the trade.
❤️ Disclaimer : This analysis is purely based on my personal opinion and I only trade if the stated triggers are activated .

TradeCityPro | JUP Bearish Bias Near Key Support Zones👋 Welcome to TradeCity Pro!
In this analysis, I want to review the JUP coin,one of the projects in the Solana ecosystem, with a market cap of $1.09 billion, currently ranked 64th on CoinMarketCap.
⏳ 1-Hour Timeframe
On the 1-hour timeframe, this coin has formed a structure between the 0.3357 and 0.3591 levels, and has already faked out the range once to the upside and once to the downside.
🔍 After the fakeout to the upside, the price made a downward move toward the 0.3357 support, and as you can see, the selling volume in the red candles has been very strong.
🎲 At the moment, I believe the sellers have much more control in the market compared to the buyers, so the probability of a further downward move is higher for now.
📈 In that case, we can open a short position if the 0.3357 level breaks. One important thing to note is that the zone between 0.3260 and 0.3357 is a very strong support area where many buyers are active.
📊 So if buying volume enters this range, we may see a shift in market strength. In that case, breaking the 0.3488 level could give us a long position.
📈 The main long trigger for this coin is at 0.3591. However, since the price has already faked this level once, it's better to wait for a reaction to refine the exact breakout point.
📝 Final Thoughts
Stay calm, trade wisely, and let's capture the market's best opportunities!
This analysis reflects our opinions and is not financial advice.
Share your thoughts in the comments, and don’t forget to share this analysis with your friends! ❤️

TradeCityPro | Bitcoin Daily Analysis #215👋 Welcome to TradeCity Pro!
Let’s move on to Bitcoin analysis. Today is Sunday, and the price is ranging inside a new box it has formed. The breakout from this box is critical and could be the start of the next move.
⏳ 1-Hour Timeframe
On the 1-hour timeframe, Bitcoin has formed a large ranging box between the 100,308 and 103,855 levels, and the price has already faked out once to the downside.
🔔 After this fakeout, a bullish move began, pushing the price up to 103,855.
✅ However, since this move happened on Friday and we entered the weekend afterward, the market's momentum has faded, and now, the price is ranging within a much smaller box.
🎲 This range is forming between 101,601 and 102,489, and breaking either of these levels could give us a position.
💡 A key point to remember is that volume must increase in the direction the price breaks. If volume diverges from the price, the move is likely to be a fakeout.
☘️ The main triggers are still 100,308 and 103,855. Breaking either of these zones will set off the next major move in the market.
❌ Disclaimer ❌
Trading futures is highly risky and dangerous. If you're not an expert, these triggers may not be suitable for you. You should first learn risk and capital management. You can also use the educational content from this channel.
Finally, these triggers reflect my personal opinions on price action, and the market may move completely against this analysis. So, do your own research before opening any position.

TradeCityPro | ETC: Key Levels and Trend Analysis👋 Welcome to TradeCity Pro!
In this analysis, I want to review the ETC coin—one of the Layer 1 projects with a market cap of $2.57 billion, currently ranked 39th on CoinMarketCap.
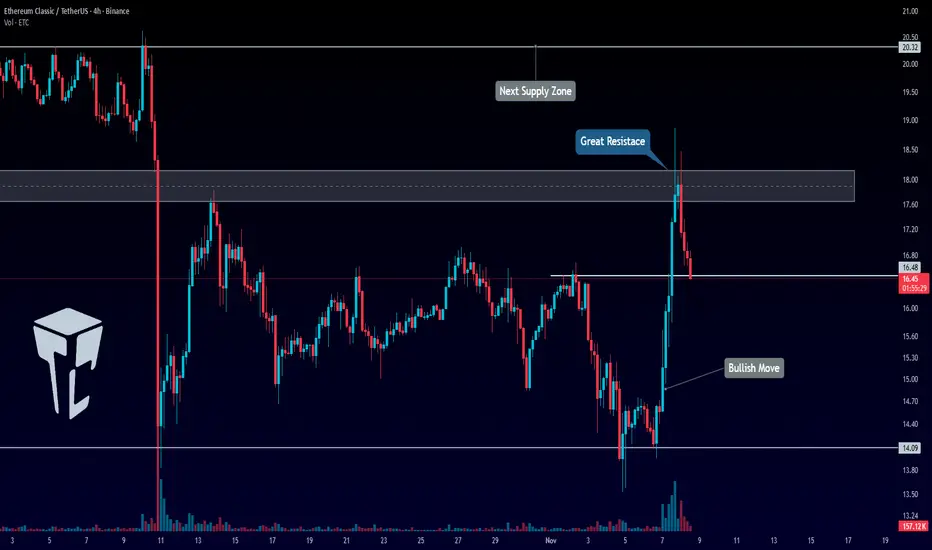
⏳ 4-Hour Timeframe
On the 4-hour timeframe, this coin made an upward move after being supported at the 14.09 level and was able to reach around the $18 zone.
✅ Currently, the price has had a minor correction, dropping to near the 16.48 level.
🎲 If the 18$ level is broken, the continuation of the move will begin, and we can use this as a trigger for a long position.
✨ If the correction continues and the 16.48 level is broken, the price could undergo deeper corrections.
📊 Currently, the volume is in favor of the buyers, and the volume has been decreasing during the correction. Therefore, if the price moves towards the 18$ zone with increasing volume, we can open a long position.
⭐ The main confirmation for a bullish trend on this coin will be breaking the 18$ zone and setting a higher high and low beyond this level. The next resistance level for the price is at 20.32$.
📝 Final Thoughts
Stay calm, trade wisely, and let's capture the market's best opportunities!
This analysis reflects our opinions and is not financial advice.
Share your thoughts in the comments, and don’t forget to share this analysis with your friends! ❤️
Bitcoin in a 4H Range: Critical Levels and Trade Scenarios Ahead👋🏻 Hey everyone! Hope you’re doing great! Welcome to SatoshiFrame channel.
✨ Today we’re diving into the 1-Day Bitcoin Dominance analysis. Stay tuned and follow along!
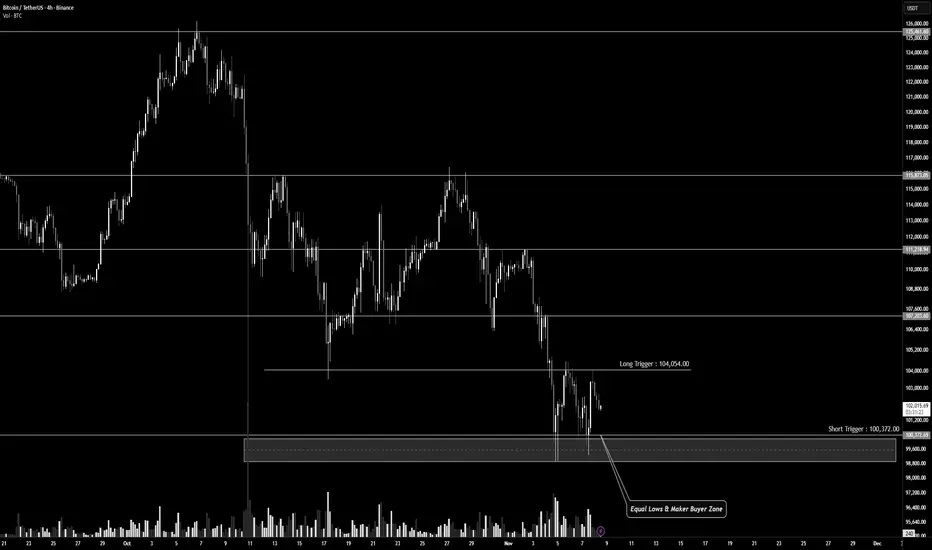
🪙 On the 4-hour timeframe, Bitcoin is currently moving within a clear trading range.
The highs and lows in lower timeframes are nearly equal, providing solid trigger zones for potential trades.
The range resistance is around $104,054, while the range support lies near $100,372, which can be considered a micro buyer zone.
💰 During Bitcoin’s first upward move, the volume increased, indicating an attempt to shift momentum bullishly.
However, after forming a lower high, buyers experienced FOMO but failed to push the price further up.
A pullback then occurred toward the support zone at $100,372, where another equal low was formed.
As price moved upward again, buying volume decreased, showing weakening buyer strength, and the move concluded with a blow-off 4H candle near the previous top.
✍️ Below are the potential trading scenarios for Bitcoin.
Review them and align with your own strategy and risk management before taking positions.
↗️ Long Position Scenario
A breakout above the resistance zone (the 4H trend-change area) around $104,054, followed by the formation of a higher low on that level, could provide a solid long setup.
Ensure this move is confirmed by increasing volume and buying pressure convergence for a higher win rate.
📉 Short Position Scenario
A breakdown below the support zone (two equal lows and a key weekly/daily support) around $100,372, combined with the formation of a lower high below that zone and strong selling pressure, could offer a short opportunity.
Watch out for large whale candles — it’s best to wait for confirmation before entering.
❤️ Disclaimer : This analysis is purely based on my personal opinion and I only trade if the stated triggers are activated .
TradeCityPro | Bitcoin Daily Analysis #214👋 Welcome to TradeCity Pro!
Let’s dive into the Bitcoin analysis. The market is finally showing signs of turning bullish. Let's do a complete analysis of Bitcoin.
⏳ 1-Hour Timeframe
Yesterday, Bitcoin faked the low it had formed, which helped the bullish momentum enter the market.
✨ Currently, after reacting to the 103,855 level, Bitcoin has entered a correction and is now attempting to form a higher low.
✅ If this higher low is formed and the price moves towards 103,855 again, we can open a long position when this level is broken.
⭐ This trigger is the first for a long position and, naturally, it will be a bit risky. However, I prefer to keep this position open because if the market decides to move upward in the future, we can more easily open new positions.
📊 For a short position, I am currently waiting for the market to create more structure and new triggers to emerge. For now, the only trigger we have is the 100,308 level.
🎲 The volume has slightly decreased compared to yesterday, which is normal because today is Saturday. We need to observe how the buyer and seller volume compares today, and based on that, we can determine the strength of the buyers and sellers.
❌ Disclaimer ❌
Trading futures is highly risky and dangerous. If you're not an expert, these triggers may not be suitable for you. You should first learn risk and capital management. You can also use the educational content from this channel.
Finally, these triggers reflect my personal opinions on price action, and the market may move completely against this analysis. So, do your own research before opening any position.

StevenTrading – XAUUSD Next Week | Elliott Wave 5 &...⚡️ StevenTrading – XAUUSD Next Week | Elliott Wave 5 & Resistance–Support (H4/M30)
📰 Fundamental Analysis
Gold holds around 4,000 USD due to safe-haven demand amid macroeconomic uncertainty.
US consumer sentiment weakens; prolonged government shutdown risks increase defensive demand.
The market is pricing in about a 68% chance of a Fed rate cut in December; however, USD rebounds may limit short-term gains.
→ Next week, prioritize disciplined trading, wait for H4 candle confirmation before expanding targets.
📊 Technical – Elliott Wave + Resistance/Support
Elliott Context:
Bullish scenario (short-term): wave count shows in wave 5 up if decisively breaking the 4,035–4,058 zone.
Bearish scenario (medium/long-term): wave 5 down remains valid if not surpassing 4,035 and closing H4 below 3,960 (losing uptrend line).
Key price zones & trendline:
Resistance: 4,035–4,058 (confirmation zone for uptrend), 4,149, 4,292.
Support: 4,002 (current price), 3,960 (confirmation of trend loss), 3,780 (deep target if reversal).
H4 Trendline: upward, passing through the 3.92–3.96 bottom cluster; breaking trendline with H4 close below 3.960 = triggers wave 5 down.
🎯 Trading Scenarios
🟢 Bullish – Activating wave 5 up
Condition: H4 candle closes above 4,035.
Entry: 4,036–4,040
Stop loss: 4,020
Take profit: 4,058 → 4,149 → 4,292
Note: wait for M30 retest holding 4,035 before increasing position.
Entry: 4,002–4,006
Stop loss: 3,988
Take profit: 4,019 → 4,035 → 4,058
Reason: retest price box + uptrend line, expect push to confirmation zone.
🔴 Bearish – Activating wave 5 down
Condition: H4 candle closes below 3,960 (trendline break).
Entry: 3,956–3,960 (retest)
Stop loss: 3,976
Take profit: 3,920 → 3,885 → 3,820 → 3,780
Reason: confirm structure loss, open downward momentum towards 3.78k.
⚠️ Risks & Invalidation
Invalidating buy orders: H4 candle closes below 3,988/3,960 (depending on scenario) → stop buying, wait for new structure.
Invalidating sell orders: H4 candle closes above 4,058, especially holding above 4,035 after retest → stop selling, switch to waiting for a rebound buy.

LiamTrading – XAUUSD D1 | Scenario for Week 2 of NovemberLiamTrading – XAUUSD D1 | Scenario for Week 2 of November
Accumulation range 4047–3928, prioritize buying on breakout – watch for short at 4200 (FVG + Fib 0.382)
Overview: After the adjustment from the historical peak, gold is forming a bottom – accumulating in the price range of 4047–3928. The D1 structure still leans towards a medium-term uptrend if the price holds above 3928; the ~4200 area coinciding with a wide FVG + Fib 0.382 is a “liquidity pool” where strong reactions are likely.
Macro Summary
Hedge funds against public debt/deficit risks and net buying demand from some central banks/Asian blocs support the long-term trend.
The expectation of a cooling interest rate path in 2026 helps reduce pressure on gold, but pullbacks may still occur before major technical milestones.
Technical Analysis (D1 Frame – Trendline | S/R | Volume zone | Fibonacci)
Accumulation Range: 4047 (top of the box) ↔️ 3928 (bottom of the box). D1 closing above 4047 confirms an upper range expansion; breaking 3928 triggers a deeper drop to lower Fib levels.
Fibonacci of the latest upward wave:
Price is oscillating around 0.618 → tendency to form a base.
Deeper area if the base breaks: 0.5 ~ 3850 and 0.382 ~ 3710.
Key Resistance: 4090–4120 (mid-box area), ~4200 (FVG + Fib 0.382) – expected large liquidity/short-term reversal area.
Important Support: 3990–4010 (psychological/trading buffer level), 3928 (lower range boundary – breakout point).
Trendline: The medium-term uptrend remains if corrections do not close below 3928.
Trading Scenario for the New Week
Scenario 1 – Buy on trend when breaking the upper range
Condition: D1 closes above 4047, retest holds firm at 4038–4047.
Entry: 4048–4055
SL: 4018
TP: 4090 → 4120 → 4185–4205 (FVG + Fib 0.382)
Management: Take partial profit at 4090/4120, move SL to breakeven when reaching +1R.
Scenario 1b – Buy at the bottom of the box (fade range)
Entry: 3935–3945 (when there is a clear rejection candle/tail at 3928–3945)
SL: 3895
TP: 3995–4010 → 4040–4047
Note: If D1 closes below 3928, cancel the plan and switch bias to the bearish scenario.
Scenario 2 – Short reaction at the liquidity area 4200
Entry: 4185–4205 (FVG + Fib 0.382) when a clear rejection appears on D1/H4
SL: 4225
TP: 4120 → 4047 → 4010 (extended target: 3850 if there is a breakdown signal)
Note: Counter-trend order; reduce volume, exit quickly if D1 closes above 4205.
Risk & Invalidation
The medium-term bullish bias remains valid as long as D1 does not close below 3928.
D1 closing below 3928 paves the way to 3850 (Fib 0.5), even 3710 (Fib 0.382).
Strong news (CPI, employment, central bank speeches) may disrupt signals; wait for candle closure according to the chosen frame.
Summary
Gold is “spring-loaded” within 4047–3928. Priority plan: Buy on breakout–hold 4047 to target 4090–4120 and test ~4200; simultaneously watch for short reactions at 4200. If breaking 3928, switch scenario to bearish towards 3850 → 3710.
