ETH 4H Analysis | Day 4🥳 Hey everyone! Hope you’re doing great! Welcome to SatoshiFrame channel .
✨ Today we’re diving into the 4-Hour Ethereum analysis. Stay tuned and follow along!
👀 Ethereum, the best and largest altcoin in our market, has also broken its descending trendline just like Bitcoin, and the long position scenario we discussed earlier has pretty much played out — I hope you took advantage of it.
🔍 After breaking through its previous resistances, Ethereum is now facing a new resistance area where some sellers have stepped in and some buyers are taking profits. There’s a possibility of a short-term pause in price movement. This zone has created a trigger for us, and the next, more logical long triggers for Ethereum are at $4,252 and $4,723. A breakout above these levels could kick off a strong upward move.
🧮 Looking at the RSI oscillator, it’s approaching the 70 zone but has been rejected near that level. For a confirmed breakout above $4,078, RSI needs to enter the overbought region. There’s also a support zone around 50, which could act as a rebound area for oscillatory movement. Right now, RSI has two key zones — 50 and 70 — that define its structure.
🕯 Notice the Ethereum volume behavior: to break through both static and dynamic resistance zones, the volume increased — this happened because a large number of sell orders were stacked in that area, and those orders needed to be filled before price could move upward smoothly. After that breakout, buying volume started to decline slightly, meaning both price and volume are now resting. For Ethereum to break this resistance zone, we either need sell orders to be absorbed or short positions to get squeezed by trapped traders.
🧠 We can outline a few possible scenarios for Ethereum’s position — some of them might be slightly more complex to manage:
🟢 Long Position Scenario 1
We need patience and a price cooldown. Wait for Ethereum to touch its nearest support zone, then rise with increasing volume. If during this move we see setup candles along with a resistance breakout, we can enter the position with a tight stop size.
🟢 Long Position Scenario 2
We can use an order-book stop-buy setup at Ethereum’s resistance and place a wider stop to catch any breakout spike. This allows participation in a potential price surge and can yield solid profit — though these setups usually take longer to reach an ideal risk-to-reward ratio.
🟢 Long Position Scenario 3
This one’s less likely but still worth noting: Ethereum could break its resistance with rising volume, then pull back to retest that same resistance (now turned support). Afterward, if we see volume increase, setup candles, and a confirmed pullback breakout, we can enter with a small stop size.
🔴 Short Position Scenario
A short setup would only make sense if the micro-buyer zone fails, accompanied by heavy whale candles, strong selling pressure, and an overall market crash.
❤️ Disclaimer : This analysis is purely based on my personal opinion and I only trade if the stated triggers are activated .
Tradingview

US30: Testing key supply zone, possible pullback ahead
SPREADEX:DJI – Price Reaction at Supply Zone | Possible Short-Term Correction
Timeframe: 30-Minute Chart
Analysis Style: Price Action • Supply & Demand • Market Structure
________________________________________
🧭 Market Context
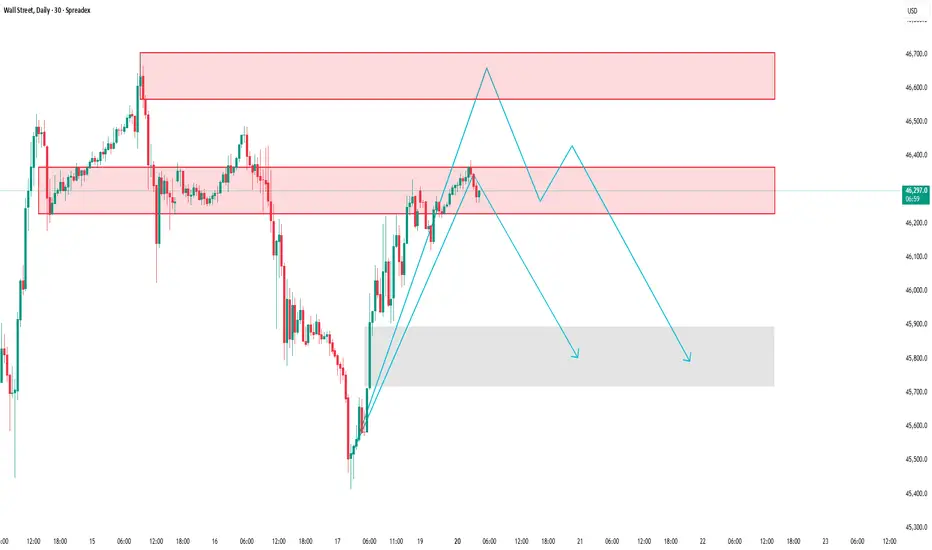
After a strong rally from the lower demand zone, the Wall Street Index is now approaching a key supply area that previously triggered a sharp downward move.
At this level, sellers are beginning to step in again, and price momentum is starting to fade — suggesting a potential short-term correction ahead.
________________________________________
🧩 Market Structure & Key Zones
🔴 Supply Zone #1: 46,227 – 46,370
→ The first reaction zone, where previous selling pressure started a strong decline.
🔴 Supply Zone #2 (Major Resistance): 46,572 – 46,700
→ A higher zone where strong bearish momentum originated before.
🟢 Demand Zone: 45,900 – 45,700
→ A previous accumulation area that fueled the recent bullish leg — possible support zone if price pulls back.
________________________________________
📊 Current Price Behavior
Price has reached the 46,227 – 46,370 area and is showing signs of buyer exhaustion.
Multiple rejections and slower bullish candles near this level indicate a loss of momentum.
If the short-term bullish structure breaks, the market may shift toward a corrective phase.
________________________________________
📉 Trading Scenario
✅ Primary Scenario (Bearish Reaction Expected):
1. Price might retest 46,229–46,400 once more.
2. Failure to break above this level could lead to a downward “push.”
3. Target zone for the correction: 45,800 – 45,900.
⚙️ Alternative Scenario:
• If price closes clearly above 46,400, the short-term bearish setup becomes invalid.
• In that case, the next resistance to watch lies around 46,600 – 46,700.
________________________________________
💡 Conclusion
The Wall Street Index is currently testing a critical supply zone with visible signs of slowing momentum.
Unless bulls regain control above 46,400, the market may experience a short-term pullback toward the lower demand area.
This analysis is for educational and informational purposes only — not financial advice. Always confirm with your own price action and risk management strategy before making any trading decisions.
Please like and comment below to support our traders. Your reactions will motivate us to do more analysis in the future 🙏✨
Harry Andrew @ ZuperView
BTC 4H Analysis | Day 5🥳 Hey everyone! Hope you’re doing great! Welcome to SatoshiFrame channel .
✨ Today we’re diving into the 4-Hour Bitcoin analysis. Stay tuned and follow along!
👀 After breaking out of the descending channel and confirming the long setup I explained in the previous post, Bitcoin moved upward and easily broke through its Maker-buyer zone.
🔍 Over the past two market-holiday days, Bitcoin consolidated in a multi-timeframe accumulation phase with a ceiling at $107,356, which was easily breached. The price then advanced toward its higher-level key resistances. It’s now trading between $110,500 and $113,000 — the $113,000 zone is our long trigger since price has struggled there multiple times before. This makes it a bit risky, but if the upward movement continues, the next resistances could be at $115,800 and $120,836.
🧮 Looking at the RSI oscillator, it has comfortably passed the 50 level on the 4-hour chart and is now heading toward the overbought zone, facing a key resistance at 70. This 70 level overlaps with the 50 zone on the daily timeframe, meaning that if RSI enters overbought on the 4-hour, the daily will just be shifting from a bearish swing phase to a long-position momentum phase — so the 70 zone is crucial.
🕯 If you check the lower-volume section of the chart, you’ll notice something interesting: the breakout above the two-day accumulation range came with a clear rise in buy volume, which helped Bitcoin easily break both the resistance area and the descending trendline (the upper boundary of the previous channel). This suggests Bitcoin may soon take a volume or price correction to gain more strength for another upward move.
⏰ During today’s New York session, we might see some strong moves. Remember last week when U.S. investors were selling off their ETF holdings, and the market was hesitant to buy? That fear caused weak participation. This time, we may have a reason to stay active during New York hours as sentiment shifts.
🧠 Here are the two key scenarios to watch:
🟢 Long Position Scenario
Wait for Bitcoin to react either to the micro-buyer zone or to the $113,000 area. If we see a pullback followed by an indecision candle (confirmation setup) touching the SMA-7, that’s our entry cue — ideally with a tighter stop size.
🔴 Short Position Scenario
Ignore shorts for now. Bitcoin already completed its second downward wave with an imbalanced slope, and over the last two days, seller momentum has weakened. Buyers are now driving price through resistance levels, so shorting here would go against the current flow.
❤️ Disclaimer : This analysis is purely based on my personal opinion and I only trade if the stated triggers are activated .

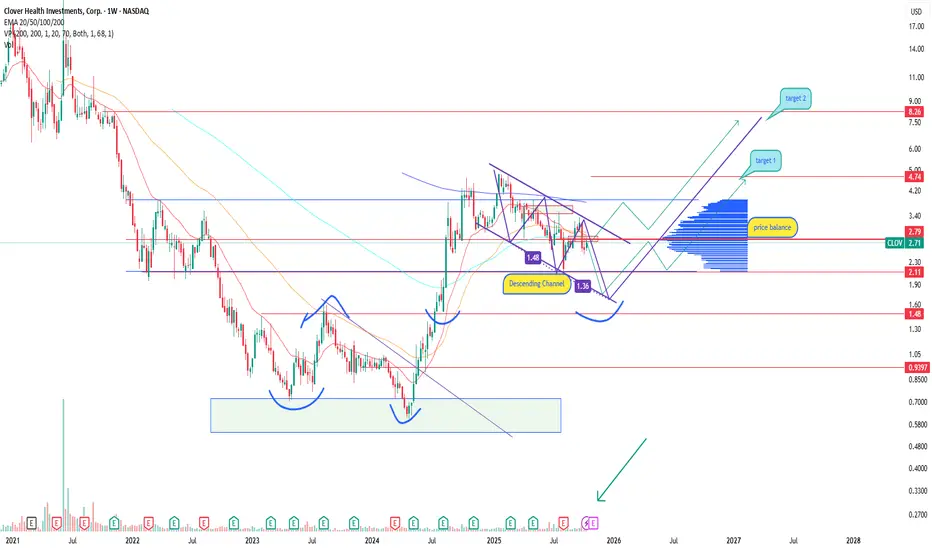
Topic: Clover Health growth emerging after a long declineClover Health (CLOV) stock is trading within a descending channel, approaching the lower boundary around 1.36–1.48, which previously acted as a demand zone. Rising volume suggests renewed buyer interest, and the flattening EMA 50/200 lines point to a potential trend reversal. A breakout above 2.80 could unlock targets at 4.74 and 8.26 — key supply levels.
Clover Health is a health-tech company providing AI-driven healthcare insurance and analytics solutions. After a restructuring phase and a reduction in losses, the company shows signs of stabilization. Improved financials and the growing focus on healthcare innovation could serve as catalysts for a new growth phase.
As long as the price holds above 2.10, the recovery scenario remains valid. A breakout from the descending channel may confirm the start of a mid-term bullish trend. Still, given the sector’s volatility, risk management is crucial.
Baidu -the awakening of the Chinese giantBaidu (BIDU) has been moving within a descending channel, and the price is now testing the lower boundary of a key demand zone. On the monthly chart, the stock is attempting to hold above the 115–120 range, which could signal the beginning of a mid-term reversal. The upside potential extends toward 163, 205, and 357, where major supply zones and the upper border of the long-term channel are located.
Baidu remains a leader in China’s AI and internet search industries. The company continues to invest heavily in autonomous driving and cloud technologies, reinforcing its long-term position. With the yuan weakening and expectations of a softer monetary stance from Beijing, the tech sector gains additional tailwinds.
The stock is consolidating near key support, and a breakout above the range may trigger a new bullish phase. Investors should watch the 115–120 zone as a potential launch point for growth. Volatility may stay elevated, so risk management remains essential.

BTCUSDT – Correction Pressure ReturnsHello traders,
After a weak rebound earlier this week, Bitcoin is showing signs of losing momentum as it continues to face rejection around the 110,000 USD zone. On the 4-hour chart, price action remains clearly within a descending channel, indicating that the short-term trend still favors the bearish side.
From a technical perspective, BTC is currently being capped by the EMA 34 and EMA 89, both acting as dynamic resistance levels. The recent bounce appears to be merely a technical pullback following the previous strong sell-off, but lacks the strength to establish new upward momentum. The price structure is forming a tight consolidation zone near the upper boundary of the channel — typically a signal of “a pause before continuation of the prior trend.”
On the news side – Policy and sentiment headwinds
This week, the FSB (G20) warned of “major gaps” in global crypto regulation — a negative sign for market confidence, especially after a massive mid-month liquidation shook investor sentiment.
At the same time, China’s tighter stance on stablecoins is raising concerns about slower Asian inflows, while institutional demand remains weak.
Together, these factors create a market environment of low buying pressure and rising risk , giving bears the upper hand in the short term.
Possible Scenario
At the moment, BTCUSDT is trading within the 106,000 – 110,000 USD range.
If the price fails to make a decisive breakout above 110,000 USD, a continuation of the correction toward the 100,000 USD area remains highly possible — aligning with the lower boundary of the descending channel and a key psychological support zone.

ZONAUSDT Coin Analysis and CommentaryZONAUSDT Coin Analysis and Commentary
ZORA Coin has broken above its 21-hour moving average (0.097681) on the 15 min. technical chart. Indicators appear to have turned positive. If the support holds, upward price movements may occur.
Resistance: 0.103941 – 0.100768
Support: 0.097023 – 0.095786
We’d appreciate it if you could boost our posts and share them on your social media. 🚀
Legal Disclaimer:
The information, comments, and recommendations contained herein do not constitute investment advice. Investment advisory services are provided only within the framework of an investment advisory agreement to be signed between the investor and authorized institutions such as brokerage firms, portfolio management companies, and non-deposit banks.
The opinions expressed here are personal views and may not be suitable for your financial situation, risk profile, or return preferences. Therefore, no investment decisions should be made based solely on the information and opinions presented on this page.

ZORAUSDT Coin Analysis and CommentaryZONAUSDT Coin Analysis and Commentary
ZORA Coin has broken above its 21-hour moving average (0.090380) on the 1-hour technical chart. Indicators appear to have turned positive. If the support holds, upward price movements may occur.
Resistance: 0.095186 – 0.099178 – 0.104103 – 0.114402
Support: 0.086196 – 0.082988 – 0.079251
We’d appreciate it if you could boost our posts and share them on your social media. 🚀
Legal Disclaimer:
The information, comments, and recommendations contained herein do not constitute investment advice. Investment advisory services are provided only within the framework of an investment advisory agreement to be signed between the investor and authorized institutions such as brokerage firms, portfolio management companies, and non-deposit banks.
The opinions expressed here are personal views and may not be suitable for your financial situation, risk profile, or return preferences. Therefore, no investment decisions should be made based solely on the information and opinions presented on this page.

TradeCityPro | DASHUSDT One of the Strongest Long Setups🔹 DASHUSDT Technical Analysis — One of the Strongest Long Setups in the Market!
Let’s dive into the analysis of DASH, one of the older yet technically impressive coins in the crypto market. Despite the recent volatility, DASH has shown stronger bullish structure compared to most altcoins — making it one of the few charts currently setting up for a potential long opportunity.
🌐 Market Overview
Before diving deeper, keep in mind that today and tomorrow the global crypto market will have lower liquidity due to the weekend. This often leads to lighter trading volume and potentially unpredictable price spikes.
If you’re planning to open a position during this period, it’s highly recommended to reduce your risk and avoid over-leveraging.
📈 Bullish Scenario (Long Setup)
The DASHUSDT chart is showing a strong bullish structure and currently consolidating below a key resistance level at 49.22.
Once this level is broken with confirmation and volume, it will likely trigger a sharp upward continuation — supported by the strong uptrend that has been forming over recent sessions.
✅ Long Trigger: Break and close above 49.22
🎯 Target 1: 55.00
🎯 Target 2: 60.13
The area around 60.13 is crucial, as breaking it could lead to a parabolic move, especially if market volume returns early next week.
📉 Bearish Scenario (Short Setup)
In case of an early rejection from 49.22 or a sudden drop due to the low-volume weekend conditions, we should monitor the 39.34 support zone closely.
A confirmed break below 39.34 could signal a shift in short-term momentum, opening room for a short position.
However, it’s worth noting that other coins — particularly TON and IMX — currently show cleaner short triggers and may offer better setups in case the market turns bearish.
⚙️ Risk Management Tip
Since the market is in a low-liquidity phase, it’s important to:
Use smaller position sizes
Wait for candle confirmation on the breakout
Set tight stop-losses just below local supports
🎯 Summary
🟢 Long Setup: Break above 49.22 → Target 55.00–60.13
🔴 Short Setup: Break below 39.34 → Conservative entry (better shorts on TON & IMX)
⚠️ Note: Trade lighter due to low weekend volume
💬 Final Thoughts:
DASH stands out among altcoins this week with a notably stronger bullish chart structure. The trend is constructive, and if momentum continues next week, a confirmed breakout could deliver one of the best long trades of the week.
Stay patient, watch the 49.22 level closely, and let the market confirm the move before entering.

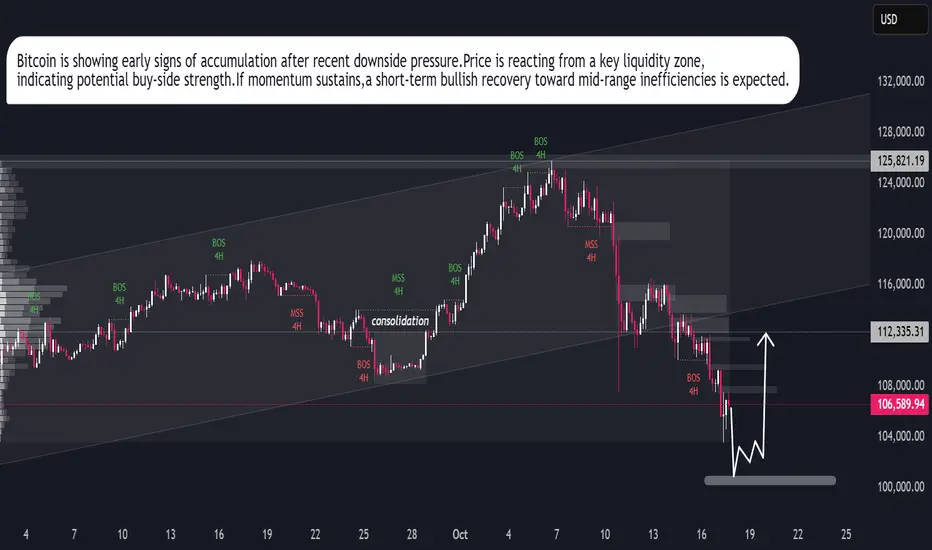
Bitcoin Market Preparing for Upside MoveBitcoin is currently stabilizing after a sharp corrective phase.The market is showing early signs of demand re-entry near the liquidity base,indicating potential exhaustion of selling pressure.Recent structural reactions hint that buyers are preparing to reclaim control,which could initiate a short-term recovery leg toward the mid-range inefficiency zone.If momentum sustains,Bitcoin may expand higher,confirming a potential buy phase aligned with institutional accumulation signals.Overall,the outlook remains cautiously bullish as long as the market holds above its newly formed demand area.
ETH 4H Analysis | Ethereum price squeeze is reaching its limit🥳 Hey everyone! Hope you’re doing great! Welcome to SatoshiFrame channel .
✨ Today we’re diving into the 4-Hour Ethereum analysis. Stay tuned and follow along!
😅 Yesterday I didn’t get the chance to post Ethereum’s analysis the way I wanted to — but today, I’ve prepared a full 4-hour analysis of Ethereum, and I’d be glad to have you follow along.
👀 Looking at Ethereum on the 4-hour timeframe: after the recent flash crash, ETH formed a support zone around $3,747, then bounced with a strong +10% pump upward. It was later rejected near $4,268 and moved back down, creating a double-bottom structure aligned with the previous support zone — now forming our valid static support.
A descending trendline has been drawn from the rejection points at $4,723 → $3,969, acting as our dynamic resistance. Ethereum is now nearing the apex of this triangle, and we’re waiting for a breakout. Note that this dynamic resistance overlaps with a static resistance zone at $3,969, so a confirmed breakout above that could serve as strong confirmation for a bullish reversal.
🧮 The RSI oscillator shows two key oscillation zones — around 50 and 30, acting as our momentum boundaries. A clean break beyond these zones could bring strong multi-timeframe momentum to Ethereum’s next move and trigger an earlier price breakout.
🕯 In terms of volume, ETH showed heavy selling pressure during the crash, but now, with the formation of a double bottom and clear compression in price, we’re waiting for a volume expansion to confirm direction.
It’s important to note that Ethereum remains the most watched altcoin in the crypto market — if the broader market shifts bullish, ETH could attract significant new buyers and drive capital inflow.
🧠 Based on this analysis, we’ve outlined two high-probability trading scenarios to match Ethereum’s potential reactions:
🟢 Long Scenario: A breakout above both the dynamic resistance and the static resistance at $3,969, combined with rising buying volume and an RSI breakout above 50, would provide a strong signal for opening a long position on Ethereum.
🔴 Short Scenario: A breakdown below the $3,747 support zone, with a strong bearish candle (whale activity) confirming the break of the micro-buyer zone, and an RSI dip into oversold territory, could trigger another wave of selling, presenting a short opportunity on Ethereum.
❤️ Disclaimer : This analysis is purely based on my personal opinion and I only trade if the stated triggers are activated .

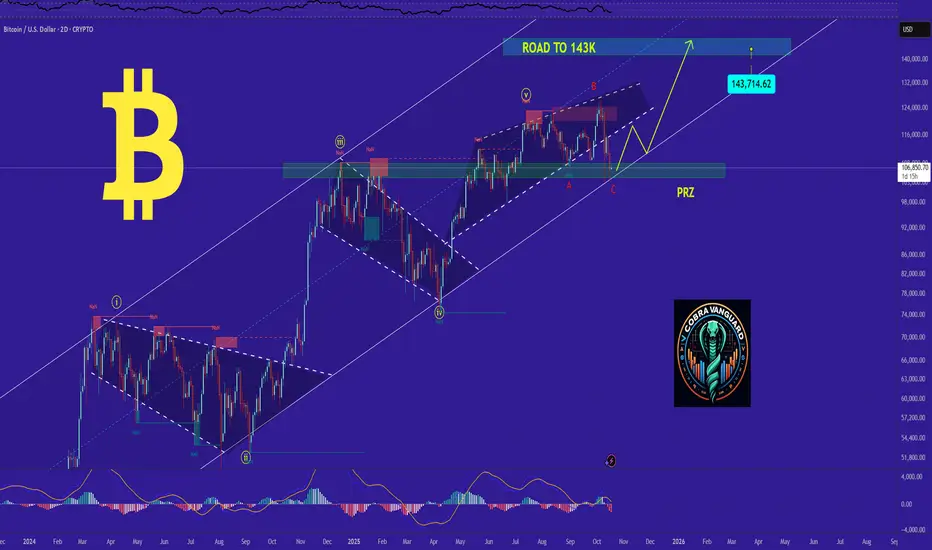
TradeCityPro | Bitcoin Daily Analysis #200👋 Welcome to the 200th Daily Bitcoin Analysis!
To celebrate this milestone, today’s analysis will be different, our main focus will be on the XAUBTC chart, but first, let’s analyze gold and Bitcoin separately before combining the two.
✅ Gold
📅 Monthly Timeframe
Gold is in a completely bullish trend on the monthly chart and, in its latest candle, has set a new all-time high (ATH) at $4,380.
💥 The momentum of this wave, which started from $1,980, is extremely strong — not only has the RSI entered the Overbought zone, but it has also broken through the Overextended level at 85.55 and now stands at 92.
💫 The last time gold’s RSI was in this range was in 1973, about 50 years ago, making this the strongest momentum in half a century.
🔍 Considering that gold has risen more than 100% without any major correction and has reached the 1.5 Fibonacci level, the probability of a correction is very high.
✨ If the price continues to rise sharply in the next few candles, the trend will become unsustainable, since there has been no major profit-taking — a warning sign for the continuation of the rally.
📊 In case of a correction, the main Fibonacci support levels are $3,500 and $3,000, which are potential targets if the retracement begins.
👀 If this happens, two possible scenarios emerge:
🏦 Increased gold supply, which is unlikely due to its scarcity.
Profit-taking by institutional “whales” (such as government treasuries), which is a much more probable reason for a correction.
💵 Bitcoin
📅 Weekly Timeframe
Bitcoin is in a bullish trend on the weekly timeframe, having completed seven upward waves, with the last peak recorded at $124,000.
✨ This top was a fake breakout, followed by a correction candle, and the price is now moving toward the $100,000 region.
🔽 A strong triple-top bearish divergence is visible on the RSI, with confirmation coming if 44.53 is broken.
📉 If confirmed, Bitcoin could enter a long-term corrective phase, with possible downside targets near $70,000.
🧩 However, the trend is still bullish as long as no lower high and lower low form below $100,000.
💡 This means Bitcoin could potentially make one more upward leg, forming a rare nine-wave pattern — uncommon, but possible.
⭐ Given that gold is likely entering a correction phase, the profits taken by gold whales could flow into crypto, potentially fueling Bitcoin’s next upward wave.
👑 Bitcoin Dominance (BTC.D)
📅 Weekly Timeframe
Bitcoin dominance has been in an uptrend, reaching 65.84%, but weakness in the trend and rejection from that level triggered a deep correction.
💫 After breaking 60.64, it fell to 57%, where it has since bounced.
📉 If dominance forms a lower high below 60.64 (or even below 65.84) and then breaks 57%, that would confirm a downtrend.
✔️ In that case, the dominance targets are 55.26, 51.06, and potentially 47.76.
🚀 This scenario suggests that if money flows from gold into Bitcoin, it may later flow into altcoins as dominance declines — setting the stage for a possible altcoin season.
🔑 XAUBTC Chart
🧮 This chart represents gold’s strength relative to Bitcoin.
As seen, its overall structure in recent years has been bearish, reflecting stronger investment interest in Bitcoin compared to gold.
📊 The trend remained bearish until early 2025, showing no weakness — until recently.
🔺 After finding support near 0.027, the trend has shown clear signs of weakening, and price action now hints at potential bullish reversal signals.
☘️ The price has already formed a higher low, and if it consolidates above 0.03922 next week, we’ll have the first confirmation of a trend reversal.
📈 The main bullish confirmation would come after breaking 0.04543.
⚡️ However, one possible scenario is that gold enters a correction phase while Bitcoin completes its final bullish wave.
✅ Since this chart faces two strong resistance zones, rejection from 0.03922 or 0.04543 could send it back toward 0.027, implying a gold correction and a final bullish leg for Bitcoin.
💥 Considering Bitcoin dominance may also drop, it’s likely that capital will first move from gold into Bitcoin, and then, as dominance falls, into altcoins — potentially triggering the long-awaited altcoin season where altcoins experience explosive rallies.
⚖️ This is just one possible market scenario; other outcomes are possible.
Remember: Always conduct your own research before making any investment decisions.

Breakdown or Bounce Incoming? | BTC 4H Analysis D4🥳 Hey everyone! Hope you’re doing great! Welcome to SatoshiFrame channel .
✨ Today we’re diving into the 1-Day BITCOIN analysis. Stay tuned and follow along!
👀 Yesterday I shared Bitcoin’s daily analysis in the channel, and today we’re going to review the 4-hour timeframe, from its recent all-time high up to the present.
🔍 After setting its ATH, Bitcoin entered a descending channel (driven by profit-taking and reactivated whale activity). Each time price reached the top of this channel, it was rejected and moved toward the midline or bottom. The last touch of the channel’s top led to another drop toward the midline, and price failed to break above the channel. The major buy zone (micro buyer area) at the top of the channel was lost and has now turned into a key static resistance, overlapping with the dynamic channel resistance — creating a crucial pivot zone for Bitcoin’s potential trend reversal. The next key support lies below this zone at $105,634; a confirmed break and close below it could extend the downtrend further.
🧮 The RSI oscillator is currently fluctuating between 30 (support) and 50 (resistance). A breakout beyond either side — as highlighted in the chart — could add significant momentum to Bitcoin’s next move. These RSI levels are default static zones, which makes their reliability stronger.
🕯 After the massive flash crash that shook the crypto market, traders have shown a stronger inclination toward selling, keeping Bitcoin within this descending channel. As seen in the volume data, the flash crash was accompanied by extreme selling pressure, and whales broke the micro buyer zone with a large “whale candle.” Continued selling pressure could push Bitcoin toward lower supports, while renewed buying volume and whale re-entry could drive it back toward the channel top to test that resistance once more.
🧠 For those without open positions, here are two key scenarios to consider:
🟢 Long Setup: A breakout above the key static + dynamic resistance zone at $109,222, along with increasing buy volume and RSI crossing above 50, could be a solid long opportunity.
🔴 Short Setup: A confirmed breakdown below the nearest support at $105,634, accompanied by strong selling pressure and RSI falling below 30 into oversold territory, could present a strong short setup.
❤️ Disclaimer : This analysis is purely based on my personal opinion and I only trade if the stated triggers are activated .

GOLD 30M - time to cool off after the rally?After a sharp rally, gold seems ready for a breather. The chart shows a break of the short-term trendline followed by a retest from below. The price is now hovering near $4250, testing the 0.618 Fibonacci level - a classic resistance area where sellers often step in.
If the pullback continues, the next downside targets lie near $4185 and $4064. However, as long as the $4200 support holds, bulls still have a chance to regain control.
Fundamentally , gold remains supported by global uncertainty and dovish central banks, but technically, a healthy correction was long overdue.
Tactical plan: watch $4260 closely. If sellers hold, the drop could extend. If buyers reclaim the level - bears will have to retreat.
Remember: don’t try to catch falling gold - it cuts both ways.

BTC Outlook after the Dip. What to expect NOW? As I mentioned earlier, the price has reached the bottom of the channel and completed the final bearish wave. I'm hopeful that Bitcoin will respect the technical setup and begin a bullish wave from here.
!!! However, Bitcoin might surprise everyone and break the channel structure.so we need to wait for confirmation, which I believe will become clear by tomorrow.
Follow us for upcoming updates and market insights.
PREVIOUS ANALYSIS
Bitcoin Market Analysis – October 18, 2025👀 Current Outlook:
Price has found support around the 104,000 zone, and there’s a good chance we might start building a consolidation zone here.
📈 If that consolidation forms, a breakout above 107,000 could trigger a long position and signal renewed bullish momentum.
📉 On the flip side, if 104,000 breaks again, we may see a deeper drop, which could weaken the overall bullish structure and make it harder for the market to reach new all-time highs in the near future.
⚡️ In case of a sharp reversal and a V-pattern formation, it’s better to shift to a bullish bias and follow the momentum.
🕒 On the 15-minute timeframe, if we’re trading within the range, a break below 106,000 could provide a short setup.
---
💡 Conclusion:
Stay patient and wait for clear confirmations before entering any trades. Let the market show its direction — then follow the trend with discipline
For informational purposes only – not financial advice. © DIBAPRISM
Larry D.Kohn

TradeCityPro | AVAX: Downtrend Persists Near Key Support👋 Welcome to TradeCity Pro!
In this analysis, I want to review the AVAX coin. One of the older crypto projects active in RWA, it has a market cap of $8.48 billion, ranking 18th on CoinMarketCap.
⏳ 1-Hour Timeframe
On the 1-hour chart, we see a downtrend in this coin, which has continued after last week’s decline.
✨ After the 23.06 level was faked, bearish momentum entered the market, and a new downwave began. After breaking the 20.68 support, the price dropped to 19.10 and is now in a correction and pullback phase.
📊 Volume has significantly decreased during this correction, indicating the strength of the downtrend. Although today is Saturday and the overall market volume is low, if the price moves back toward 19.10 with increasing volume, we can confirm the volume for the bearish trend.
💥 The RSI oscillator is correcting alongside the price and, after exiting Oversold, is currently around 50.
⭐ If the 50 level breaks, it signals that bearish momentum in the market has decreased, and AVAX could enter a range-bound or corrective structure.
✔️ On the other hand, if selling volume returns and RSI moves toward 30, breaking this level would bring bearish momentum back into the market. In this case, breaking the 19.10 trigger allows us to open a short position.
🔍 For now, there are better coins for long positions that have recovered more. On AVAX, as long as it stays below 20.68, long positions don’t make much sense.
📝 Final Thoughts
Stay calm, trade wisely, and let's capture the market's best opportunities!
This analysis reflects our opinions and is not financial advice.
Share your thoughts in the comments, and don’t forget to share this analysis with your friends! ❤️

Bitcoin Under Fire: Bears Take Full Control Below $110KHello traders,
Today, let’s take a look at the overall picture of BTCUSD – where the market is gradually losing its recovery momentum and shifting into a defensive phase. After a series of negative headlines recently, Bitcoin remains under strong selling pressure, and the downtrend is now clearer than ever.
📰 Key News Highlights
Over the past week, several macro factors have weighed heavily on investor sentiment:
- U.S.–China trade tensions have escalated after the U.S. announced expanded tariffs on Chinese tech products, triggering capital outflows from risk assets — including crypto.
- The G20 and FSB issued warnings about “significant gaps” in global crypto regulations, sparking fears of tighter oversight ahead.
- The Federal Reserve struck a more hawkish tone as Vice Chair Michael Barr warned of financial stability risks posed by stablecoins, adding further psychological pressure to the crypto market.
➡️ Combined, these factors have pushed Bitcoin down nearly 15% since the start of the month, reaching around $109,000 with no clear signs of reversal yet.
📉 Technical Analysis
The chart shows that BTC continues to move within a downward-sloping channel, with the EMA34 and EMA89 acting as dynamic resistances — a clear reflection of short-term weakness.
The $110,000 level is a key resistance zone, aligning with both the descending trendline and EMA34. Failure to break above this area could send BTC lower toward $103,000, or even $100,000 if selling pressure expands.
Only a confirmed H4 close above $112,500 would signal a temporary technical rebound.
💡 Trading Advice
The market is weak — don’t try to catch the bottom. Prioritize capital preservation and wait for clear signals before taking action.
Short-term traders: Look to sell on rallies around $110,000–$111,000.
Long-term investors: Watch for price action in the $103,000–$105,000 range, where a potential mid-term technical bottom could form.

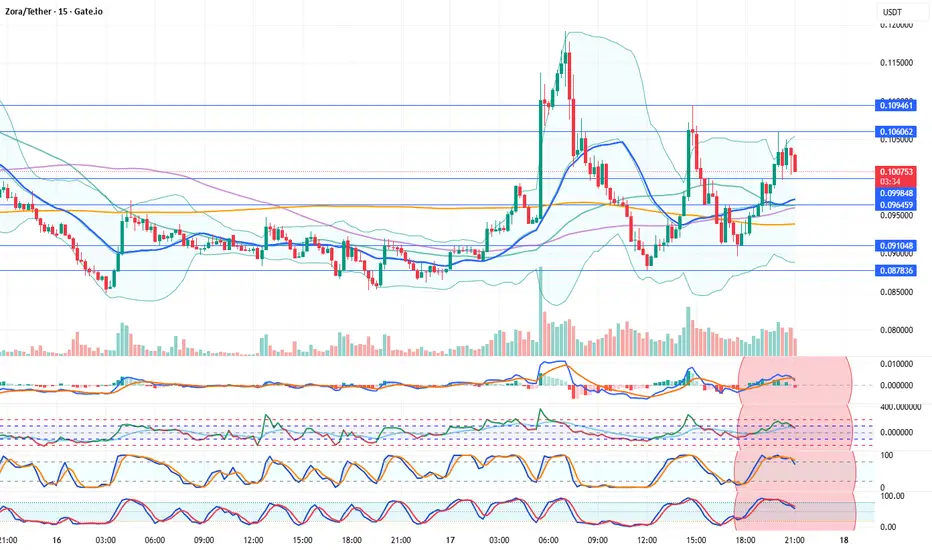
ZORAUSDT Coin Analysis and CommentaryZORAUSDT Coin Analysis and Commentary
Indicators for Zora Coin are currently negative. On the 15-minute technical chart, selling pressure is increasing. The coin has turned downward from the 0.106 resistance level, entering a negative phase. Additional selling may occur in the short term. In this situation, support levels will be closely monitored.
Resistances: 0.106062 – 0.109461
Supports: 0.099848 – 0.096459 – 0.091048 – 0.087836
We’d appreciate it if you could boost our posts and share them on your social media. 🚀
Legal Disclaimer:
The information, comments, and recommendations contained herein do not constitute investment advice. Investment advisory services are provided only within the framework of an investment advisory agreement to be signed between the investor and authorized institutions such as brokerage firms, portfolio management companies, and non-deposit banks.
The opinions expressed here are personal views and may not be suitable for your financial situation, risk profile, or return preferences. Therefore, no investment decisions should be made based solely on the information and opinions presented on this page.
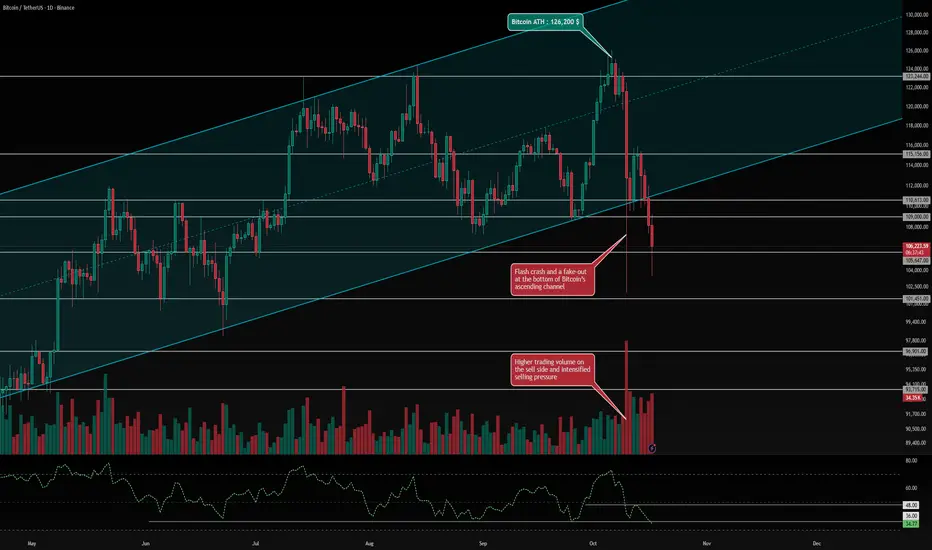
BITCOIN From ATH to Breakdown | BTC 1D Analysis D3😎 Hey everyone! Hope you’re doing great! Welcome to SatoshiFrame channel .
👍 Today we’re diving into the 1-Day BITCOIN analysis. Stay tuned and follow along!
👀 Bitcoin has been trading within a strong ascending channel, recently hitting the upper boundary and setting a new all-time high (ATH) at $126,200. However, this was immediately followed by a flash crash that wiped out roughly $20 billion in futures positions. During the crash, the lower boundary of the ascending channel was also fake-broken, after which buyers temporarily pushed the price back inside the channel. Yet, due to extreme market fear and uncertainty, Bitcoin lost its key support zone at $110,613, continuing the downtrend that began with the flash crash. With yesterday’s daily candle close, Bitcoin officially broke down from its ascending channel, and price action is now heading toward lower support levels. The nearest support lies around $105,647, and if this zone fails to hold, Bitcoin could extend its decline toward the next support at $101,451.
🔍 Bitcoin currently faces two major resistance zones at $109,000 and $110,613. A confirmed breakout above these could signal the start of a reversal, but the main long trigger is located at $115,156. If Bitcoin breaks and holds above this zone with strong buying volume, it could mark the beginning of a powerful bullish leg, potentially leading to a new ATH.
🧮 The RSI oscillator is now sitting near its support region around 36. A daily close below this level would strengthen bearish momentum and could push RSI into oversold territory. The midline resistance sits near 48, and a breakout above this would indicate a possible trend reversal toward renewed bullish momentum.
🕯 Recent candlestick volume shows extremely high selling pressure, marking one of the most intense liquidation waves in recent crypto history. The number of red candles has surged in recent days, suggesting a continuation sell-off pattern, with traders increasingly favoring short positions. The market is currently in extreme fear, and for any bullish reversal to occur, Bitcoin would need massive buy-side volume and strong support to push prices back up. Without that, more long-term holders may start selling as well.
🧠 Current Scenarios (Daily Timeframe) — Patience is key. If you haven’t already entered a short based on previous analyses, consider these setups:
🟢 Long Scenario: Enter on a confirmed breakout and consolidation above $115,156, accompanied by a spike in buying volume and an RSI move above 48.
🔴 Short Scenario: Enter on a confirmed breakdown and close below $105,647, which could trigger a deeper correction toward lower levels. This move would likely coincide with continued selling pressure and RSI dropping below 36 into the oversold zone.
❤️ Disclaimer : This analysis is purely based on my personal opinion and I only trade if the stated triggers are activated .
TradeCityPro | Bitcoin Daily Analysis #199👋 Welcome to TradeCity Pro!
Let's move on to the Bitcoin analysis—finally, the support zone that Bitcoin had has been broken. Let’s review what has happened in the market.
⏳ 1-Hour Timeframe
Yesterday, Bitcoin was in a consolidation range between 110,420 and 111,714.
✔️ Bearish signals, such as Dow Theory structure and high volume on bearish candles, were visible on the chart. Eventually, this led to a break of the consolidation from the bottom, and the support zone was lost.
🔍 After breaking this area, the price retraced and, with a consolidation below 107,790, confirmed the breakdown.
⭐ Currently, the price is at 104,483 and has reacted to it. The RSI oscillator has also reacted to its support area at 22.19 and has been holding near this support for several candles.
📉 If the price continues to drop, this 104,483 level serves as a suitable trigger for the next entry point. Breaking this level could push the price toward the next support zones.
🔔 However, if the price moves upward and fully fakes this drop, a consolidation above 111,714 would confirm a bullish reversal for Bitcoin, allowing us to open long positions with much higher momentum.
💡 I personally opened a short position at the break of 110,420 and am not taking profit yet because it’s a good entry point. In the future, if the market drops, it will provide strong support for subsequent positions.
💥 If the market moves upward and this short gets stopped, strong bullish momentum will enter, making the long positions we open in the next leg very attractive.
❌ Disclaimer ❌
Trading futures is highly risky and dangerous. If you're not an expert, these triggers may not be suitable for you. You should first learn risk and capital management. You can also use the educational content from this channel.
Finally, these triggers reflect my personal opinions on price action, and the market may move completely against this analysis. So, do your own research before opening any position.

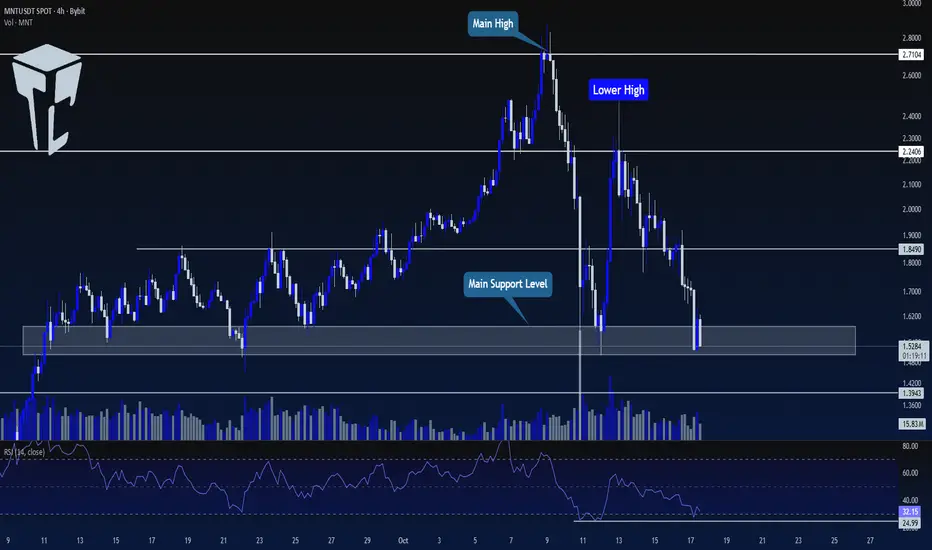
TradeCityPro | MNT: Key Support Holds for Now👋 Welcome to TradeCity Pro!
In this analysis, I want to review the MNT coin for you. One of the most well-known Ethereum Layer 2 projects, with a market cap of $5.03 billion, ranked 26th on CoinMarketCap.
⏳ 4-Hour Timeframe
On the 4-hour chart, after an upward trend, this coin reached 2.7104 and has now entered a corrective and bearish phase.
✨ There is a very important support zone around 1.5. The price has reacted to it once, formed a lower high, and is now back on support.
💥 The RSI oscillator is near the Oversell area. Breaking 24.99 will push the RSI into Oversell.
✔️ For short positions, we can enter on a break of this range. However, since the higher timeframe trend is bullish, we should also consider confirmation from volume, RSI, and Bitcoin.
🔍 For long positions, we need to wait until the market structure creates a proper trigger for a long. Currently, the main confirmation for bullishness is a break of 2.2406.
📝 Final Thoughts
Stay calm, trade wisely, and let's capture the market's best opportunities!
This analysis reflects our opinions and is not financial advice.
Share your thoughts in the comments, and don’t forget to share this analysis with your friends! ❤️
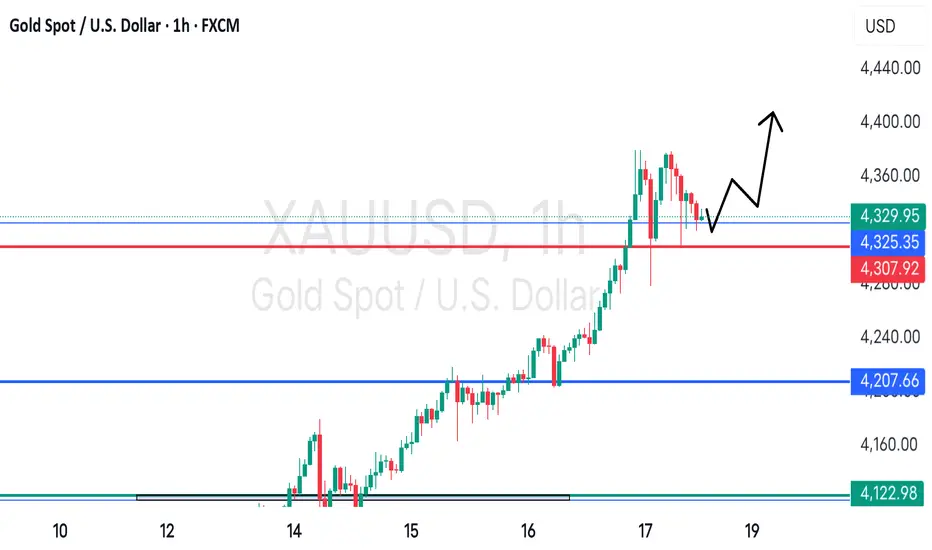
GOLD at Immediate support? Cut n reverse area??#GOLD... perfect move as per our last analysis and idea regarding Gold,
Now market made a new supporting area that is around 4308 as deep supporting area and immediate supporting area is 4324-25 now.
Keep close both areas and if market holds than we can expect further boucne.
NOTE: we will go for cut n reverse below 4308bon confirmation.
Good luck
Trade wisely