GOLDEN GOLD XAUUSD Gold now hasn’t triggered ,so made some adjustments and will wait patiently and wait for the trade to be valid or triggered
Tradingview

BTC 1H Analysis – Key Triggers Ahead | Day 9💀 Hey , how's it going ? Come over here — Satoshi got something for you !
⏰ We’re analyzing BTC on the 1-hour timeframe after today’s CPI release .
👀 Following the CPI news, Bitcoin broke through key areas — including the descending channel and the $117,000 resistance — and moved higher. It then faced rejection from the previous high, pulling back to around $118,000, which aligns with a multi-timeframe 4H SMA25 bounce. After that, it broke the $119,000 level and is now heading toward its key resistance at $120,000.
🎮 Fibonacci drawn from the current high to the price jump zone shows our current key level at 0.61, which is a relatively strong resistance. Breaking above this Fibonacci level could send BTC toward its current high and potentially lead to a new ATH.
⚙️ On the RSI oscillator, the key level is 70. Entering the overbought zone could push BTC toward its current high.
👑 The 99 MA is forming a strong base below the 0.37 level, while the 25 MA is working to break resistance and push price upward. On the 4H multi-timeframe view, the 0.23 area acts as a rebound zone after touching the 25 MA.
🕯 Volume and trade count are increasing, with solid consolidation above zones where whales have been buying and accumulating. Following today’s CPI results, fresh capital has flowed into risk assets like Bitcoin. This could be highly attractive for other coins, especially BTC pairs that are bullish in these conditions.
🔔 You can set an alert at the $120,000 area to watch price action when it reaches this level. If it matches your setup confirmations, you can open a position. Personally, I have a profitable long position on Ethereum, which is considered a BTC pair.
📊 On the 1H timeframe for USDT.D, we can see that after reacting to 4.20%, it faced a drop, and with a break below 4.10%, BTC could set a new high.
🖥 Summary: Bitcoin is moving toward its $120,000 resistance, where we could consider opening positions. The most important factor will be holding and confirming above this level.
❤️ Disclaimer : This analysis is purely based on my personal opinion and I only trade if the stated triggers are activated .

TradeCityPro | Bitcoin Daily Analysis #151👋 Welcome to TradeCity Pro!
Let’s dive into today’s Bitcoin analysis. Earlier today, the highly anticipated U.S. inflation data was released — let’s see how it has impacted Bitcoin.
⌛️ 4-Hour Timeframe
Bitcoin continued its correction yesterday, and remained in a corrective phase until today’s U.S. inflation news hit the market.
✔️ The news came out in Bitcoin’s favor, and we are now seeing a bullish engulfing candle on the 4-hour chart with solid volume. If this candle can close with a slightly larger body, it would be a strong signal for a potential continuation of the uptrend.
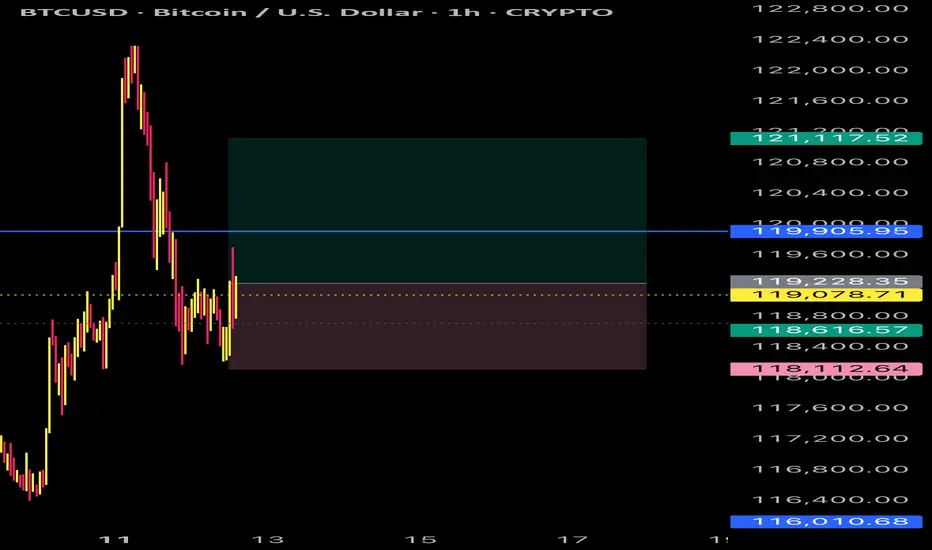
📊 As long as the price holds above the 116,829 level, I consider Bitcoin’s trend in LWC to be bullish. On the MWC, we are still ranging, and on the HWC, Bitcoin remains bullish.
🔔 Currently, there’s a resistance level at 120,041, which was previously faked out from above. We need to wait for the next tests to identify the precise resistance line.
✨ If this resistance at 120,041 breaks, a long position could be considered. The main trigger for confirming an MWC uptrend would be a breakout above 122,733. However, I recommend aiming to enter on the 120,041 breakout instead, as waiting for 122,733 might be too late — the move would likely be sharp, with no ideal entry candle.
🔽 On the other hand, if the current candle turns into a wick and closes red, Bitcoin could enter a deeper correction toward the 116,829 and 115,364 zones.
💥 If RSI closes below 50, that would give a momentum-based confirmation of bearish conditions, increasing the likelihood of a corrective scenario as selling momentum builds in the market.
❌ Disclaimer ❌
Trading futures is highly risky and dangerous. If you're not an expert, these triggers may not be suitable for you. You should first learn risk and capital management. You can also use the educational content from this channel.
Finally, these triggers reflect my personal opinions on price action, and the market may move completely against this analysis. So, do your own research before opening any position.

BTCUSD SCALP Bitcoin scalp,I will be following the trend and keeping it simple with no indicators used for all these trades, will keep taking profits
EURJPY PROFIT Eurjpy performed well and has mashed all take profits and unlocked a new price level will be looking to hold a bit more longer

BTCUSD SCALP TRADEBitcoin will be scalping it carefully and as quick as possible and will just wait for a turn over to the upper side
USOIL rebounds from 6,300.0. Where next?USOIL rebounds from 6,300.0. Where next?
USOIL bounced back from the 6,300.0 mark on Tuesday, building on slight gains from the prior session, after President Donald Trump prolonged a tariff truce with China for an additional 90 days. The decision, made just before new tariffs were due, provided temporary relief from rising trade tensions that might hinder global growth and energy demand. The modest rise towards SMA50 and 6,500.0 level is expected. Market participants will also be waiting for OPEC’s monthly report, along with US EIA and IEA forecasts, for fresh supply–demand signals.


EURNZD Is About to Explode — Here’s My Exact TriggerHey, it’s Skeptic — quick breakdown on EURNZD . We’re stuck in a clean consolidation box on both daily & 4H. I’ll show you the exact long and short triggers to watch, plus how I’m planning entries.

GOLD - Cut n Reverse Region? Holds or not??#GOLD.. .market just reached at his current major supporting area/region.
That is around 3340-45
Keep close and stay long above that.
NOTE: we will go for cut n reverse below 3340 on confirmation.
Good luck
Trade wisely

BTC 1H Analysis – Key Triggers Ahead | Day 8💀 Hey , how's it going ? Come over here — Satoshi got something for you !
⏰ We’re analyzing BTC on the 4-hour timeframe , Bitcoin is pushing toward its all-time high with a massive, high-volume whale candle .
👀 After breaking through its resistance zones, Bitcoin surged toward its ATH but faced rejection and selling pressure near that level. Key potential support areas are the 25 and 99 moving averages, marked in yellow and sky blue on the chart. The 25 MA is close to the 0.61 Fibonacci level, around $118,000, and is moving toward the average of the last 25 candles. A reaction to this moving average could indicate whether Bitcoin will rebound or drop further .
⚙️ Bitcoin’s key RSI zone is at 55.25, which corresponds to the $118,000 range. Breaking below this could push RSI under 50 .
🎮 Fibonacci retracement drawn from the breakout and pullback of the V-pattern shows that the 0.13 and 0.23 levels failed under selling pressure, sending BTC toward lower support levels. The current support based on Fibonacci is at 0.37. If this is lost, BTC could range on the 4-hour chart between 0.37 and 0.61 .
✉️ Tomorrow at 8:30 AM New York time, the official CPI (Consumer Price Index) report will be released by the U.S. Bureau of Labor Statistics. This news can significantly impact the crypto market — if inflation decreases, purchasing power rises , and Bitcoin could set a new all-time high .
🕯 BTC trading volume and activity are strong in both directions. Each price surge is followed by a quicker consolidation, and corrections occur under selling pressure .
🔔 An alert zone is set at the 0.13 Fibonacci level to observe price behavior when it reaches that point, then decide on the best course of action .
📊 A break below Tether dominance at 4.10% would signal a long position on BTC, while a break above 4.20% could lead BTC into a deeper correction .
🖥 Summary : Tomorrow’s CPI news could spark large, powerful candles and potentially a new ATH for Bitcoin. If U.S. inflation increases, stronger selling pressure is possible. There’s no specific trigger for this current level, but breaking 0.13 will prompt me to open a position — or at least take trades on altcoins with a bullish correlation to Bitcoin .

Skeptic's Night Byte: How to Catch Altcoin MovesHey, welcome to the first episode of the Skeptic's Night Byte
In this quick lesson, we’ll dive into how to spot when liquidity moves from Bitcoin into altcoins .
Each video is about 60 seconds, giving you fast, no-fluff insights to help improve your trading game :)
If you find this useful, give it a boost and share it with your trading circle.
Let’s get started!

Bitcoin’s Next Move? ETH Heating Up & Altcoin Liquidity Shifthey I’m Skeptic,
in this one we’re looking at BTC’s breakout attempt, the good & bad signs in the daily candle, and why ETH & other alts are moving while BTC is ranging.
also sharing my triggers for both BTC & ETH, plus what I’m watching on BTC.D for the week ahead.
manage your risk, don’t fomo — peace out :)

BTCUSD UPDATE Bitcoin has gone up and now I will close partial profits and secure what I have or even swing again to the up side

BTCUSD BITCOIN Bitcoin has now triggered my trade and now I await it, to return to the upside and provide profits , I shall partial close if necessary

TradeCityPro | Bitcoin Daily Analysis #150👋 Welcome to the 150th Bitcoin Analysis on TradingView by TradeCity Pro!
I am very happy that the number of daily Bitcoin analyses has reached 150. I hope the analyses have been useful so far and that you have been able to benefit from them. On this occasion, I want to present a complete and comprehensive analysis of Bitcoin.
📅 Weekly Timeframe
On the weekly timeframe, Bitcoin has been in a very strong uptrend since early 2023. After breaking the 24512 resistance, it made several sharp moves and, in multiple bullish waves, managed to register a new ATH in the 120000 zone.
✨ At the moment, it can be said that Bitcoin is in the seventh wave of its trend, which is quite a high number. The more waves a trend has and the more it shows signs of weakness, the higher the probability of a trend reversal.
📊 Regarding volume, there is not much to say because over time, Bitcoin’s trading volume on Binance has decreased. The reason is partly due to Binance exiting certain countries, and partly due to the growth of the DeFi space, where a significant percentage of trading now happens on DEXs, naturally reducing CEX volume.
⭐ However, if we compare the magnitude, slope, and candlestick size of the bullish waves, the trend weakness is clearly visible. But this does not mean the trend will reverse.
🧩 Many trends, even after showing weakness, continue for several more waves. If this happens for Bitcoin on the weekly timeframe, we can still take many long positions in futures during those waves.
💥 Therefore, this trend weakness is not a solid reason to avoid opening long positions for now. I still believe long positions in futures take priority over short positions.
🛒 For spot, if you have already bought Bitcoin, I suggest you keep holding for now. We can take profit after confirming the trend, but for now, it is better to hold.
🎲 However, for spot buying at current prices, I do not recommend it because it is not worth it. It is better to open futures positions to get a more reasonable profit.
🔔 Now that the 110000 resistance has been broken, the next targets are 128000 and 162000. If RSI enters the Overbought zone, these targets will be within reach.
📅 Daily Timeframe
In the last analysis I shared for this timeframe, the price was in a correction phase, and I mentioned that as long as the price is above 110183, the trend is bullish, and the probability of upward movement is higher than a drop.
🔑 That’s exactly what happened — the price formed a higher low above 110183, and RSI bounced from near the 38.21 support level and moved upward.
🔍 We had a Maker Seller zone between 120000 and 122000, and now the price has penetrated into it.
🔼 It seems to be getting rejected from the top of this zone and today failed to break it. Now we need to see what happens during the New York session.
✔️ In my opinion, it is unlikely that the price will break this top today. The market will probably wait for the U.S. inflation data release tomorrow before deciding on the next move.
📊 If inflation comes in higher than expected, the market will re-enter a correction phase, likely dropping back toward 110183.
📈 If inflation is lower than expected, Bitcoin can break the 122000 resistance and start a new bullish leg.
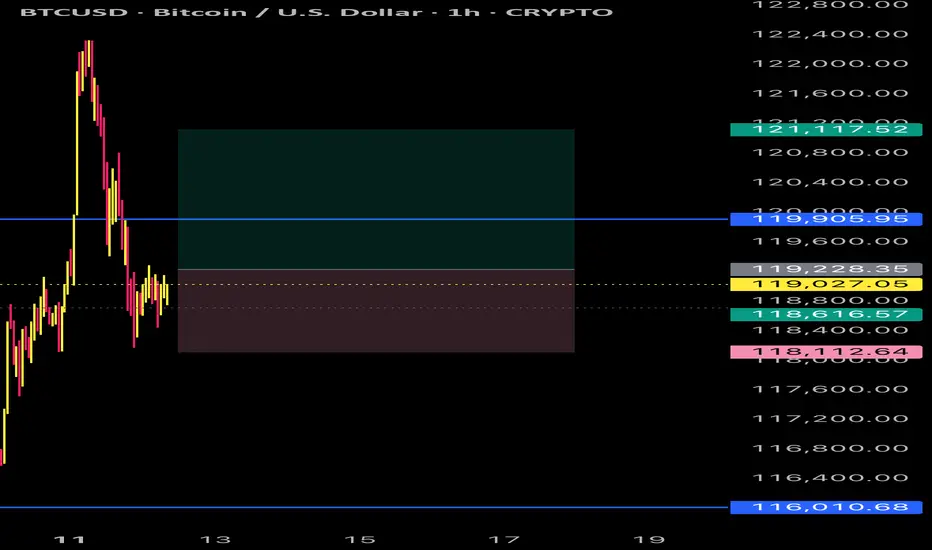
⏳ 4-Hour Timeframe
On this timeframe, Bitcoin finally broke through the Maker Seller zone it had formed, with a strong bullish candle. After RSI entered the Overbought zone, a Blow Off candle was printed near the 122733 resistance.
☘️ Currently, given the recent red candles, it appears that RSI’s entry into Overbought was a fake-out, and the price has pulled back to 120041.
⚡️ There is a possibility that the price could resume its upward movement from here, as the 120041 zone is an important level that can prevent further declines. In this scenario, the price would also have completed a pullback to the SMA7.
💥 If a deeper correction occurs, the next dynamic support is the SMA25, which is also an important momentum support.
📉 The lower static support levels for Bitcoin are currently 116829 and 115364.
❌ Disclaimer ❌
Trading futures is highly risky and dangerous. If you're not an expert, these triggers may not be suitable for you. You should first learn risk and capital management. You can also use the educational content from this channel.
Finally, these triggers reflect my personal opinions on price action, and the market may move completely against this analysis. So, do your own research before opening any position.
