BTCUSD : Technical analysis Mini Demand Zone After Bearish Comes📊 BTCUSD 30-Minute Analysis — Reversal Zone + Volume Burst Setup
1. Market Structure Overview
On the 30M timeframe, BTCUSD is currently trading inside a corrective phase after rejecting the upper resistance area around $91,000 – $92,000. The price formed a rounded-top structure, indicating a gradual weakening of bullish momentum.
The market has been moving sideways with decreasing volatility, suggesting accumulation or preparation for the next move.
2. Major Drop & Formation of Fresh Reversal Zone
A major bearish move pushed BTC down into a strong Reversal Zone (RZ) positioned around:
**🔽 Key Reversal Zone (Demand Area):
$88,000 – $87,000**
This zone is significant because:
It aligns with previous reaction level from Dec 2
Strong buy-side volume burst previously originated here
Price has already shown a wick rejection, signaling buyer interest
This is a high-probability demand area where institutions previously entered the market.
3. Volume Burst Confirmation
Inside the Reversal Zone, the chart highlights a Volume Burst area.
Why Volume Burst Matters:
Shows strong buying pressure
Indicates absorption of sell orders
Confirms demand is active at this region
If BTC revisits this zone, buyers may aggressively defend it again.
4. Expected Short-Term Movement
Your chart shows two potential scenarios:
Scenario A – Bullish Reversal (Most Likely)
Price may dip slightly into the Reversal Zone
Strong buyers react at the volume burst area
Market forms a bullish reaction candle
Break above minor consolidation leads to upward continuation
Target Levels After Reversal:
$89,800 – Pattern Completion
$90,500 – Short-Term Resistance
$91,000 – Structural High Retest
Scenario B – Bearish Breakdown (Less Likely but Possible)
If the Reversal Zone fails:
BTC may slide toward $86,500 – $85,800
This would confirm a deeper correction phase
But current PA suggests buyers are preparing a move upward.
5. Pattern Must – Confirmation Zone
A label on the chart shows "Pattern Must" around $89,500–$89,800.
This is the confirmation level where:
Break and retest = bullish continuation
Rejection = temporary sideways / deeper pullback
This acts as the neckline for a potential reversal pattern.
6. Technical Summary
Bias: Bullish from Reversal Zone
Main Support: $88,000 – $87,000 (Strong Demand)
Immediate Resistance: $89,800
Trend Outlook: Accumulation → Possible Upside Reversal
BTCUSD is currently forming a technical base, and a move upward is expected once price reacts strongly inside the Reversal Zone.
🎯 Conclusion
BTC is approaching a high-probability buying zone backed by:
Reversal Zone
Previous demand
Strong volume burst
Rounded-top breakdown structure
Market preparation for pattern completion
A bullish reversal remains the primary expectation, with targets toward $89,800 – $91,000.
Tradingviewanalysis

Temporal Drift Alpha | Rotating Volatility | Hidden Rhythm🧠 Deep Dive: Hidden Alpha in Odd Intraday Charts
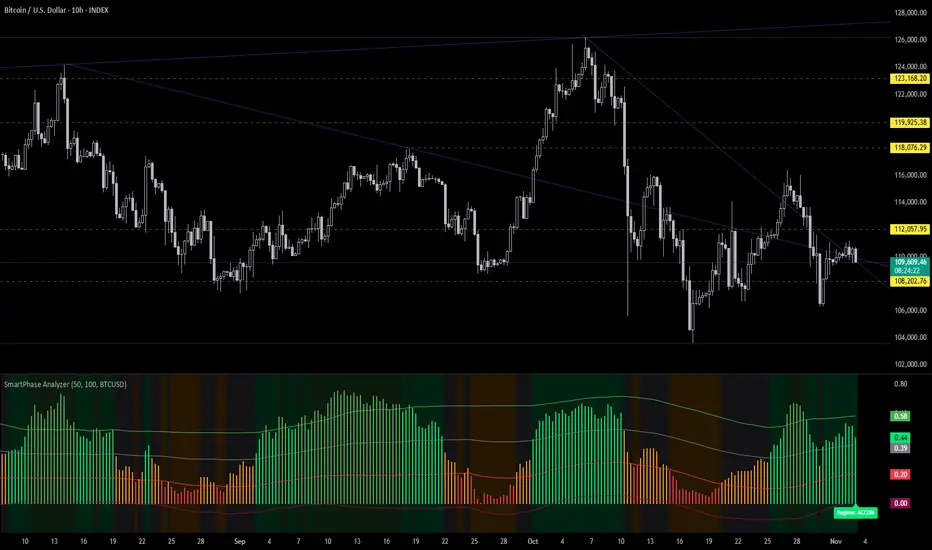
Been experimenting lately with non-standard intraday timeframes on TradingView — specifically the 10-hour chart — and it’s producing some really interesting results.
My 1D strategies only needed minor calibration to fit intraday conditions (mainly risk and signal sensitivity tweaks), but once adjusted, they started performing significantly better on 10H than on standard 4H / 12H / 1D setups.
Here’s why I think it’s happening 👇
⚙️ 1. Uneven time alignment = session drift
10H doesn’t divide evenly into 24H, so candle start times rotate across the global trading cycle (Asia → London → NY).
That means each bar is pulling from a different combination of regional liquidity and volatility windows — you’re not seeing the same “slice” of the day over and over.
- 06:00 → overlaps Asia close + London open
- 16:00 → overlaps US open
- 20:00 → catches late NY + early Asia handoff
This rotation keeps repeating every couple of days, giving you asynchronous snapshots of how the market behaves between sessions — and that’s where inefficiencies tend to hide.
📊 2. Structural alpha exposure
By breaking away from the standard 8H / 12H / 1D alignment, you end up:
- Capturing transition volatility (session overlaps)
- Avoiding compressed daily smoothing
- Getting more responsive structure shifts for trend/momentum setups
It’s basically giving you a rotating volatility lens. You’re still seeing the full picture, but through different angles each cycle.
🧩 3. Strategy behavior differences
On the 10H:
- Momentum filters trigger cleaner — fewer false breaks
- Mean reversion signals reset faster after exhaustion
- BB, RSI, EMA-type systems react smoother, since the noise from hard session resets (like 00:00 UTC) is reduced
I’m seeing way fewer “dead zones” between signals — and overall smoother PnL curves, even with identical logic.
📈 4. Practical takeaway
Odd-hour timeframes like 10H act like a “rotating frame sampler” for the market.
They shift through liquidity regimes automatically — giving you a natural form of temporal diversification.
If your 1D systems are solid but a bit laggy or overly smoothed, try re-anchoring them on 10H, 14H, or 22H and recalibrating your risk and confirmation filters slightly.
There’s legit structural alpha buried in how these bars cut across the global cycle.
🧠 TL;DR
10H charts = not random noise.
They’re asynchronous time slices that expose unbalanced session transitions — something most backtests miss.
I’ll be running deeper tests on return bias and volatility clustering per candle start hour (06:00, 16:00, 20:00, etc.), but early signs point to repeatable behavior .
This could be one of those tiny structural edges that compounds over time.
Sometimes alpha isn’t in new indicators — it’s in how we slice time. ⏳⚡️
NZD/USD Technical Analysis | Smart Money Perspective🧠 NZD/USD Technical Analysis | Smart Money Perspective
On the current NZD/USD chart, price is trading around 0.5960, positioned between a clearly defined resistance zone (0.6130–0.6150) and a support zone (0.5890–0.5900).
We can observe the following key technical elements:
🔹 1. Liquidity Sweep
Price recently broke below the previous swing low near 0.5900, tapping into a pool of sell-side liquidity. This movement is commonly interpreted as a liquidity grab, where institutions manipulate price to trigger retail stop losses before reversing.
🔹 2. Double Bottom Formation
The chart indicates a potential double bottom forming at the support level — a classic accumulation signal. This pattern suggests buyers may be stepping in after liquidity has been taken out, anticipating a reversal.
🔹 3. Fair Value Gap (FVG)
An FVG (imbalance) is visible in the range of 0.5985 to 0.6015. This inefficiency was created by a sharp bearish move, leaving price action unbalanced. Price is now expected to retrace into this area to rebalance orders — a common smart money behavior.
🔹 4. Market Structure Outlook
If the double bottom confirms with a bullish break of structure above 0.5980, we could expect a continuation toward:
First Target: FVG zone around 0.6015
Second Target: Major resistance near 0.6150, where past distribution occurred.
✅ Conclusion
This setup combines key smart money concepts:
Liquidity grab below support
Accumulation phase at demand
FVG as target
Potential bullish market structure shift
Traders should monitor price action around the support zone for confirmation (e.g., bullish engulfing or break of short-term highs) before entering long positions. Targets remain at the FVG and resistance zones, but risk management is essential in case of a deeper sweep or macroeconomic catalyst.

USDJPY Ready to Bounce – Sniper Long from Smart Money OBUSDJPY | 30-Min Bullish Setup – Premium to Discount + Order Block Reaction
USDJPY looks primed for a bullish reversal from a smart money perspective. Let’s walk through why this setup could be the cleanest long of the week 📈🧠
📌 1. Current Market Narrative:
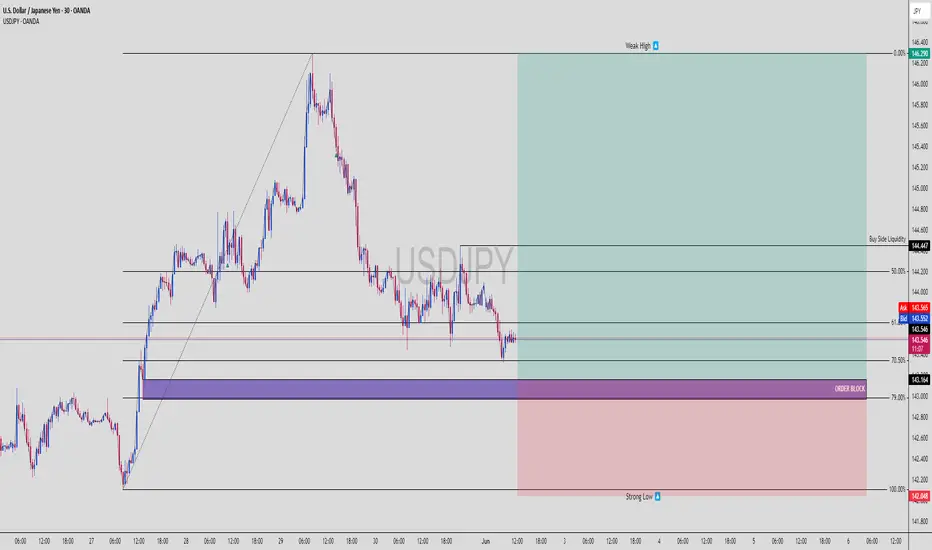
Price retraced deep into discount levels (beyond 70.5%) after a strong bullish leg
Tapped into a refined bullish Order Block (OB) sitting just above a strong low
Multiple liquidity grabs have already occurred, leaving internal structure vulnerable to a reversal
Smart money has likely accumulated below recent lows… ready to pump toward Buy Side Liquidity 🧲
🧠 2. Key Technical Levels:
✅ Order Block Zone (Entry): 143.164
🔻 Strong Low: 142.048 (protected)
🟢 Buy Side Liquidity Target: 144.447
🔼 Weak High (Magnet): 146.290
Entry Point: Within OB (143.1–143.2)
TP Zones: 144.447 (main), 146.290 (stretch target)
SL: Below OB – around 142.048
RR: ~1:4+ — sniper grade 🥷
📊 3. Smart Money Flow:
OB aligned with 70.5–79% Fibonacci discount zone (deep retrace = strong reaction)
Structure shows signs of exhaustion on the sell side
Price may now reverse with displacement toward upside inefficiencies
Buyers likely stepping in aggressively from this level
🚀 4. Execution Plan (LTF Confirmation Entry):
✅ Wait for:
M5–M15 BOS (bullish break of structure)
FVG or mitigation entry confirmation
Maintain tight SL below OB (2–3 pips buffer)
Bonus: If price holds above 143.2 with strong M5 bullish candle close, that’s go-time for smart money longs.
🧨 5. Why This Setup is 🔥:
High probability bounce zone (OB + deep fib retrace)
Clean RR structure with solid target at buy side liquidity
Market structure shift likely as lower highs start breaking
Liquidity swept under recent lows = trap complete
This is the kind of setup that institutional algos are coded to exploit 🤖
💬 Type “USDJPY Long Sniper 🥷💴” in the comments if you’re in this setup too
🔁 Save this for trade journaling or future backtest
📊 Follow @ChartNinjas88 for smart money plays every day!
XAUUSD | Premium Zone Hit – Is Gold Ready to Nuke?XAUUSD | 30-Min Bearish Setup – OB Tap + Liquidity Engineering
Let’s break this down ninja-style ⚔️
📌 1. Market Context:
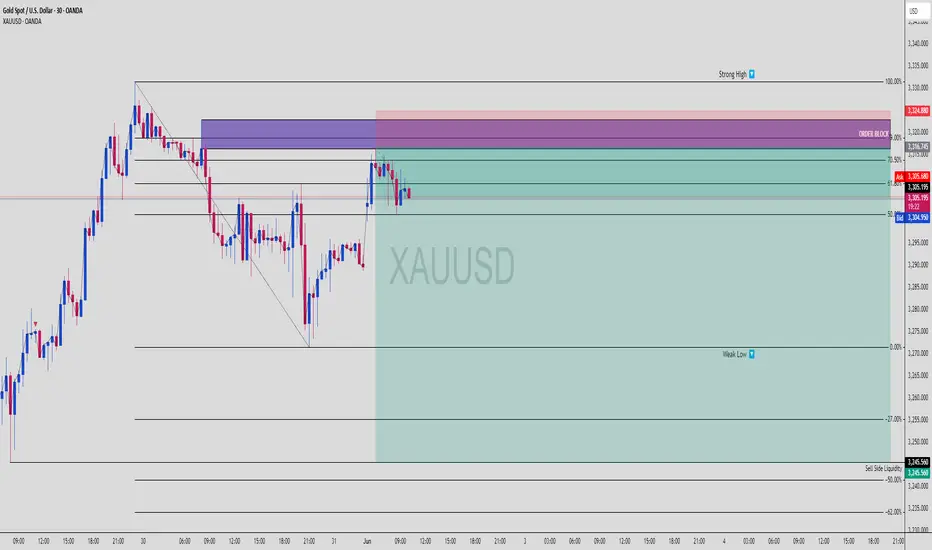
Gold has retraced into a premium pricing zone after a significant sell-off and is now:
Respecting a refined bearish Order Block
Sitting at 61.8–70.5% Fibonacci retracement (textbook premium)
Below a strong high (liquidity magnet)
This is classic smart money engineering:
➡️ Pull back
➡️ Lure in breakout buyers
➡️ Raid the high
➡️ Dump toward liquidity
🧠 2. Key Levels:
📈 Strong High: 3,324.880
🟪 Order Block Zone: ~3,316.745 to 3,324.880
🔻 Current Price: ~3,307.000
🔵 Weak Low: 3,270.000
🩸 Sell Side Liquidity: 3,245.560
We’re watching for a possible rejection from the OB and a drive down into the Sell Side Liquidity zone.
📊 3. Entry Plan (Confirmation-Based):
Wait for a bearish M5–M15 BOS from OB
Look for FVG entry or last mitigation
Target weak low & SSL
Maintain 1:2 to 1:4 RRR depending on entry precision
Ideal RR Target:
🎯 TP: 3,245.560
🛑 SL: Just above 3,324.880
🔁 RR ~ 1:3+
📉 4. SMC Story:
🧩 Price swept internal liquidity and tapped into premium zone
🔍 OB + Fib confluence = high-probability reaction area
🧲 Weak low is unprotected = juicy target for sell-off
🤖 This move could create displacement and fuel next bearish leg
Smart Money is looking to trap late longs before hitting the liquidity pool.
🎯 5. Bonus Tip:
If you’re on M1 or M5, scale into partials as the move confirms via:
Bearish engulfing
BOS + FVG combo
Lower timeframe mitigation plays
Stay reactive, not predictive. Let the market confirm the trap. ⚠️
💬 Drop “Gold Trap Setup 👑” in the comments if you see the same thing
🔁 Save this to track the next move
🎯 Follow @ChartNinjas88 for daily sniper setups!
USDJPY Setup: Weak Highs, Smart Money Buys Liquidity!!📊 USDJPY is showing signs of a Smart Money reversal from the discount zone.
This 30-minute chart reveals institutional intentions hiding in plain sight — with clear signs of engineered liquidity grabs and the potential for a strong bullish continuation.
🧠 What’s Happening on the Chart:
✅ Price has swept sell-side liquidity below the recent lows
✅ Retraced cleanly to the 61.8% Fibonacci level at 146.26, a classic Smart Money entry zone
✅ The current price is hovering around the 50% retracement, forming a potential higher low structure
📈 Bullish Confluence:
Price is rebounding from a discount zone (golden ratio: 61.8% Fib)
There’s a clearly defined "weak high" marked around 147.00 — Smart Money typically targets these areas
Above that, there are two stacked buy-side liquidity levels:
147.670
148.282
Final target? The liquidity pool near 148.654 — a clean magnet for price
🎯 Trade Idea:
Long Bias from 146.26–146.43 zone (Smart Money re-entry)
Targets:
TP1: 147.00 (Weak High)
TP2: 147.670 (Buy Side Liquidity)
TP3: 148.282 – 148.654 (Full Liquidity Sweep)
Invalidation: Clean break below 146.20 with strong bearish volume
📌 Why This Setup Works:
This setup uses Smart Money Concepts (SMC):
Weak Highs often signal institutional targets
Fair Value Gap (FVG) + Fib confluence adds strong bullish probability
Retail shorts get trapped, thinking the rally was a pullback — while institutions accumulate at discount
🧠 Pro Tip:
Watch for confirmation with a bullish engulfing candle or break of short-term structure before full entry.
Front-running the Smart Money leads to losses. Let them move first.
💬 Comment "USDJPY MOVE" if you're planning to trade this setup
💾 Save this chart for later — this is how the big players trade FX.

Equity Trade Setup – Marico Ltd. (NSE: MARICO)Trade Type: Momentum Breakout (Short-Term)
🔹 Trade Details
Buy Zone (Entry): ₹734.75 – ₹735.75
Current LTP: ₹736.80
Stoploss (SL): ₹727.00 (below swing low & 20 EMA)
Target (T1): ₹766.00
Target % Left: ~3.93%
🔍 Technical Indicators
📈 EMA Crossover: 9 EMA > 21 EMA > 50 EMA (bullish alignment)
📊 RSI: Near 60–65, with upward momentum (bullish)
🔺 Volume Surge: Confirming breakout from consolidation zone
✅ Client Advisory Summary
BUY MARICO LTD at ₹734.75–735.75 for a short-term breakout move.
Target: ₹766.00
Stoploss: ₹727.00
Timeframe: 1–3 Days
R:R Ratio: ~3:1
Confidence: High (based on EMA alignment, RSI strength, and volume confirmation)
For Education Purposes Only

The EURUSD Rollercoaster: Buckle Up, Bears and BullsHey there, currency cowboys and cowgirls! Grab your Stetsons and get ready for a rootin', tootin' ride in the forex rodeo, because it's FX:EURUSD week! We're diving into the labyrinth of the most traded currency pair on the planet, where the Eagles (USD) and the Sphinxes (EUR) battle it out in a mythical arena of numbers, trends, and Fibonacci spirals. It's not just a currency pair; it's a tale of two continents, and boy, do we have a story for you this week.
Technical Tango: Who's Leading?
Now, y'all know that trends are like a Texas two-step; you gotta know when to lead and when to follow. And right now, the EURUSD has been do-si-do-ing in a downtrend since the break of dawn—okay, since the beginning of the year—but you get the point.
Last week, the pair two-stepped right below the critical support line of 1.0832. For those of you just tuning in, support levels are like the floor of a dance hall. Once you fall through one, you're tumbling down to the next. Our next dance floor—or should I say support level—is at 1.0609, painted by the brushstrokes of the 38.2% Fibonacci retracement of the recent rally from 0.9534 to 1.1274. A mouthful, I know, but stay with me, we're about to get to the good stuff.
The RSI Rodeo Clown
Now, every rodeo needs a clown to keep things from getting too rough. In the EURUSD circus, that role is played by the Relative Strength Index (RSI). Now, before you think it's just a hootin', tootin' sideshow, remember: the RSI is a powerful tool that can help you read the room—or market, in this case. It's currently in oversold territory, which could mean the bears are taking a breather and pawing through their salmon reserves.
So, a rebound may be in sight. But don't start doing cartwheels yet. The overall trend is still a bearish ballad, and seeing the pair plummet below 1.0609 would be as unsurprising as a country song about a truck.
Fundamentally Yours
Let's pivot and talk about something even spicier—the fundamentals! The band isn't just playing a sad country tune for no reason. It turns out, the European Central Bank (ECB) raised interest rates in July. Normally, this would have the euro dancing like a cat on a hot tin roof. But hold your horses: the Federal Reserve is also in the race and planning on raising rates, but even more aggressively. The result? A widening yield gap that makes the U.S. dollar look like the belle of the ball.
And oh, let's not forget the curveball that life loves to throw—war and rising costs. Europe is stuck in a tug-of-war with ongoing unrest in Ukraine and energy prices soaring faster than a rocket at a Fourth of July party. These headwinds could keep the euro grounded and make the ECB think twice before upping those rates.
Keep Those Peepers Peeled
Now, I know we've been painting a bearish barn, but it's not all gloom and doom. Watch the RSI like a hawk circling a field mouse; a sustained move above 50 could be your canary in the coal mine for a rebound. Also, keep your ear to the ground for any upbeat news about the European economy or the ECB. In this rollercoaster of a market, any breaking news can turn into a market mover faster than you can say "Yeehaw!"
The Bottom Line
So there you have it, folks. The EURUSD is living out its own spaghetti western, complete with villains, heroes, and an uncertain ending. The technical charts and the fundamental climate are both playing the blues for the euro. For this week, expect the pair to keep testing the limits of the 1.0609 support level.
But remember, the market is as predictable as a cat at a dog show. Keep your eyes on the indicators and your finger on the trigger, ready to adapt your strategies at a moment's notice. It's going to be a wild week, so tighten your saddle, because we're in for one heck of a ride!
Yeehaw, traders! 🤠
*Note: This article is for informational and entertainment purposes and should not be considered financial advice. Always do your own research and consult with financial professionals before making any investment decisions.*

🚀📈 Massive Profits: 20% Gains on $UPWK and 78% Surge on $SUNW📈🔥 Get ready to witness the power of falling wedge patterns as we share our latest triumphs! Our TradingView predictions were spot-on last month as we called out the breakout of the falling wedge pattern on NASDAQ:UPWK , resulting in a remarkable 20% gain. But that's not all! We also accurately identified and shared insights on the explosive NASDAQ:SUNW falling wedge breakout, which skyrocketed by an impressive 78%! Don't miss out on our exceptional TradingView ideas and analysis. Join us now to stay ahead of the game and unlock profitable opportunities in the market!
In this description, we highlight the success of the falling wedge patterns on NASDAQ:UPWK and NASDAQ:SUNW that were accurately called out on TradingView. We create a sense of excitement and urgency, encouraging viewers to check out our TradingView ideas for valuable insights and opportunities in the market.
#TradingViewAnalysis #TradingViewIdeas #FallingWedgePattern #StockMarket #ProfitableTrades #TechnicalAnalysis #StockTrading #TradingOpportunities #MarketInsights #TradingSuccess

📈 $APE Wedge Setup Identified! 📉Hey traders! I've identified a potential wedge setup on NYSE:APE that could present an exciting trading opportunity. Let's dive into the details!
📌 Ticker: NYSE:APE
📌 Wedge Pattern: Identified
📌 Timeframe: 2 day RSI - Wedge Identified
📊 Chart Analysis:
The price action on NYSE:APE has formed a wedge pattern, characterized by converging trendlines. This pattern typically indicates a potential breakout or breakdown in the near future.
📈 Bullish Scenario:
If the price breaks above the upper trendline of the wedge with significant volume, it could signal a bullish breakout. This may lead to a potential upward move in the price, presenting a buying opportunity.
📉 Bearish Scenario:
Conversely, if the price breaks below the lower trendline of the wedge with significant volume, it could indicate a bearish breakdown. This may result in a potential downward move in the price, offering a potential selling opportunity.
💡 TradingView Analysis:
For a more detailed analysis, feel free to check out the chart on TradingView using the following link:
📣 Let's connect and discuss this potential trade setup! Share your thoughts and analysis in the comments below.
🔔 Don't forget to follow for more updates on NYSE:APE and other exciting trading opportunities!
#APE #WedgePattern #Breakout #TradingOpportunity #TechnicalAnalysis #TradingViewAnalysis
Disclaimer: This is not financial advice. Remember to do your own research and consider your risk tolerance before making any trading decisions.
Happy trading, and may the markets be in your favor!
STP - Professor Node It All

Bullish Potential on $PYPL: Falling Wedge Pattern Greetings, Traders! Today, I'm excited to share an intriguing technical analysis discovery on the stock of PayPal Holdings Inc. ( NASDAQ:PYPL ). A falling wedge pattern has been identified, indicating the potential for a bullish reversal in the near future. Let's dive into the details!
📈 Ticker: NASDAQ:PYPL
📅 Timeframe: Daily Chart
📊 Pattern: Falling Wedge
📉 Understanding the Falling Wedge Pattern:
A falling wedge is a bullish chart pattern characterized by converging trendlines that slope downward. Typically formed during a downtrend, it suggests diminishing selling pressure and the potential for a reversal. This pattern indicates the possibility of an upward price movement.
🔍 Identifying the Falling Wedge on NASDAQ:PYPL :
Upon analyzing the daily chart of NASDAQ:PYPL , the following observations come to light:
1️⃣ Recent downtrend: NASDAQ:PYPL has experienced a decline in price over the past weeks.
2️⃣ Converging trendlines: The upper trendline connects the lower highs, while the lower trendline connects the lower lows.
3️⃣ Decreasing trading volume: As the falling wedge pattern forms, the trading volume has been declining, indicating a potential reduction in selling pressure.
📈 Price Targets and Trading Strategy:
If the falling wedge pattern on NASDAQ:PYPL plays out as anticipated, a potential bullish breakout above the upper trendline may occur, signaling a reversal and potential price appreciation. Consider the following price targets:
1️⃣ Target 1: Resistance level near $320.00
2️⃣ Target 2: Psychological resistance near $340.00
🛡️ Risk Management:
Implement the following risk management techniques to protect your capital and manage risk effectively:
1️⃣ Set a stop-loss order below the lower trendline to safeguard against unexpected price reversals.
2️⃣ Adjust position size based on your risk tolerance and overall portfolio management strategy.
🔔 Conclusion:
PayPal Holdings Inc. ( NASDAQ:PYPL ) is exhibiting a falling wedge pattern, suggesting the potential for a bullish reversal in the near future. However, please remember that technical analysis has limitations, and market conditions can change. Incorporate additional analysis and fundamental factors before making any trading decisions.
Disclaimer: This post is for informational purposes only and should not be considered as financial advice. Always conduct your own research and consult with a qualified financial professional before making any investment decisions.
Happy Trading! 📈💰
#TradingViewAnalysis #TechnicalAnalysis #FallingWedgePattern #BullishReversal #PYPLStock #StockMarketAnalysis #ChartPatterns #TradingSignals #InvestSmart #FinancialMarkets #MarketAnalysis

Falling Wedge Pattern on $BLNK: Potential Bullish Reversal Greetings, Traders! Today, I'm thrilled to share an exciting technical analysis finding on the stock of Blink Charging Co. ( NASDAQ:BLNK ). A falling wedge pattern has been identified, suggesting the potential for a bullish reversal in the near future. Let's dive into the details!
📈 Ticker: NASDAQ:BLNK
📅 Timeframe: Daily Chart
📊 Pattern: Falling Wedge
📉 Understanding the Falling Wedge Pattern:
A falling wedge is a bullish chart pattern characterized by converging trendlines that slope downward. Typically formed during a downtrend, it indicates diminishing selling pressure and the potential for a reversal. This pattern suggests the possibility of an upward price movement.
🔍 Identifying the Falling Wedge on NASDAQ:BLNK :
Upon analyzing the daily chart of NASDAQ:BLNK , the following observations come to light:
1️⃣ Recent downtrend: NASDAQ:BLNK has experienced a decline in price over the past weeks.
2️⃣ Converging trendlines: The upper trendline connects the lower highs, while the lower trendline connects the lower lows.
3️⃣ Decreasing trading volume: As the falling wedge pattern forms, the trading volume has been declining, indicating a potential reduction in selling pressure.
📈 Price Targets and Trading Strategy:
If the falling wedge pattern on NASDAQ:BLNK plays out as anticipated, a potential bullish breakout above the upper trendline may occur, leading to a reversal and potential price appreciation. Consider the following price targets:
1️⃣ Target 1: Resistance level near $40.00
2️⃣ Target 2: Psychological resistance near $45.00
🛡️ Risk Management:
Effective risk management is crucial for successful trading. Implement the following risk management techniques:
1️⃣ Set a stop-loss order below the lower trendline to protect against unexpected price movements.
2️⃣ Adjust position size based on your risk tolerance and overall portfolio management strategy.
🔔 Conclusion:
Keep a close watch on Blink Charging Co. ( NASDAQ:BLNK ) as it develops this falling wedge pattern. The pattern suggests the potential for a bullish reversal in the near future. However, please note that technical analysis is not infallible, and market conditions can change rapidly. It's advisable to incorporate additional analysis and fundamental factors before making any trading decisions.
Disclaimer: This post is for informational purposes only and should not be considered as financial advice. Always conduct your own research and consult with a qualified financial professional before making any investment decisions.
Happy Trading! 📈💰
#tradingview #technicalanalysis #fallingwedge #bullishreversal #blnk #stockanalysis #chartpatterns #tradingstrategies #investing #finance #marketanalysis

Bitcoin - (BTC-USD) Bitcoin is currently traded at 16550. And made an arrow shape in a 4H chart frame. if the price breaks the arrow shape, then resistance is at 18250 and support is 14250, which is already shown in the graph.
