XPloRR S&P500 Stock Market Crash Detection StrategyXPloRR S&P500 Stock Market Crash Detection Strategy
Long-Term Trailing-Stop strategy detecting S&P500 Stock Market Crashes/Corrections and showing Volatility as warning signal for upcoming crashes
Detecting or avoiding stock market crashes seems to be the 'Holy Grail' of strategies.
Since none of the strategies that I tested can beat the long term Buy&Hold strategy, the purpose was to detect a stock market crash on the S&P500 and step out in time to minimize losses and beat the Buy&Hold strategy.
So beat Buy&Hold strategy with less then 10 trades. 100% capitalize sold trade into new trade.
With the default parameters the strategy generates 5954% profit, with 6 closed trades, 100% profitable, while the Buy&Hold strategy only generates 2427% profit, so this strategy beats the Buy&Hold strategy by 2.45 times!
Also the strategy detects all major S&P500 stock market crashes and corrections since 1980 depending on the Trailing Stop Smoothness parameter, and steps out in time to cut losses and steps in again after the bottom has been reached. The 5 crashes/corrections of 1987, 1990, 2001, 2008 and 2010 were successfully detected with the default parameters.
The script shows a lot of graphical information:
the close value is shown in light-green. When the close value is temporarily lower than the buy value, the close value is shown in light-red. This way it is possible to evaluate the virtual losses during the trade.
the trailing stop value is shown in dark-green. When the sell value is lower than the buy value, the last color of the trade will be red (best viewed when zoomed)
the EMA and SMA values for both buy and sell signals are shown as colored curves
the buy and sell(close) signals are labeled in blue
the Volatility is show below in green and red. The alert treshold (red) is default set to 200 (see Volatility Warning Treshold parameter below)
Trailing Stop Smoothness value:
Adjust the Trailing Stop Smoothness parameter to hide/show smaller corrections/crashes:
96: 6 trades, 100% profit, 5954% profit, detected crashes: 1987, 1990, 2001, 2008, 2010
90: 8 trades, 100% profit, 5347% profit, detected crashes: 1984, 1987, 1990, 2001, 2008, 2010, 2011
74: 9 trades, 100% profit, 4964% profit, detected crashes: 1984, 1987, 1990, 2001, 2008, 2010, 2011, 2015
41: 10 trades, 100% profit, 4886% profit, detected crashes: 1984, 1987, 1990, 1998, 2001, 2008, 2010, 2011, 2015
How to use this Strategy ?
Look in the strategy tester overview to optimize the values Percent Profitable and Net Profit (using the strategy settings icon, you can increase/decrease the parameters), then keep using these parameters for future buy/sell signals on the S&P500.
More trades don't necessarily generate more overall profit. It is important to detect only the major crashes and avoid closing trades on the smaller corrections. Bearing the smaller corrections generates a higher profit.
Watch out for the volatility alerts generated at the bottom (red). Threshold can by changed by the Volatility Warning Threshold parameter (default 200 = 2% ATR). In almost all crashes/corrections there is an alert ahead of the crash.
Although the signal doesn't predict the exact timing of the crash/correction, it is a clear warning signal that bearish times are ahead!
The current correction in march 2018 is not yet a major crash but there was already a red volatility warning alert. If the volatility alert repeats the next weeks/months, chances are higher that a bigger crash or correction is near.
As can be seen in the graphic, the deeper the crash is, the higher and wider the red volatility signal goes. So keep an eye on the red flag!
To use this strategy for future trades, set the end date past today and set the Sell On End Date value to false
Information about the parameters: see below
Trailingstop

UUSDJPY trend is broken, correction is comingI has already shared my opinion about USDJPY market at the beginning of this week, an this idea is quite profitable for me today. Follow me for getting more valuable ideas :)
Now we have one important trend line broken and it gives opportunity to open some very safe positions, with TP/SL coefficient around 6. I have added to my position and see 2 goals here - Moving Averages and the old one - weekly trend line. My plan is to close half on each. In the MAs area I am going to turn my trailing stop on (500 points). In the case of SL and turning up again I will reopen. Anyway I'll post my progress on this idea.

US DOLLAR CURRENCY INDEX 1H CLAW STRATEGY LONGClaw Strategy Indicator works on all markets
Entry shown
Take Profit shown
Stop Loss shown
For more information leave a comment below

I'm going long with a buy stop at 100.541 with a trailing stop.#USDJPY I noticed an obvious bullish pennant with a break out that happened right at the buzzer. (I don't see this break out on metatrader 4, it was news to me as I looked at the chart on tradingview.com) I plan on setting a trailing stop and riding the wave.
Short and sweet.

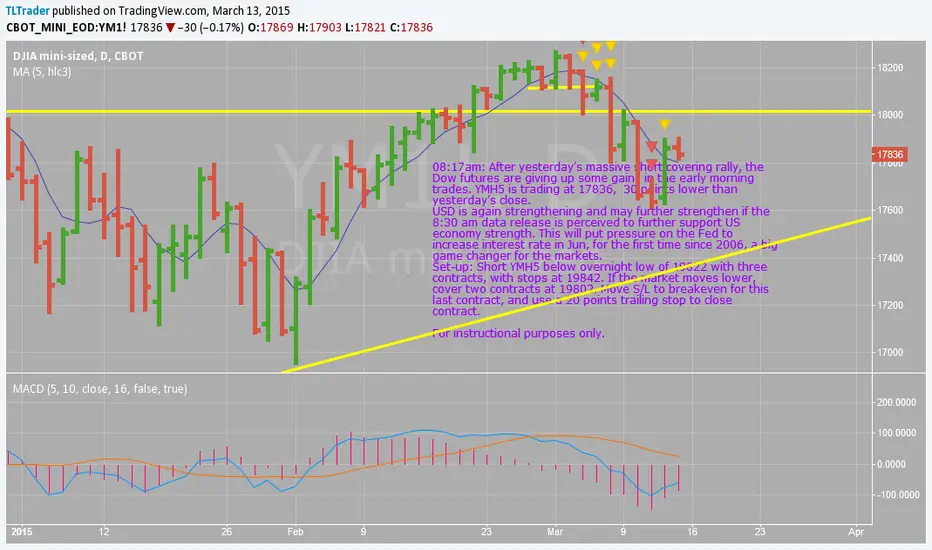
Dow Futuresl, YMH5, Mar 13 Set-up08:17am: After yesterday’s massive short covering rally, the Dow futures are giving up some gains in the early morning trades. YMH5 is trading at 17836, 30 points lower than yesterday’s close.
USD is again strengthening and may further strengthen if the 8:30 am data release is perceived to further support US economy strength. This will put pressure on the Fed to increase interest rate in Jun, for the first time since 2006, a big game changer for the markets.
Set-up: Short YMH5 below overnight low of 19822 with three contracts, with stops at 19842. If the market moves lower, cover two contracts at 19802. Move S/L to breakeven for this last contract, and use a 20 points trailing stop to close contract.
For instructional purposes only.