#TRB/USDT About to Explode or Fake Out Everyone Again ?#TRB
The price is moving within a descending channel on the 1-hour frame, adhering well to it, and is heading for a strong breakout and retest.
We have a bearish trend on the RSI indicator that is about to be broken and retested, which supports the upward breakout.
There is a major support area in green at 30.00, representing a strong support point.
We are heading for consolidation above the 100 moving average.
Entry price: 32.00
First target: 33.28
Second target: 34.50
Third target: 36
Don't forget a simple matter: capital management.
When you reach the first target, save some money and then change your stop-loss order to an entry order.
For inquiries, please leave a comment.
Thank you.
Trblong

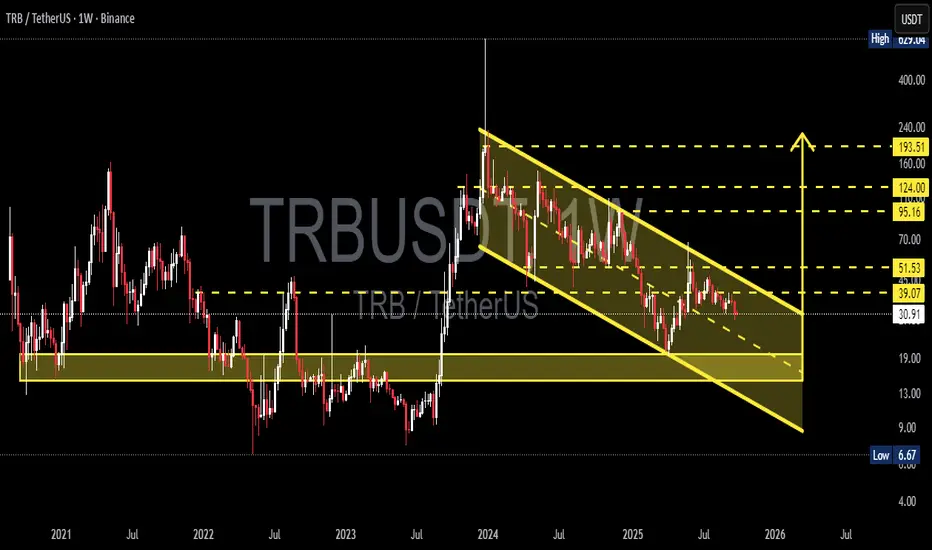
TRB/USDT — Breakout Toward 124 or Breakdown to 13?TRB (Tellor) is now entering a crucial phase. After the massive rally in 2024, the market has pushed TRB into a structured correction forming a clear descending channel on the weekly timeframe. This chart reflects the ongoing battle between long-term accumulation and medium-term selling pressure.
---
🔎 Technical Structure
1. Descending Channel (Bearish Structure):
Price continues to form lower highs & lower lows, confirming sellers remain dominant.
The channel can act either as a distribution phase before further breakdown, or a long-term accumulation phase before reversal.
2. Historical Support Zone (13 – 19 USDT):
This area has served as a major turning point multiple times since 2021.
A breakdown below this level could trigger a capitulation move toward the channel bottom near 9 USDT.
3. Key Resistance (39 – 51 USDT):
This is the “first gateway” for bullish validation.
A strong breakout here with volume could unlock a rally toward 95 – 124 USDT.
4. Fibonacci / Historical Levels:
95.16 → Strong psychological resistance.
124.00 → Potential major profit-taking zone.
193.51 → Long-term target if a full bullish trend resumes.
---
🚀 Bullish Scenario (Potential Reversal)
Confirmation: Weekly close above the descending channel with a successful retest.
Targets (Stage 1): 39.07 → 51.53.
Targets (Stage 2): 95.16 → 124.00.
Narrative: A breakout from the channel signals the end of the long correction, opening the door for buyers to step in aggressively above 51 USDT.
---
📉 Bearish Scenario (Continuation)
Confirmation: Strong rejection at the channel upper boundary + breakdown below 30 USDT.
Targets (Stage 1): 19 USDT (minor support).
Targets (Stage 2): 13 USDT → 9 USDT (channel bottom).
Narrative: As long as price remains within the channel, bearish sentiment dominates. A breakdown of historical support means a potential capitulation before the next accumulation cycle.
---
🧭 Trading Strategy
Conservative Traders: Wait for a weekly breakout + retest before going long (low risk – high reward).
Aggressive Traders: Scale into the 13 – 19 zone with tight stops below 13.
Short Traders: Look for rejection at the upper/midline channel for swing shorts targeting support zones.
Risk Management: TRB is highly volatile (as seen in 2024) — always cap risk at 1–3% per position.
---
📌 Conclusion
TRB is at a major crossroads. While the descending channel still favors the bearish trend, a confirmed breakout would be a game-changer, signaling the end of correction and opening the way toward 95–124 USDT. On the flip side, failure to hold above 30 could drag price back to 13–19 or even 9 USDT.
This setup is not just about chart patterns, but also about market psychology: Is TRB ready for long-term accumulation, or is one more leg down still ahead?
---
#TRB #TRBUSDT #Crypto #Altcoin #PriceAction #TechnicalAnalysis #DescendingChannel #Breakout #SwingTrading #SupportResistance
Today's signalHello friends🙌
🔊After the good growth of this currency, you can see that the price has corrected at the top of the channel and now that we are near the bottom of the channel, there is a good opportunity to buy in stages and with capital and risk management and move with it to the specified goals.
🔥Join us for more signals🔥
*Trade safely with us*

#TRB/USDT#TRB
The price is moving within a descending channel on the 1-hour frame, adhering well to it, and is heading for a strong breakout and retest.
We are seeing a bounce from the lower boundary of the descending channel, which is support at 30.84.
We have a downtrend on the RSI indicator that is about to be broken and retested, supporting the upward trend.
We are looking for stability above the 100 Moving Average.
Entry price: 28.20
First target: 29.00
Second target: 29.87
Third target: 30.84

TRBUSDT Analysis: Big Picture, Big WinnersFolks, I know you’re not used to these high timeframe zones , but let me tell you, the biggest winners always come from these. That’s right, TRBUSDT is all about patience and vision. This is a monthly analysis , and I want to see the real traders step up and follow this closely.
Here’s Why It’s Huge:
High Timeframe Zones: Not for the faint-hearted. This is where legends are made.
Massive Potential: You can’t beat the rewards these zones bring—pure gold, folks.
The Tools: I’m using CDV, liquidity heatmaps, volume profiles, and volume footprints to nail these levels. Only the best techniques for the best trades.
Learn From a Winner: I can teach you how to master CDV, liquidity heatmaps, volume profiles, and volume footprints . DM me if you’re serious about winning.
Remember This: The patient trader always wins. These zones demand respect, and the rewards are unmatched.
If this resonates with you, boost it, comment on it, and follow me. Let’s find the biggest trades together!
Let me tell you, folks, this is amazing. Nobody does analysis like I do. Believe me. If this helps you, don't forget to boost and comment! It’s a big deal, motivates me to share even more winning insights with you. Tremendous insights.
I keep my charts the best—clean, simple, and clear. You know it, I know it, clarity leads to better decisions. No question about it. My approach? Built on years of tremendous experience. Incredible track record. I don’t claim to know it all, but I spot high-probability setups like nobody else. Trust me.
Want to learn how to use the heatmap, cumulative volume delta, and volume footprint techniques I use to determine demand regions with stunning accuracy? Send me a private message—totally free, folks. That’s right. I help anyone who wants it, absolutely no charge. Unbelievable value.
Here’s the list—long list, great list—of some of my previous incredible analyses. Each one, a winner:
🎯 ZENUSDT.P: Patience & Profitability | %230 Reaction from the Sniper Entry
🐶 DOGEUSDT.P: Next Move
🎨 RENDERUSDT.P: Opportunity of the Month
💎 ETHUSDT.P: Where to Retrace
🟢 BNBUSDT.P: Potential Surge
📊 BTC Dominance: Reaction Zone
🌊 WAVESUSDT.P: Demand Zone Potential
🟣 UNIUSDT.P: Long-Term Trade
🔵 XRPUSDT.P: Entry Zones
🔗 LINKUSDT.P: Follow The River
📈 BTCUSDT.P: Two Key Demand Zones
🟩 POLUSDT: Bullish Momentum
🌟 PENDLEUSDT.P: Where Opportunity Meets Precision
🔥 BTCUSDT.P: Liquidation of Highly Leveraged Longs
🌊 SOLUSDT.P: SOL's Dip - Your Opportunity
🐸 1000PEPEUSDT.P: Prime Bounce Zone Unlocked
🚀 ETHUSDT.P: Set to Explode - Don't Miss This Game Changer
🤖 IQUSDT: Smart Plan
⚡️ PONDUSDT: A Trade Not Taken Is Better Than a Losing One
💼 STMXUSDT: 2 Buying Areas
🐢 TURBOUSDT: Buy Zones and Buyer Presence
🌍 ICPUSDT.P: Massive Upside Potential | Check the Trade Update For Seeing Results
🟠 IDEXUSDT: Spot Buy Area | %26 Profit if You Trade with MSB
📌 USUALUSDT: Buyers Are Active + %70 Profit in Total
🌟 FORTHUSDT: Sniper Entry +%26 Reaction
🐳 QKCUSDT: Sniper Entry +%57 Reaction
📊 BTC.D: Retest of Key Area Highly Likely
And that’s just the start. The list goes on and on, folks. It’s a tremendous list, the best. I stopped adding because, frankly, it’s tiring. So many wins. People are amazed. You can check my profile and see for yourself—winning moves, all the time. Believe me, nobody does it better.

$TRBUSDT DUMP PLAN - Limit DIP !Hello,
I would love to share my analysis with you on TRBUSDT for at least 100% move within a week.
If BTC dumps to 78-80k which is likely to dump then I have placed TRB limit without any doubt here.
Confluences:
- Weekly Liquidity Lying On My Order Block
- 1D Impulse Order Block
- Institutional Area Of Interest

#TRB/USDT Ready to go up#TRB
The price is moving in a descending channel on the 1-hour frame and sticking to it well
We have a bounce from the lower limit of the descending channel, this support is at 65.90
We have a downtrend, the RSI indicator is about to break, which supports the rise
We have a trend to stabilize above the moving average 100
Entry price 67.20
First target 68.64
Second target 70.00
Third target 71.24

#TRB/USDT#TRB
The price is moving in a descending channel on the 1-hour frame upwards and is expected to continue.
We have a trend to stabilize above the moving average 100 again.
We have a downtrend on the RSI indicator that supports the rise by breaking it upwards.
We have a support area at the lower limit of the channel at a price of
62.
Entry price 70.10.
First target 77.23.
Second target 86.91.
Third target 97.86.

TRBUSDTTRB ~ 1W
#TRB Make purchases gradually on this support block. with a short term target of at least 20%++. So far this support block continues to hold the price.

#TRB/USDT#TRB
The price is moving in a descending channel on the 12-hour frame and is sticking to it very well and is about to break upwards
We have a bounce from the lower limit of the channel at a price of 54
We have an upward trend on the RSI indicator that is about to break, which supports the rise
We have a trend to stabilize above the moving average 100
Entry price 67.00
First target 85.00
Second target 96.91
Third target 114.70

#TRB (SPOT) entry range( 43- 50) T. (135.5) SL (41.46)BINANCE:TRBUSDT
Keep the order in entry range & waiting for the price to come to fill your order
entry range ( 43- 50)
Target1 (76.90)- Target2 (105.5) - Target3 (135.5)
SL .1D close below (41.46)
*** Collect slowly in the entry range ****
*** This trade is short time investment ****
**** #Manta ,#OMNI, #DYM, #AI, #IO, #XAI , #ACE #NFP #RAD #WLD #ORDI #BLUR #SUI #Voxel #AEVO #VITE #APE #RDNT #FLUX #NMR #VANRY #TRB #HBAR #DGB #XEC #ERN #ALT #IO #ACA ****

TRBUSDTTRB ~ 5D
#TRB If you have Conviction on this Coin. Start buying gradually on this support Block. it's just a matter of time until the bulls pump up prices again.

#TRB/USDT#TRB
We have a bearish channel pattern on a 4-hour frame, the price moves within it and adheres to its limits well
We have a green support area at the price of 100 after the price touched it and bounced from it
We have a tendency to stabilize above moving average 100
We have a downtrend on the RSI indicator that supports the price higher with a breakout
Entry price is 108.00
The first target is 122.00
The second goal is 134.00
the third goal is 145.24

#TRB/USDT#TRB
The price is moving in a bearish flag channel on a 12-hour frame and we have a support area in green at the level of the lower border of the channel at the price of $80.
We have a trend to rise above the Moving Average 100
The RSI indicator has a downtrend that is about to break higher
Entry price 87
First goal 98
The second goal is 113.50
Third goal 151

#TRB/USDT LONG#TRB
The price is moving in a descending triangle pattern on 1 D frame
It is expected that this triangle will be penetrated upward and re-penetrated
With stability above the moving average of 100
We have strong support to rely on at the borders of the lower channel
Also we have oversold on MACD
Current price 113.83
The first goal is 125.77
The third goal is 137.51
The third goal is 150.84

TRBUSDT Next Target 500$.TRBUSDT Technical analysis
TRBUSDT Currently trading at $115
TRB/USDT is on the verge of another breakout and clearly heading towards our next Target around 500$.
As the whole crypto market is currently on the bullish sentiments and expected a new ATH before the halving. So we are confident in the breakout and another clean rally towards 500$.
Fundamentally TRB is one interesting and technology sound project which has the potential to be in the top 50 projects.
Buy level: Above $114
Stop loss: Below $75
TP1: $144
TP2: $220
TP3: $315
TP4: $500
Max Leverage 2x
Always keep Stop loss

TRBUSDT About To Hit New ATH!TRBUSDT formed a cup and handle pattern on the daily chart, with price nearing the neckline. The $164 level, a previous ATH resistance, awaits above. A breakout could trigger a significant bullish move for TRB.
Buy zone : Below $120
Stop loss : $88
Take Profit 1: $160.00
Take Profit 2: $220.00
Take Profit 3: $400.00
Regards
Hexa

TRB/USDT: Perfect Entry is around the corner 🍀After BINANCE:TRBUSDT crashing around 50% within a week, we can see a slow consolidation with signs of recovering the price.
If we look at the patterns we can see a strong consolidation with strong resistance pushing the price back.
I think TRB has a good potential to reach 140$ again if we get a strong breakout of the price.
In the coming days we can see price getting rejected again at the resistance and i'm expecting the price to breakout successfully after few rejections.
We can enter a LONG trade after the succesful breakout.
We will update this ideas when we enter the trade.
Stay tuned for more updates. Like and share your thoughts in the comments. Your contribution is much appreciated.
Cheers!
GreenCrypto

$TRB SOON BREAKOUT LSE:TRB SOON BREAKOUT
How to Trade Breakouts Using Trend Lines, Channels and Triangles
Trend line
As you may know, a trend line is a trading tool.
That’s right.
It’s a trading tool, not some magic line on your chart!
It means that the effectiveness of this tool lies in how well you use it.
But here’s one thing it’s truly good at:
Helping you identify areas of value in a trending market

TRBUSDT Buy Setup!TRBUSDT Technical analysis update
Buy zone : Below $16.80
Stop loss : $15.05
Take Profit 1: $18.30
Take Profit 2 : $22.00
Take Profit 3 : $29.50
Take Profit 4 : $43.50
Thanks
Hexa

$TRB #TRB | LTF LONGIf the price passes red line, I expect price visits to upper levels like 15.2 & 15.4.
If the price closes below 14.44 , I expect price visits to lower levels like 13.8.
For short-term trading: Focus on 14.17 & 14.21.
Have a nice week!

TRB Very BullishHello good time
I think this currency is very bullish. We have a structural failure. Also, the strength and volume of buyers is also high.
Good correction.
Comment if you have any questions
Thank You

TRB LONG (Day Trade)I like TRB here.
I longed TRB with only a small position since BTC still unstable.
Risky play so only use small margin.
